ES S/R Map for 11-6-09
Btw Kool, interesting chart you posted on this page: http://www.mypivots.com/forum/topic.asp?TOPIC_ID=5075&whichpage=3
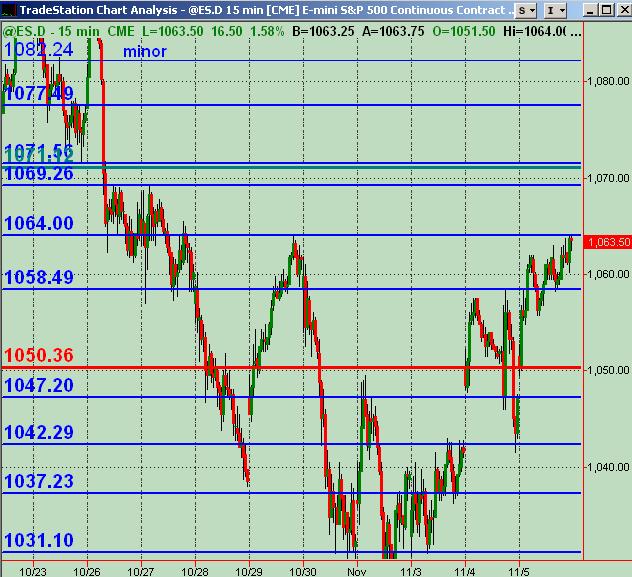
Here's what I've got for potential significant S/R price areas for Friday using a 15 minute chart. Blue=price action S/R ... Red line is Wkly Mid-Pvt ... Green(ish) line is Wkly R1 Pvt. Pleas offer any and all feedback and analysis and charts etc. !
Jobless report will be premkt ... so may be some interesting gyrations to watch.
Click image for original size
61.25 is my best so far..they stil need an hour range break....
Anyone buy the open gap ... or short that 69 area? Just curious. Only a premkt trade off of the jobs report for pocket change here so far. It's currently trying to hold the 58.50 area around where the Daily Mid Pvt is ... but don't trust it long here yet ... it ain't acting right (but the NQ keeps trying to pop up with ES not reacting as much).
61 - 62 has given us the volume spikes today on up and down....so that is top dog
If it gets back above 64 ... think we'll at least test the day's high
I guess the way i see it is ... it already tested the high once (within one tick!) so i dontthink it will again . it will likely fall short around the 1067.25 projection i have or go thru the high to 1071-73. Best guess (and thats all it is) is she falls short! (and closes today flat
Click image for original size
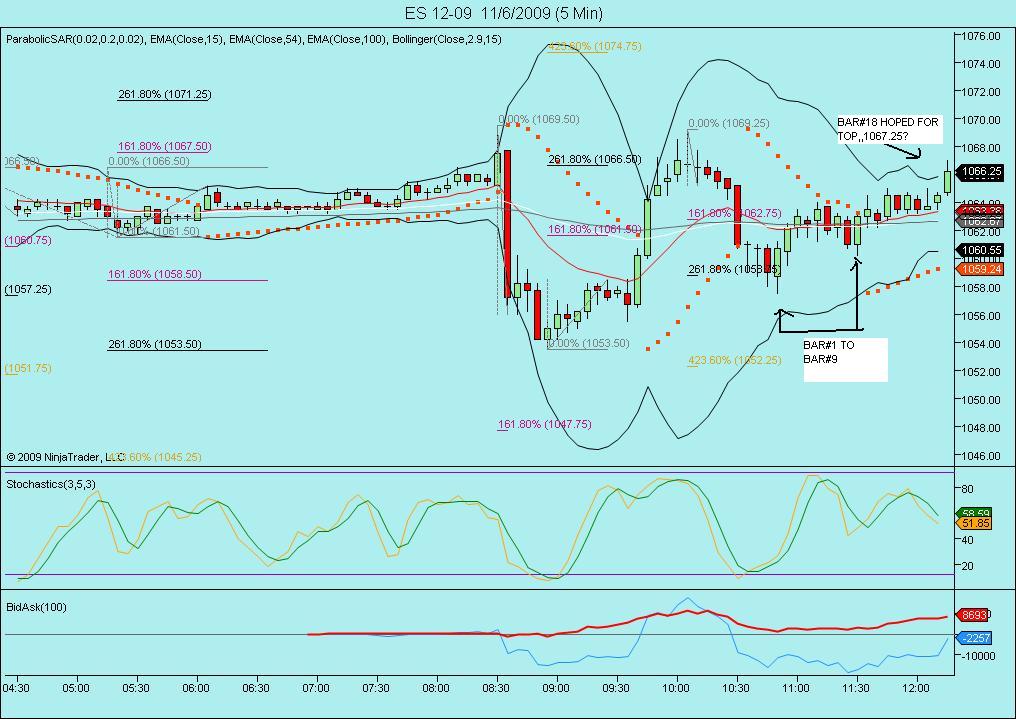
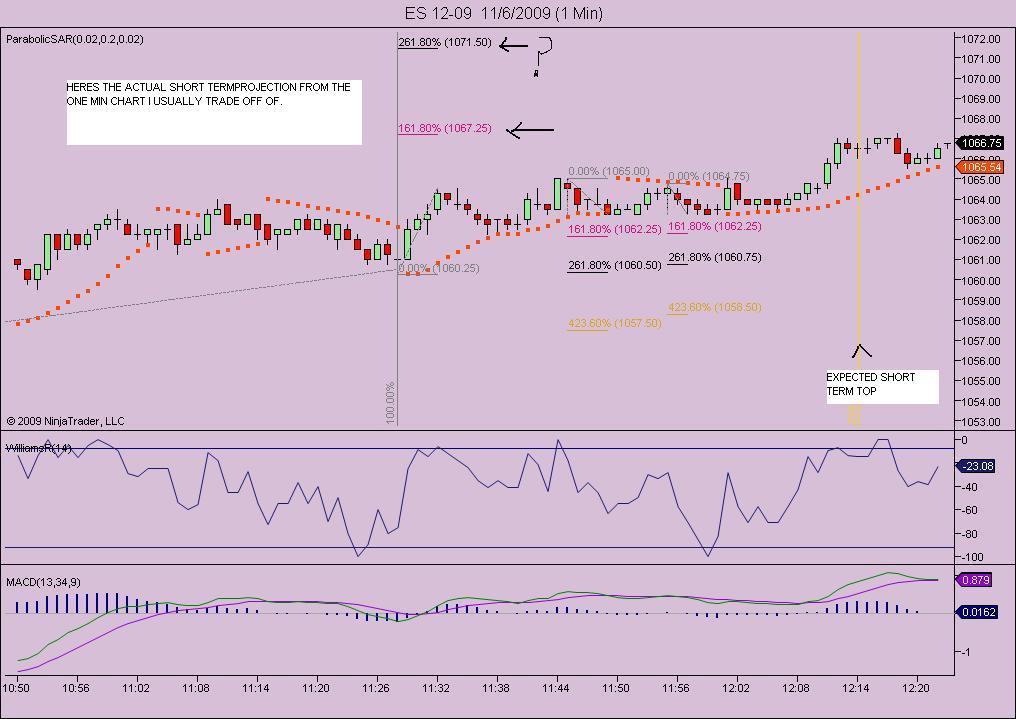
...FORGOT TO SHOW THE PROJECTION!..NO TIME!
#@!$@#%...HIT DEAD NUTS ORDER WAS IN ..NO FILL YET!!!!
quote:
Originally posted by koolblue
#@!$@#%...HIT DEAD NUTS ORDER WAS IN ..NO FILL YET!!!!
Don't worry I think we'll see 67.25 again.
kool, that bidask(100) indicator on your chart any good? What is it?
quote:
Originally posted by BruceM
hey Blue, can IB make vwap bands now or are those bollinger on you chart...? I haven't messed with it lately...thanks
Bruce
Yes the chart is from IB.
The red bars are volume bars by price. I didn't realize they had it.
Your references to volume areas twigged me to look.
the bands are ETB
which I think stands for envelope trading bands.
I wanted something that didn't increase in distance (width) with volatility as Bollinger and, to a lessor extend, Keltner do.
Emini Day Trading /
Daily Notes /
Forecast /
Economic Events /
Search /
Terms and Conditions /
Disclaimer /
Books /
Online Books /
Site Map /
Contact /
Privacy Policy /
Links /
About /
Day Trading Forum /
Investment Calculators /
Pivot Point Calculator /
Market Profile Generator /
Fibonacci Calculator /
Mailing List /
Advertise Here /
Articles /
Financial Terms /
Brokers /
Software /
Holidays /
Stock Split Calendar /
Mortgage Calculator /
Donate
Copyright © 2004-2023, MyPivots. All rights reserved.
Copyright © 2004-2023, MyPivots. All rights reserved.