ES S/R Map for 11-6-09
Btw Kool, interesting chart you posted on this page: http://www.mypivots.com/forum/topic.asp?TOPIC_ID=5075&whichpage=3
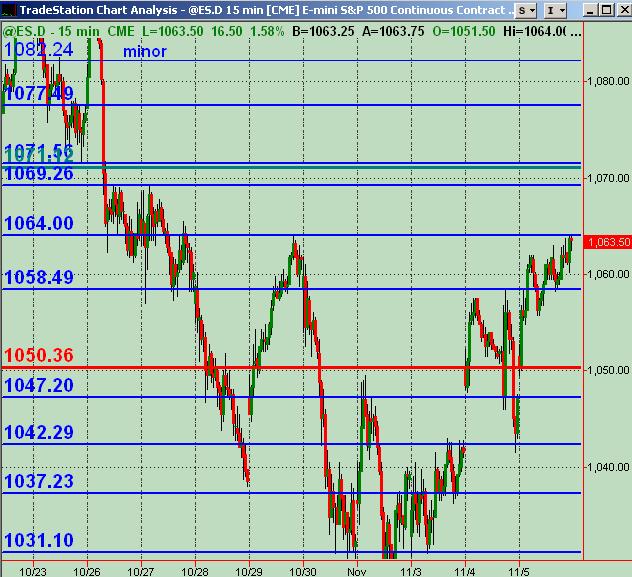
Here's what I've got for potential significant S/R price areas for Friday using a 15 minute chart. Blue=price action S/R ... Red line is Wkly Mid-Pvt ... Green(ish) line is Wkly R1 Pvt. Pleas offer any and all feedback and analysis and charts etc. !
Jobless report will be premkt ... so may be some interesting gyrations to watch.
Click image for original size
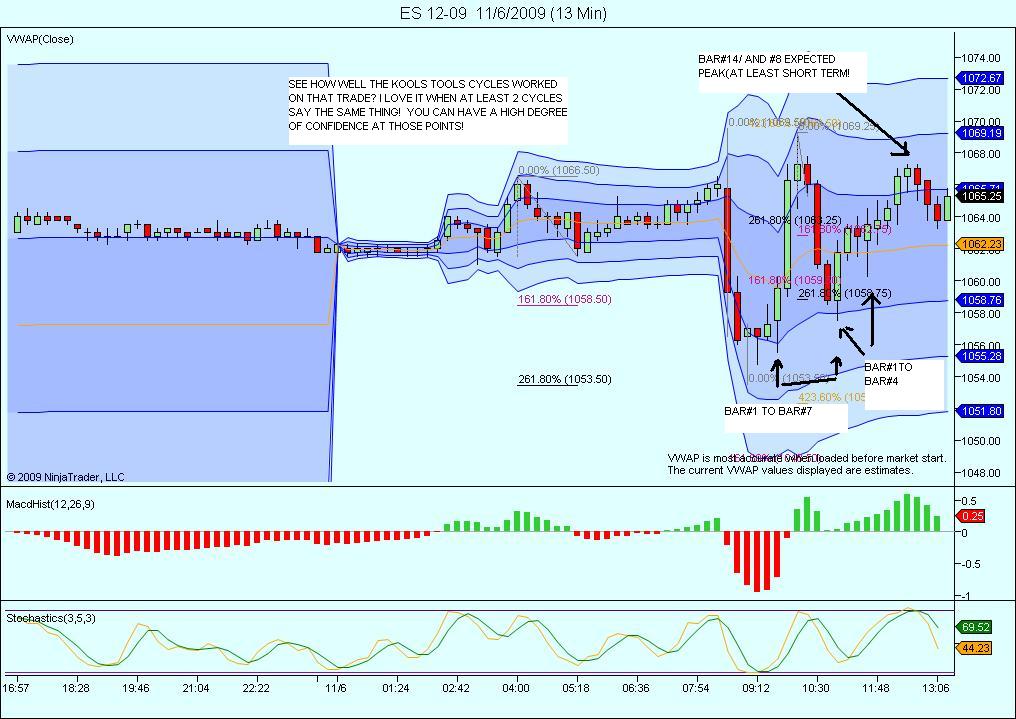
but notice also it really doesnt lead a move .once in a while ,but usually just when a rise or decline occurs . like i say its of limited use ..(i think my 3 ema's are much better!) but it looks so pretty i keep it on my chart!lol
I'm sitting in "I don't know" land right now. The break above 64 didn't push on to test near the high around 69 (only got to 67.25) and has pulled back to 64 and trying to break beneath on slow trading for now ... both actions signal some weakness to me ... though still range trading in slow-motion. Will watch for now.
see?it came right down to the avgs and bouces off of them. P.T EMINI AND VOWATER AND I HAVE A SAYING ..NEVER THE FIRST TIME...AND ITS GENERALLY TRUE!!
P.T;s 100ema is currently 1063.25 and mine (54ema)is 1063.50. the red avg is 15ema and i guarentee you the red avg will hold it up in a decent up move (decent = 5-20handles or so) ...always. when it breaks that avg the trend just ended!! same on the reverse (downtrend )of course
Kool,
Sure I know how to retrieve it, thanks in advance. On the ninja control center click tools > edit ninja script > click indicator > find bidask > open then copy and paste here.
Sure I know how to retrieve it, thanks in advance. On the ninja control center click tools > edit ninja script > click indicator > find bidask > open then copy and paste here.
OK JOE .ILL TRY IT THIS WEEKEND! ILL LET YOU KNOW.....
Click image for original size
LAST POST ..IM HIJACKING YOUR THREAD WAY TOO MUCH!..SORRY..JUST DAM PROUD OF THAT LAST LITTLE GIMMEE SCALP!
PS:RETAIL ZOOMED UP TO JUST ABOUT ZERO NOW!...I WONDER ..1073.25-1074?...SEE YA MONDAY!..HAVE A GREAT WEEKEND!
no hour break...a real bore - a - thon......still favor short side which means they'll probably run me out at the highs..still using 62 as the magnet but your 64 is stronger so far MM......like to see this break and go for the hour lows.....I'm the monority..the 67 area has worked well today.....that's plus 10 off the open but more important we went 10 points above the previous high volume thrust from yesterday...57 - 58...I knew they'd clean that up today as they smoked me yesterday afternoon....bastards...LOL...if the 61 - 62 is todays high volume then my spanking new theory that is in test mode is pointing to either 71 - 72 or 51 -52.......we'll see...the 72 goes well with some of your folks projections...I won't be on the longs up here though
quote:
Originally posted by BruceM
hey Blue, can IB make vwap bands now or are those bollinger on you chart...? I haven't messed with it lately...thanks
Bruce
Yes the chart is from IB.
The red bars are volume bars by price. I didn't realize they had it.
Your references to volume areas twigged me to look.
the bands are ETB
which I think stands for envelope trading bands.
I wanted something that didn't increase in distance (width) with volatility as Bollinger and, to a lessor extend, Keltner do.
Emini Day Trading /
Daily Notes /
Forecast /
Economic Events /
Search /
Terms and Conditions /
Disclaimer /
Books /
Online Books /
Site Map /
Contact /
Privacy Policy /
Links /
About /
Day Trading Forum /
Investment Calculators /
Pivot Point Calculator /
Market Profile Generator /
Fibonacci Calculator /
Mailing List /
Advertise Here /
Articles /
Financial Terms /
Brokers /
Software /
Holidays /
Stock Split Calendar /
Mortgage Calculator /
Donate
Copyright © 2004-2023, MyPivots. All rights reserved.
Copyright © 2004-2023, MyPivots. All rights reserved.