MyPivots
Sign In
JA
jarek
Rep: 94
Posts: 3,474
Originally posted by jarek

Maybe in the current environment we needed not just 3 drives to the top but something like 3.5?


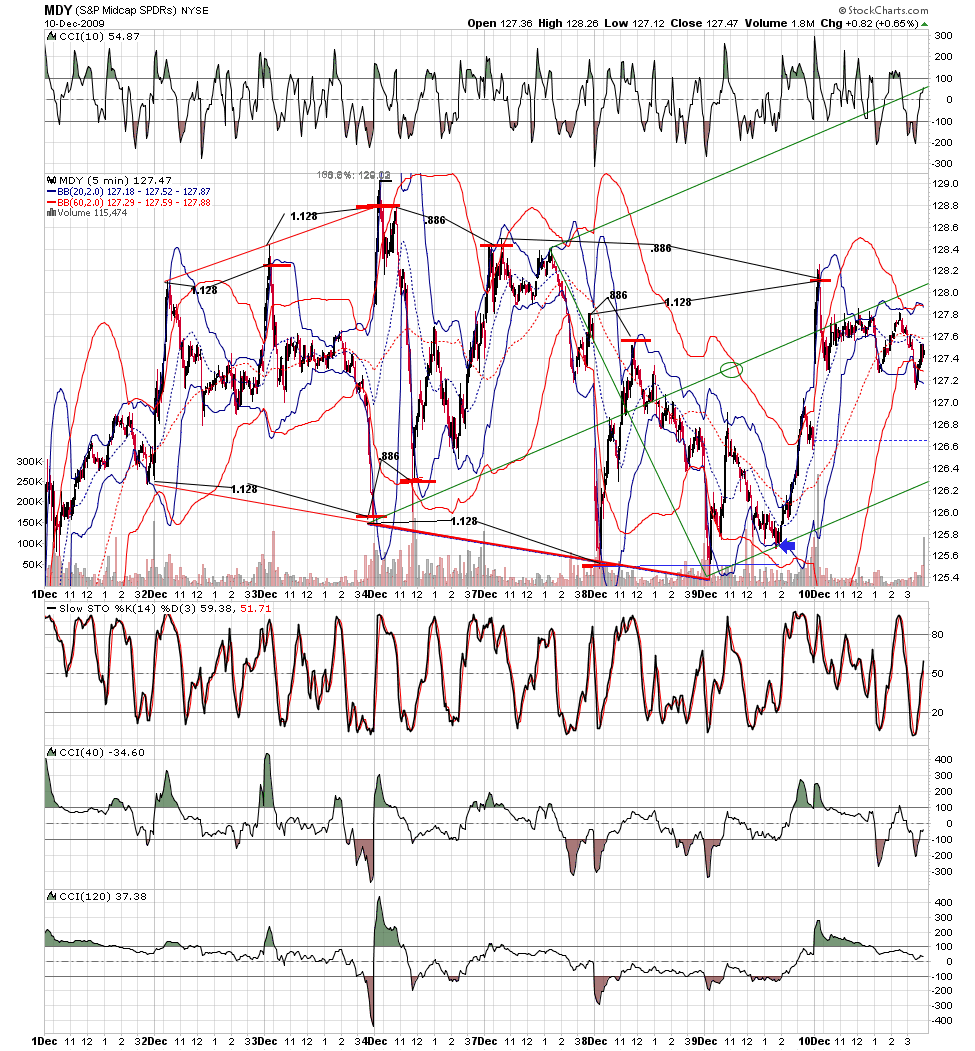
It is very interesting to note that the push to the last top in ES was equal to exactly 61% of the average length of the previous 3 drives:

Click image for original size
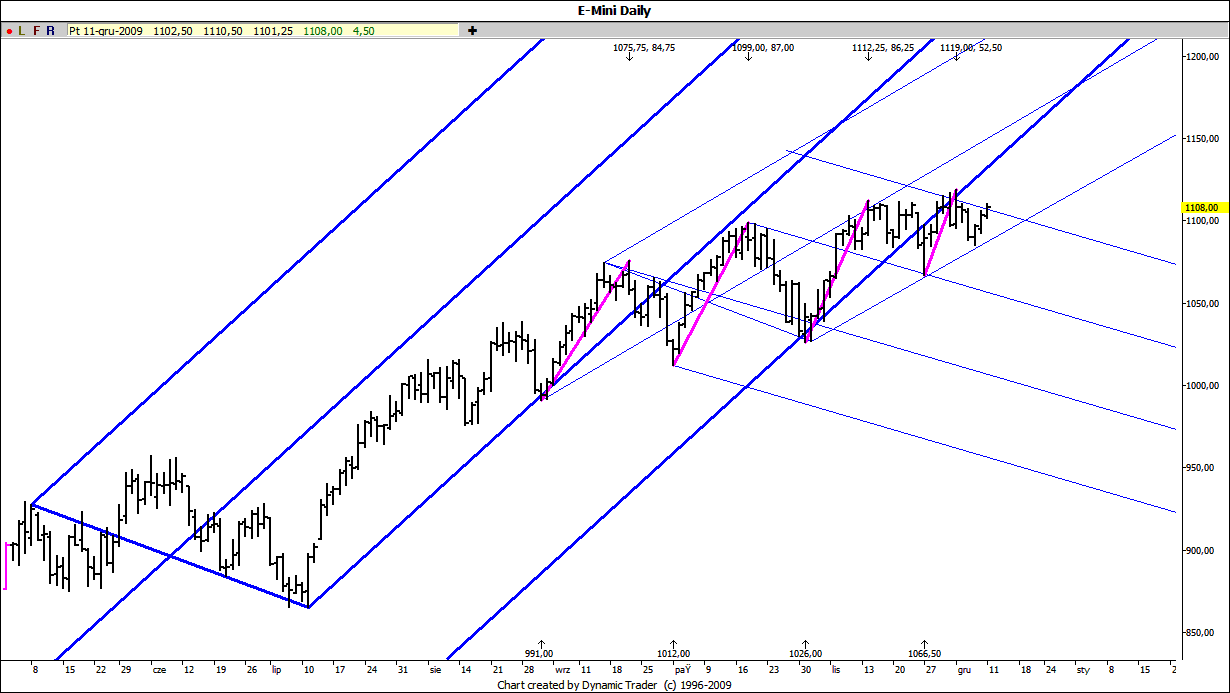

Is somebody playing games or the manipulation adjustments should also be calculated using the Fibonacci sequence? :-)
JA
jarek
Rep: 94
Posts: 3,474
And there is no doubt that recently a lot was happening under the cover of the night.

On Monday July 13th ES opened at 875 and last Friday it closed at 1108 for a net move of 233 points. I decided to check what percentage of this move was done during regular trading hours. For each trading day I calculated the daily RTH net move by taking ES price at 4pm eastern and deducting its price at 9.30am that day. Then I added up the results and got a total net RTH move of 45 points in the 109 trading sessions between July 13th and December 11th. It means that the remaining 188 points or roughly 80% of the whole move up was done outside the regular trading hours!

If this is not a proof of manipulation then what is?

It could also be very interesting to do the same exercise for the last 2 ES moves from 875 to 1108 which happened from June 1997 to March 1998 and from March 2003 to January 2004. Unfortunately I was not able to get access to intraday data for that periods.
JA
jarek
Rep: 94
Posts: 3,474
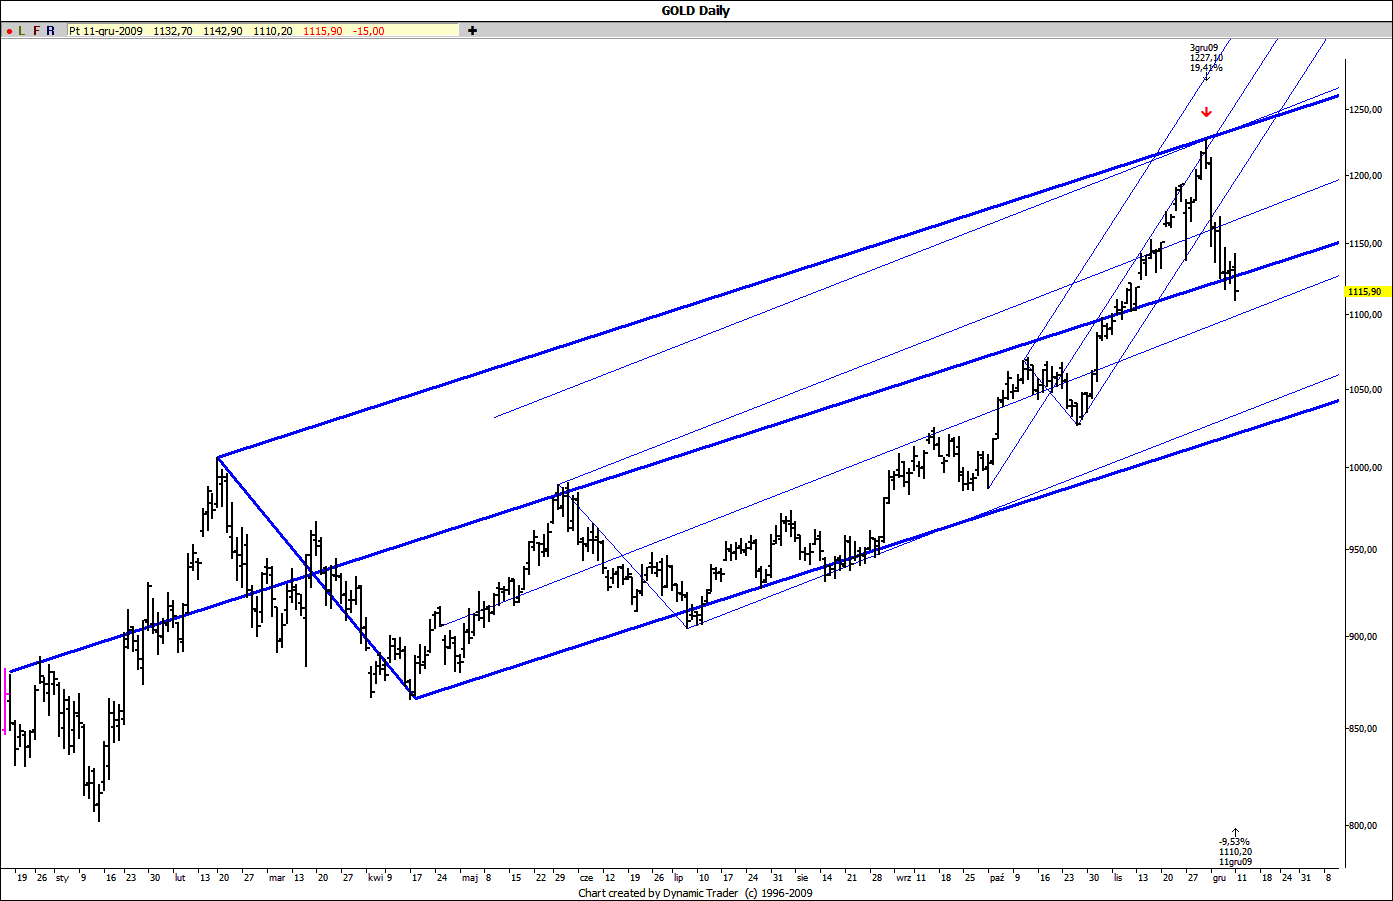
While indexes are still sitting in a no decision area, there are a lot of interesting developments in commodities. For example since its Dec 3 top Gold has its biggest drop since February and the fastest one since October 2008, suggesting something important might be brewing here:


Click image for original size
JA
jarek
Rep: 94
Posts: 3,474
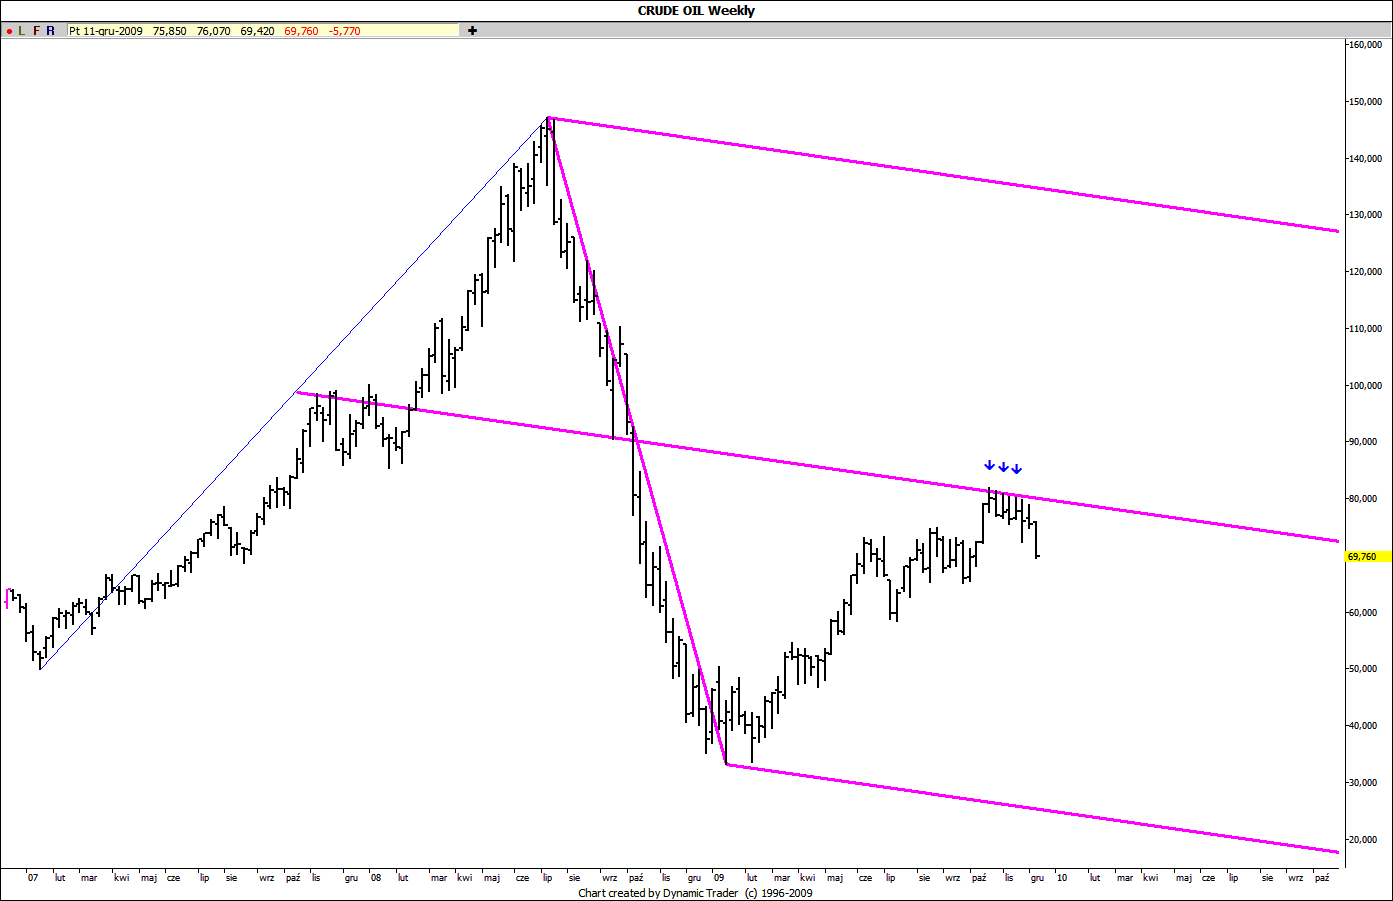
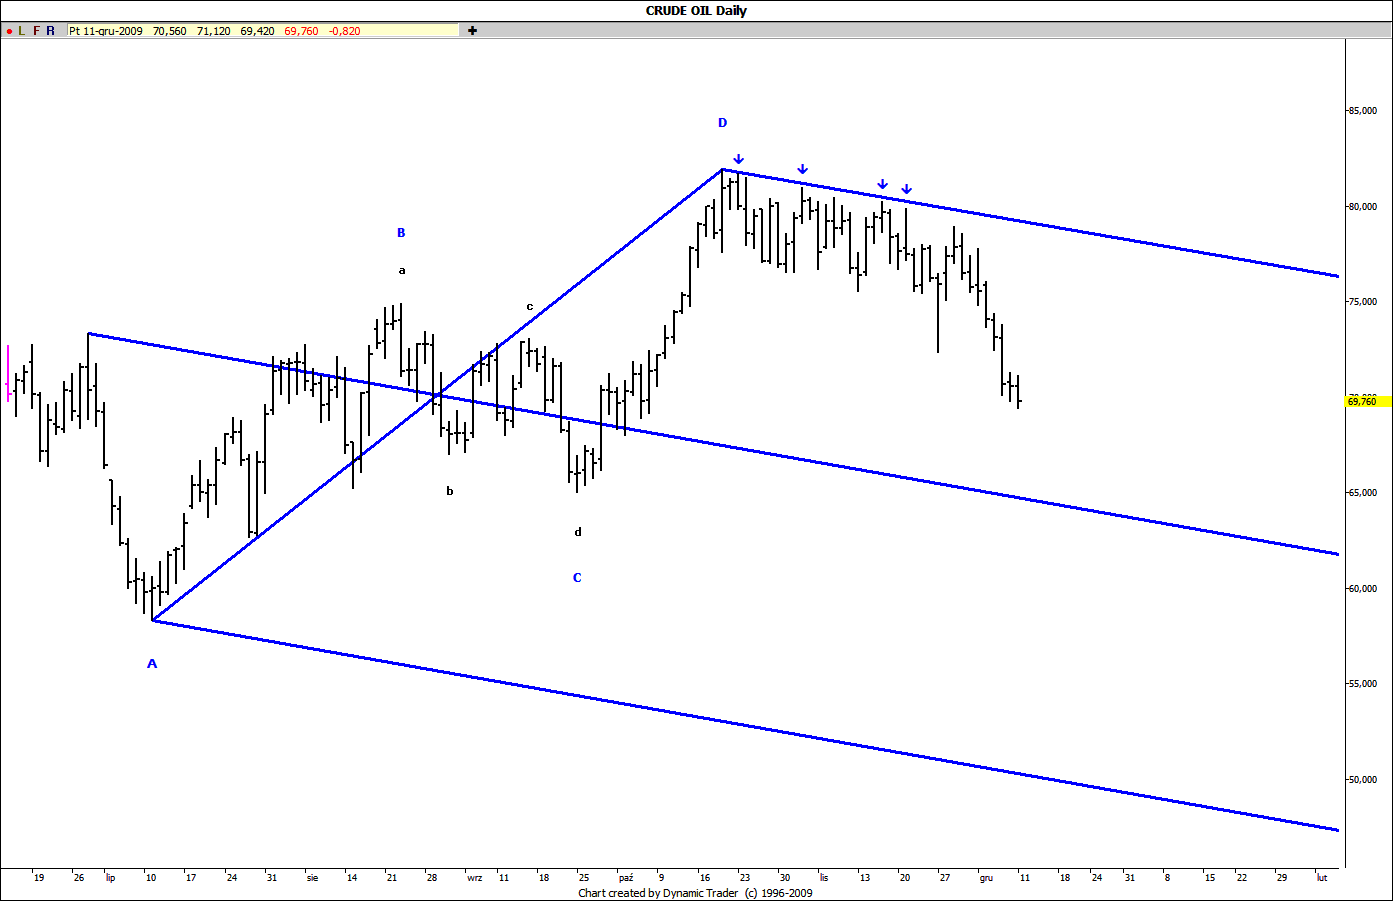
Crude started to move away from its Schiff ML resistance:

Click image for original size


And based on Geo's 93% rule there is a pretty substantial chance that move in this direction will continue:


Click image for original size
JA
jarek
Rep: 94
Posts: 3,474
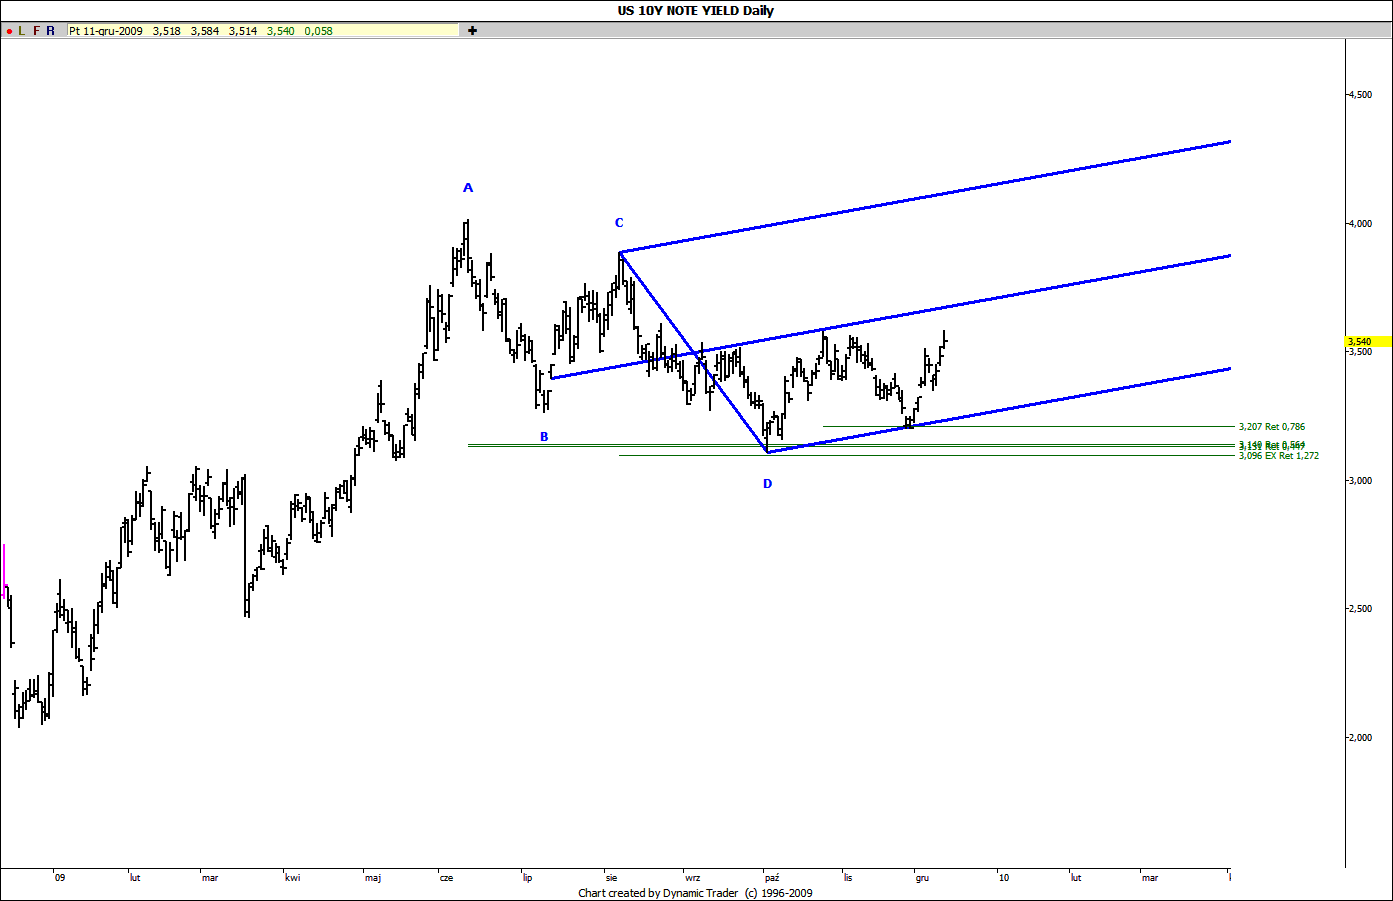
Finally for today I'd like to point out that the recent drop in 10Y notes could be a classic 78.6% Wave 2:

Click image for original size


In the grand scheme of things it fits very well to the scenario: rates up --> dollar up --> commodities down --> equities down. We can already see some move in the first three elements of this chain. Time for the forth one?
RO
roofer
Rep: 3,689
Posts: 3,574
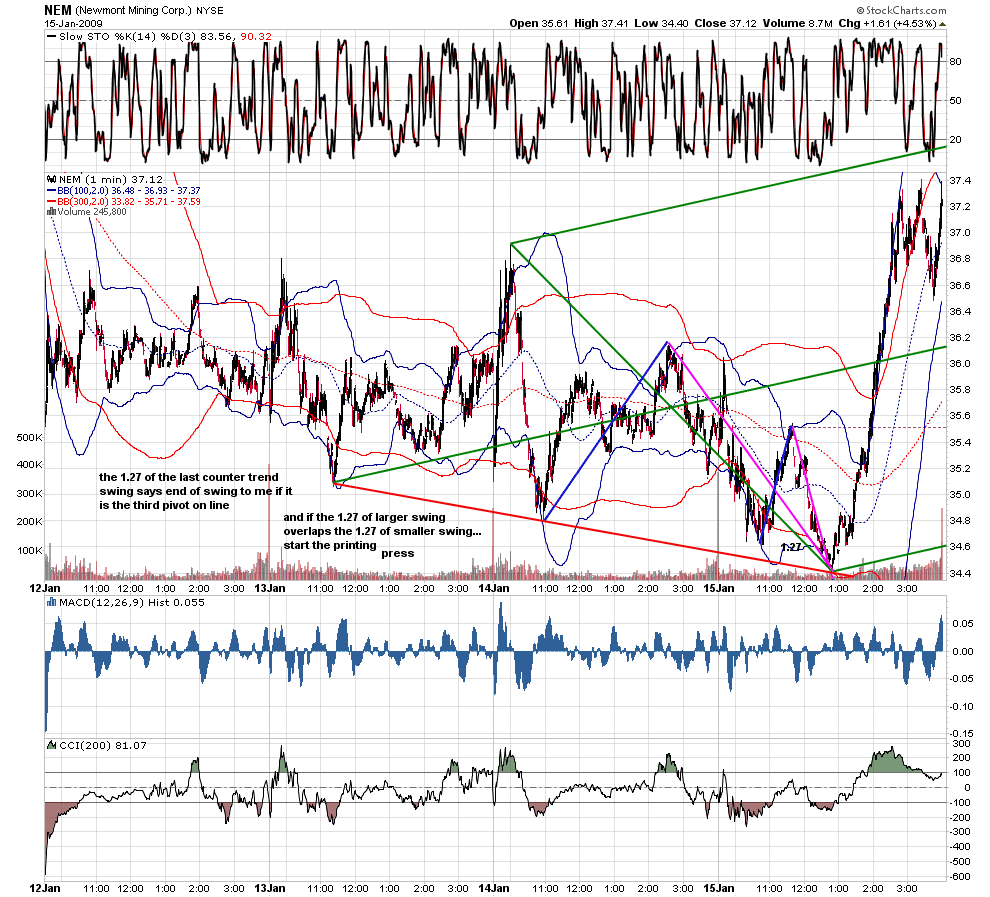
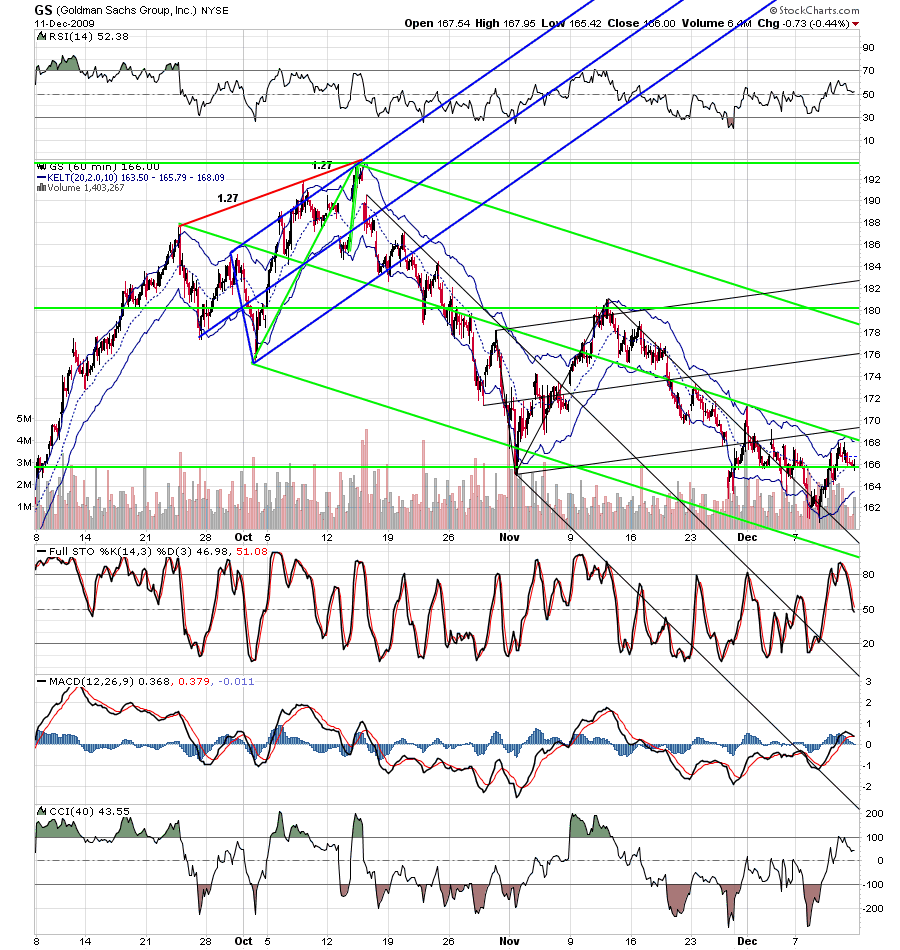
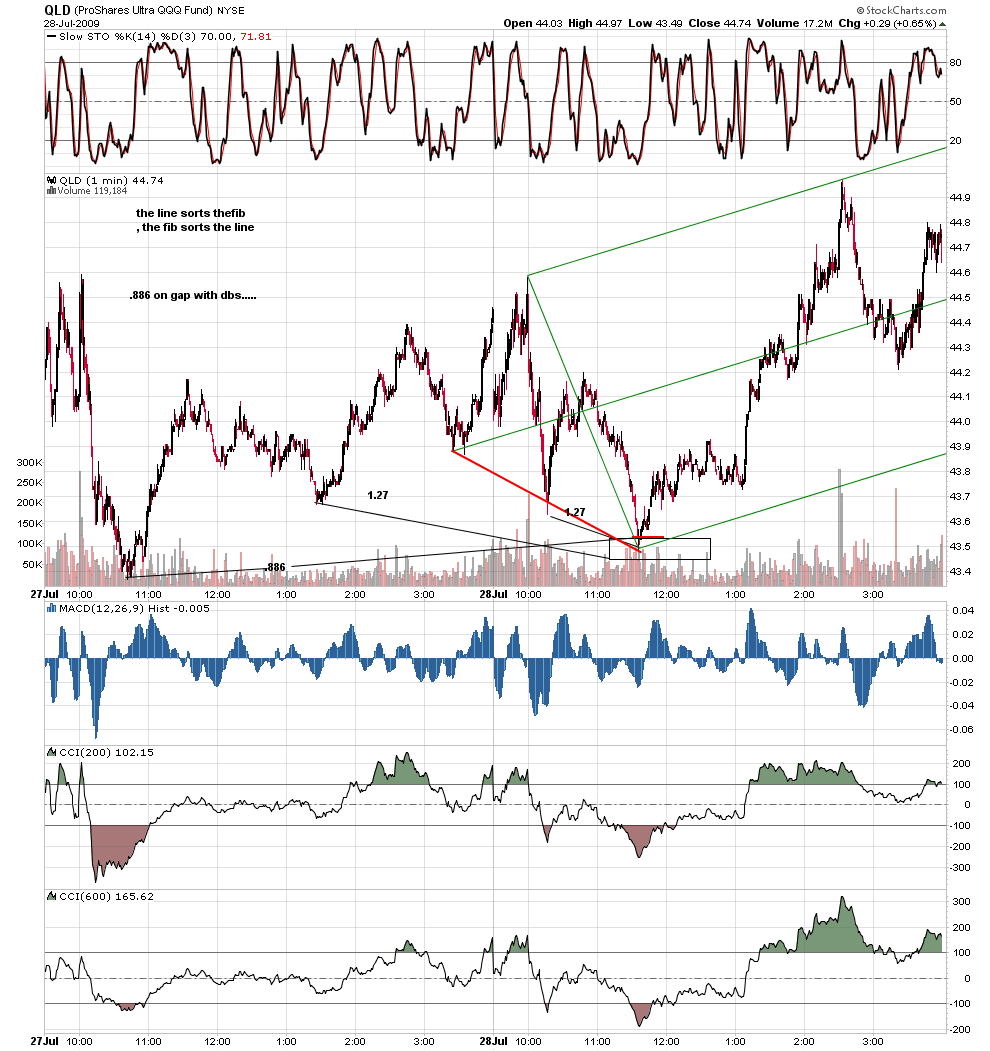
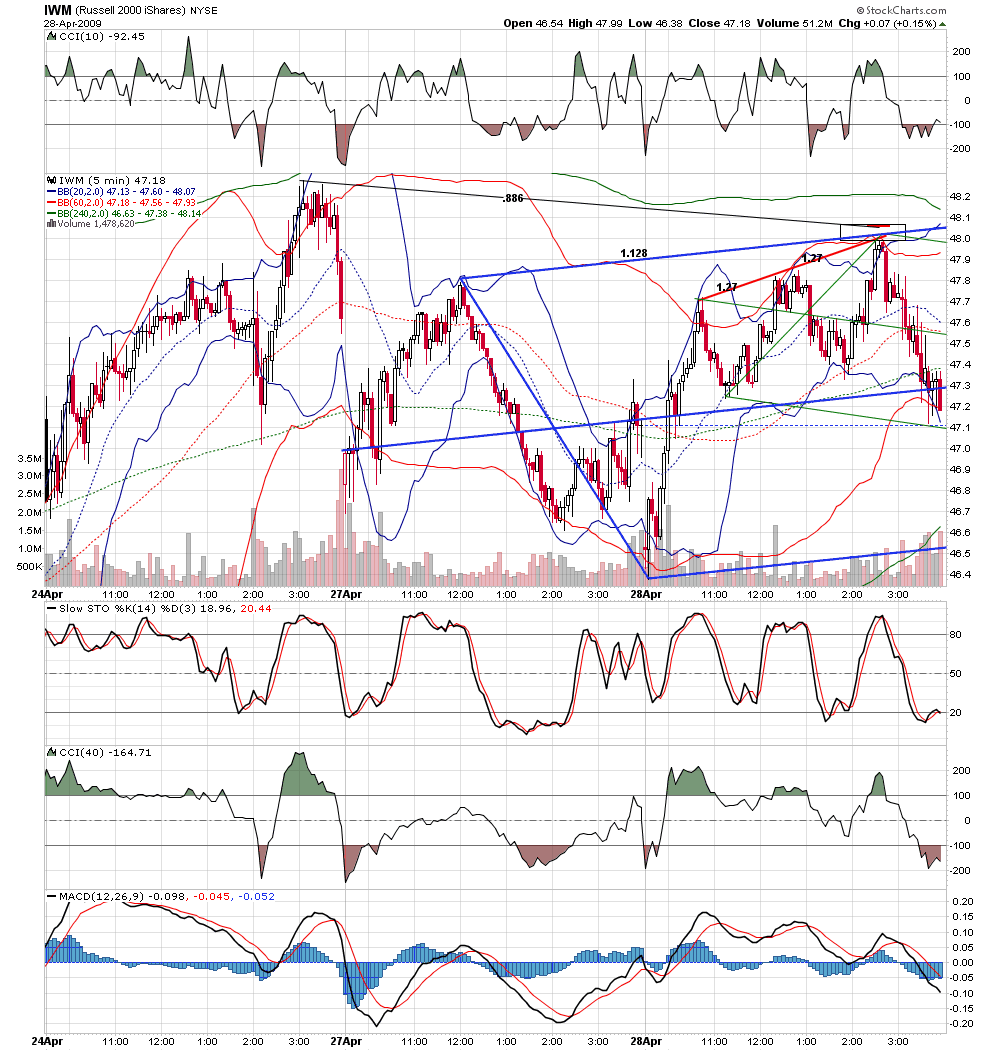
nice charts and thoughts.... a review... nothing has changed since i took the time and effort to create my ''for craft'' thread in jan( except that craft no longer posts here)charts
Click image for original size

Click image for original size

Click image for original size

Click image for original size

Click image for original size

Click image for original size
JA
jarek
Rep: 94
Posts: 3,474
Roofer - what is the way of learning how to calculate those green horizontal support/resistance levels like the ones on your GS chart above?
RO
roofer
Rep: 3,689
Posts: 3,574
jarek-they are gann levels available in any basic gann review...they rquire a different mind set....
JI
jimkane
Rep: 3,058
Posts: 33,089
Great charts, guys.

Hey, you all seeing those futures? 1113! Look at that pop on a 1-min chart! 13 points straight up! The trend is up. They want those new highs. 6 more points and it's a new 'bull market' high. They might even get that before the open. Taking into account that when the last contract rolled over it was at about 6 points lower than the previous contract, this is about at new highs right now if it wasn't for that. Regardless, this thing is strong, and wants up bad, as I suspected.
RO
roofer
Rep: 3,689
Posts: 3,574
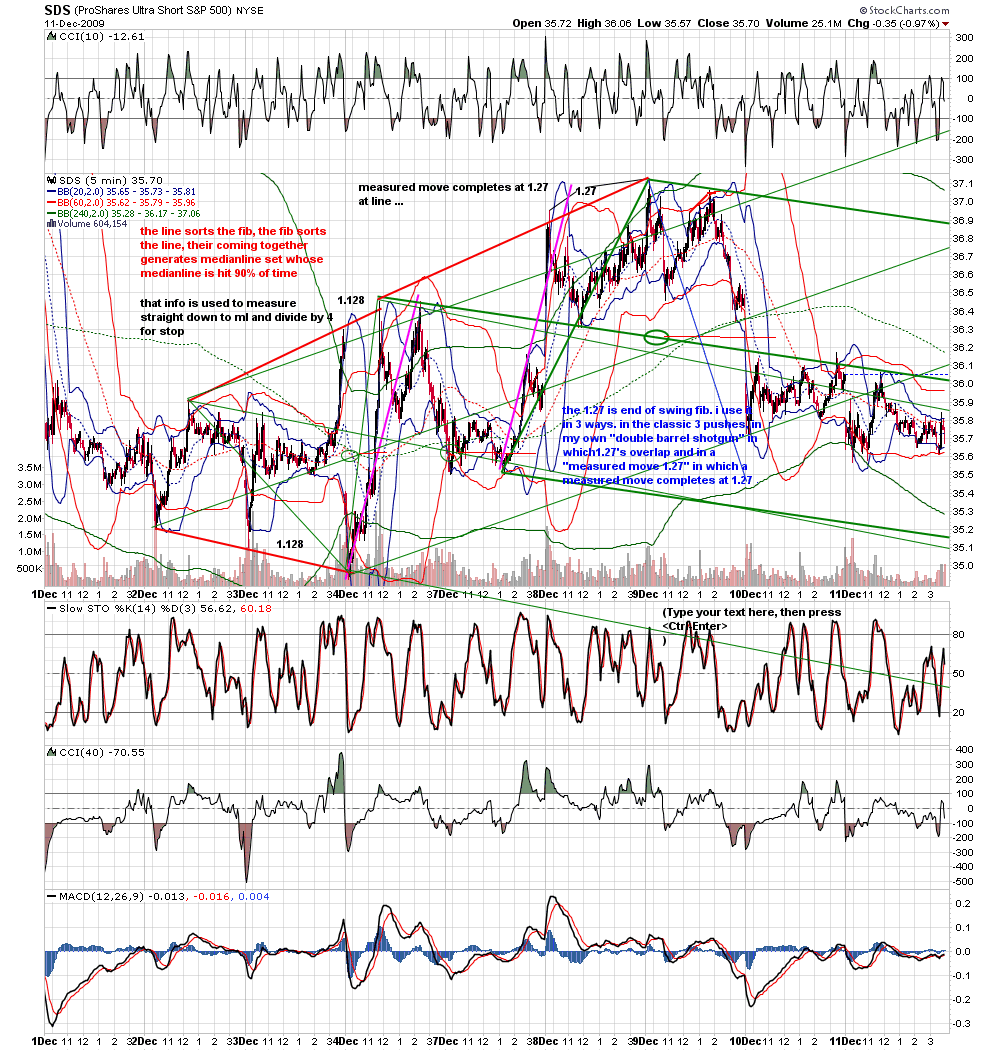
from a geometric perspective, it is in the cards....a kane abcd that completes at fib box including .382 has 87% chance of taking out high of pattern...that is setup in spy
SI
sirios
Rep: 0
Posts: 157
Jim, W1 and W2 are the most important when we expect change of trend therefore I'm still very interested in your experience with these waves. Robert Miner in his book said that end of W2 (start of W3) can be caught for trade in range 50 - 78% retracement of W1. Do you try to catch beginning W3 in all possible PTA in this range or you choose PTA with 61,8 and 78.6% retracement of W1?
RO
roofer
Rep: 3,689
Posts: 3,574
in other words... it used to be that when a bear market was coming to and end, you would see relentless block accumulation. in late 81 and all during 82 there were block after block of million shares.on large upticks... then the stock would selloff so the specialist could cover his short position..it was pure manipulation.... in a market that did not trade over 30 million share a day....but with the advent of bearish etf's,the big traders can accumulate large blocks in small bits on downticks under the radar knowing they are going to take market higher eventually by being hedged with bearish etf's.