MyPivots
Sign In
JA
jarek
Rep: 94
Posts: 3,474
Originally posted by jarek

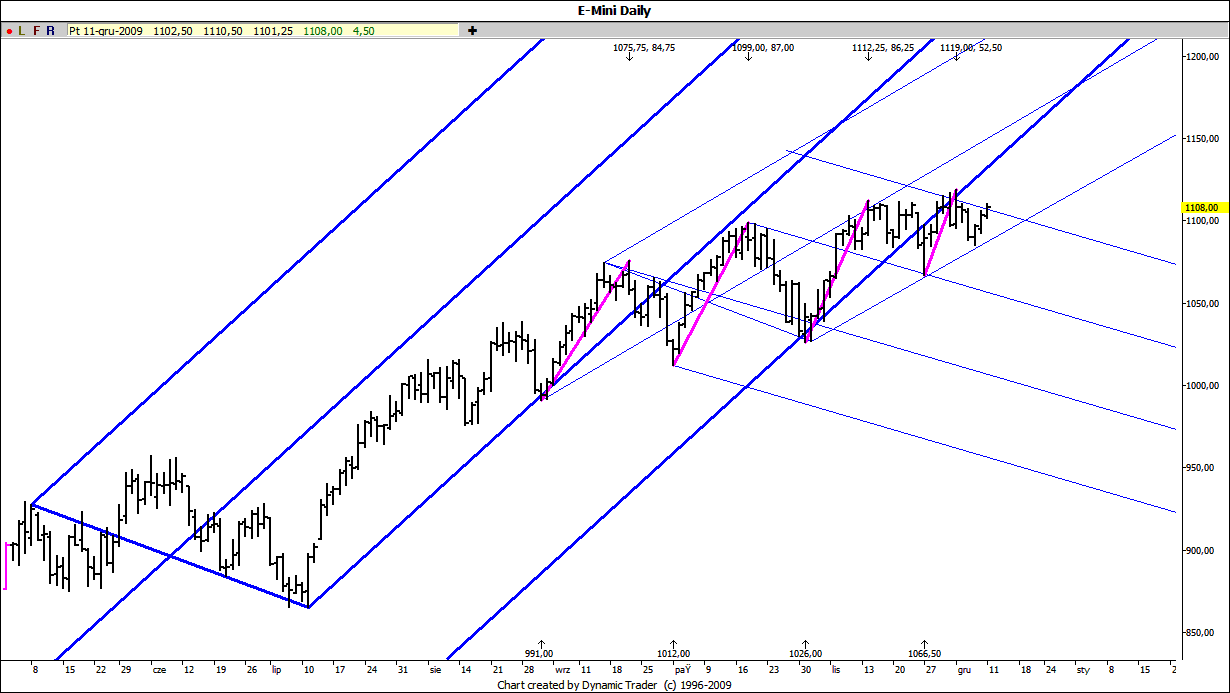
Maybe in the current environment we needed not just 3 drives to the top but something like 3.5?


It is very interesting to note that the push to the last top in ES was equal to exactly 61% of the average length of the previous 3 drives:

Click image for original size


Is somebody playing games or the manipulation adjustments should also be calculated using the Fibonacci sequence? :-)
JA
jarek
Rep: 94
Posts: 3,474
Now it finally starts looking impulsive to the downside ...
ER
EricD
Rep: 63
Posts: 692
Jim the .886 stops it again with multiple fibs and lines..only 3 points from that outside week....not so fast.
JI
jimkane
Rep: 3,058
Posts: 33,089
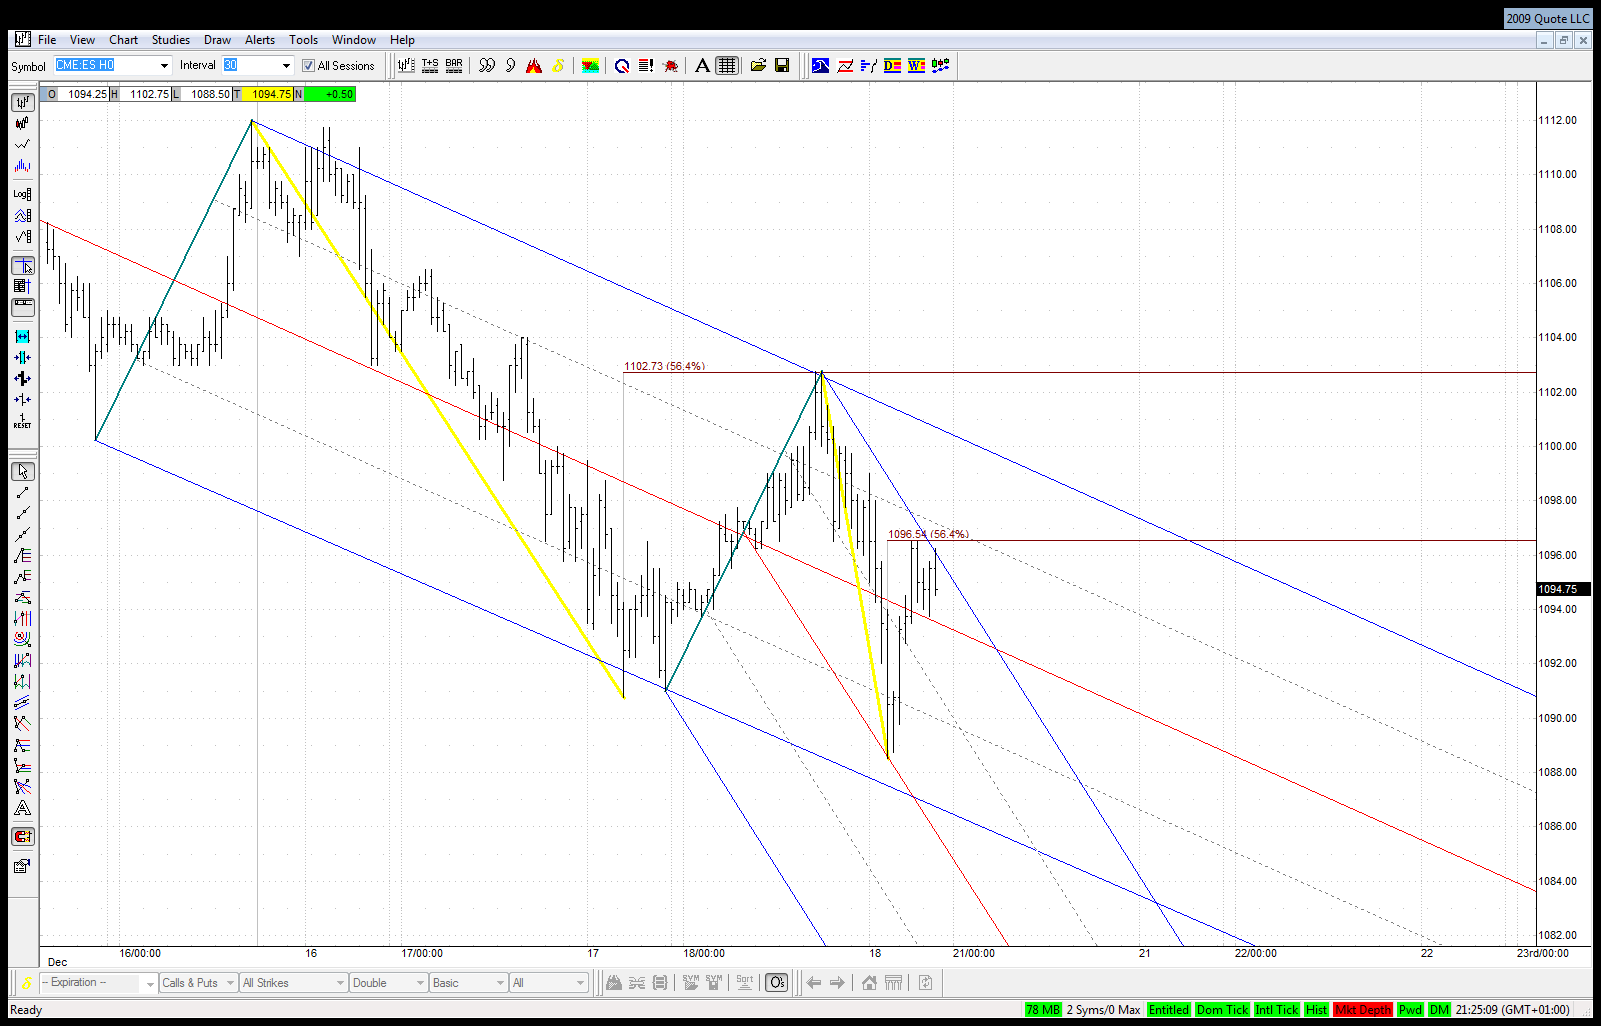
The key on this one was jarek's chart with that key set line at the .564. There were other things pointing to that exact spot. When that rolled over in GLOBEX and they didn't pick it up, it was clear they had other intentions. What will be curious is how they handle this off that lower // and 1.128/1.272 area there (too bad it didn't get exactly to the line and the 1.272...), which is where the big run up so far started from. The ABCD's at 7:27 (standard), 9:45 (EXP), and 10:16 (4PT) were big clues this wanted down. Now what it does here is very critical.

If the first FED move pattern fails, and this lower support range gives way, that could indeed be the sea change. I'd love it, but I'm so wary in here, it's just so obvious, and the Euro is just so 'oversold'... Sorry, I just can't see them not running this up into year end from this 'support' level. As I said, intermediate term I'm short-side bias, and on the GLOBEX roll I gave up the short-term long-side bias (I got that back on the bounce off today's LOD), so I'd prefer they crush this to dust, but I keep repeating myself, I'm wary of that...
JA
jarek
Rep: 94
Posts: 3,474
Looks like 56.4% is the number for today. Another corrective move, this time of one lower degree might have just ended at this retracement to the tick:


Click image for original size
JA
jarek
Rep: 94
Posts: 3,474
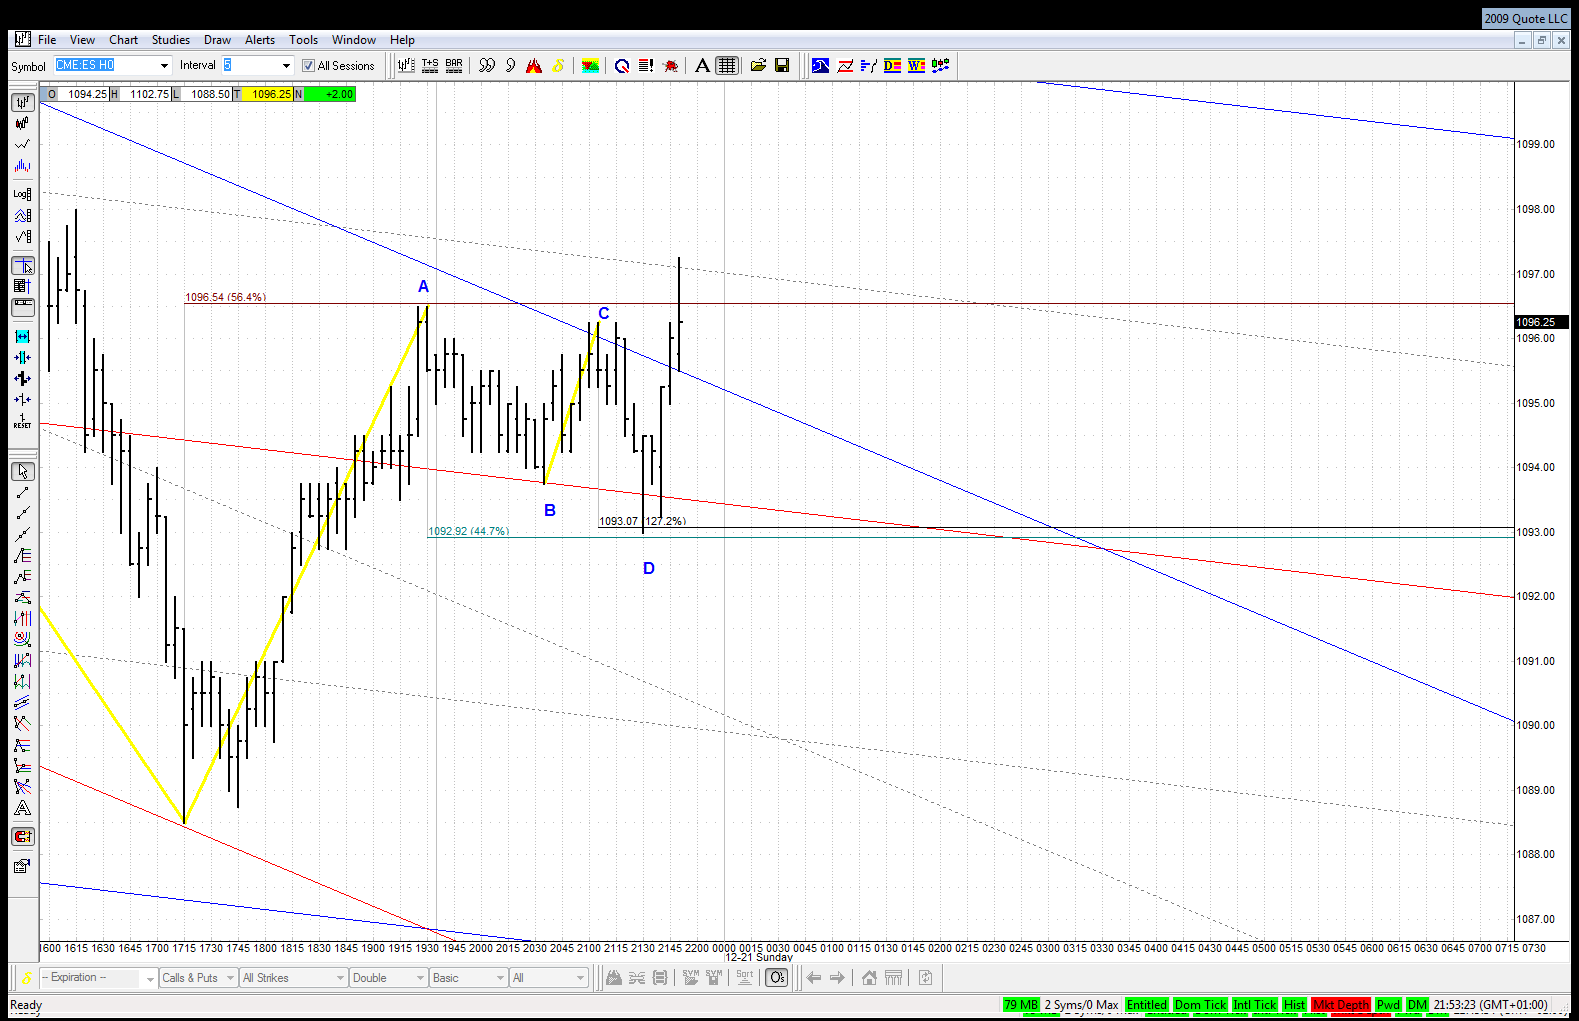
The retracement without a Kane pattern is not worth much: a move from it was immediately stopped by nice DT ABCD:


Click image for original size
JI
jimkane
Rep: 3,058
Posts: 33,089
And a key set line right there. That was the setup I was waiting for. And it is just exploding into the close. Six points straight up off that little pattern. To where? The upper // and 1.618 ret, HOD, .447 off the 16th HOD, as well as some other things. What a sweet play.
JA
jarek
Rep: 94
Posts: 3,474
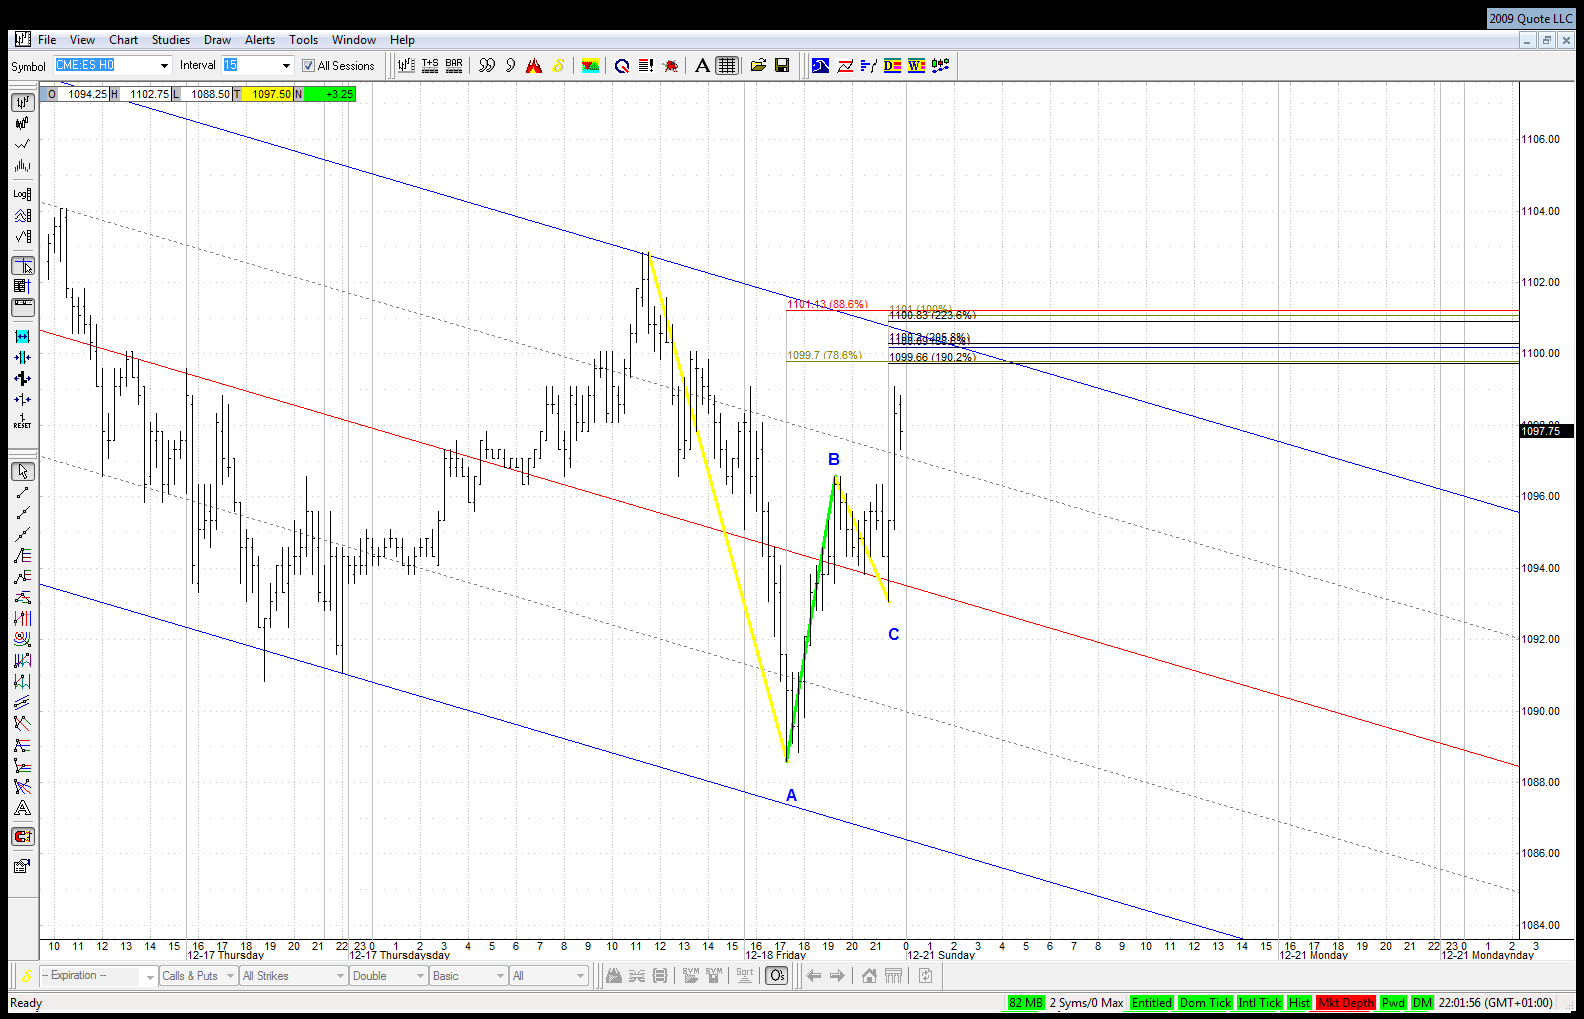
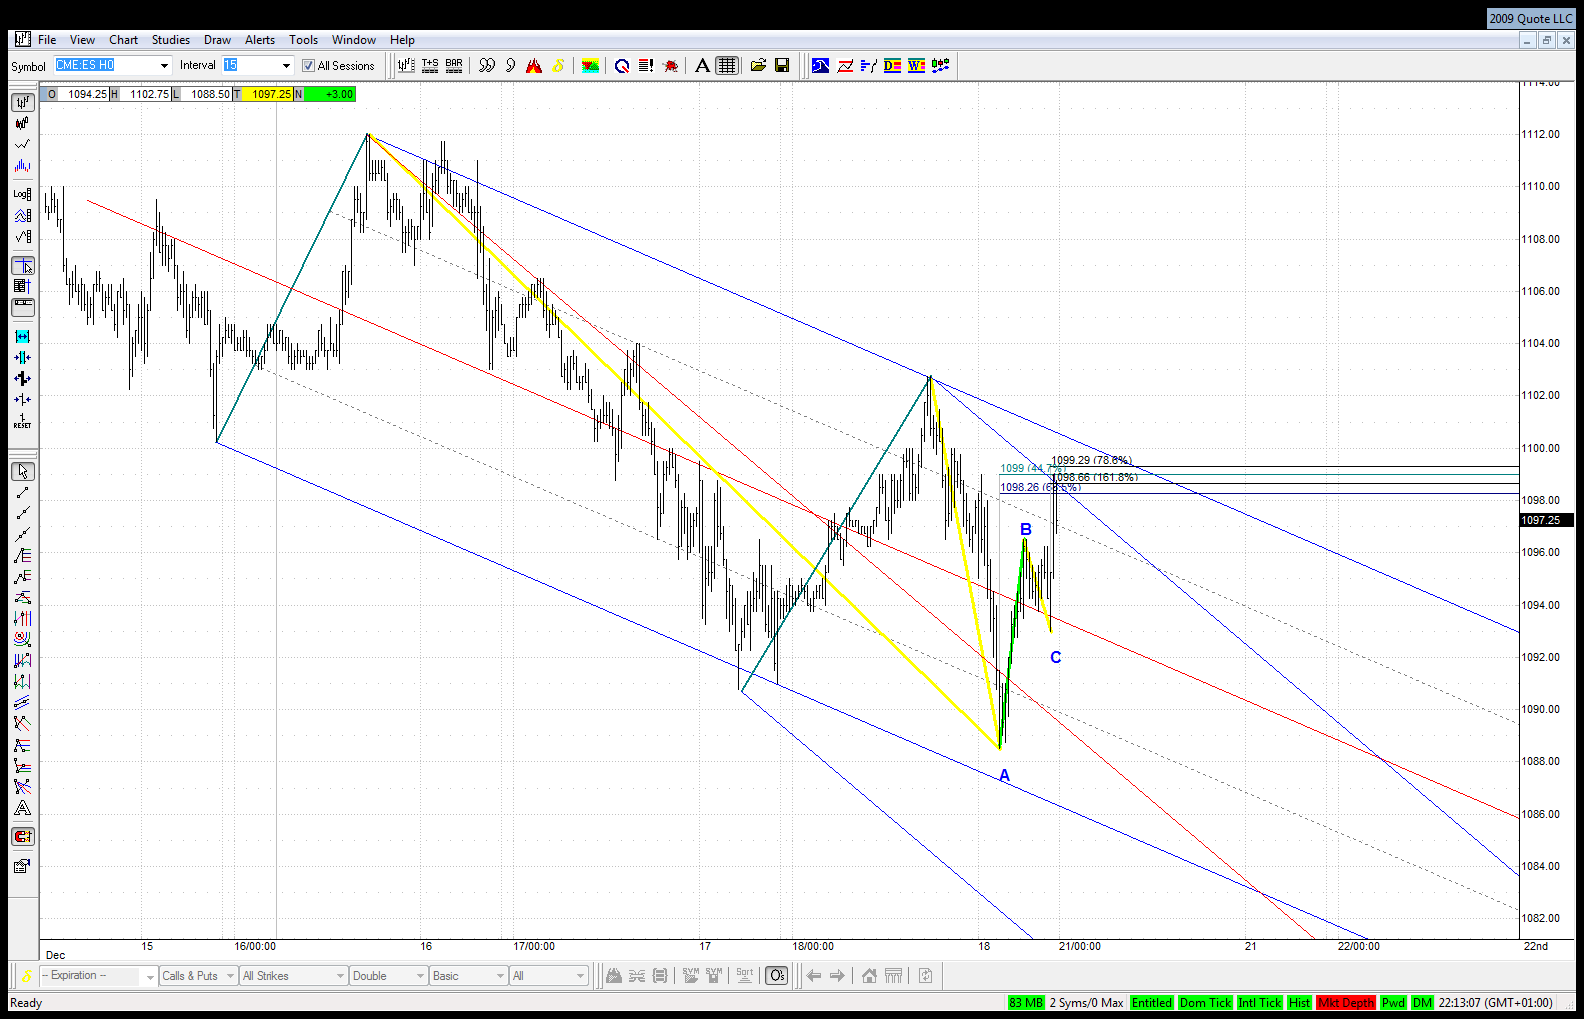
Jim - could that DT ABCD be in your opinion a BC leg of a bigger ABCD off today's bottom?

Click image for original size
JI
jimkane
Rep: 3,058
Posts: 33,089
jarek, the issue I have with that is the C point being so shallow, in the .447 area. I usually don't consider those ABCD's like that.
JA
jarek
Rep: 94
Posts: 3,474
That's what I thought. On the other hand it reached exactly the upper ML of the natural set in the typical W2 retracement area...


Click image for original size
JI
jimkane
Rep: 3,058
Posts: 33,089
Originally posted by jarek

And there is no doubt that recently a lot was happening under the cover of the night.

On Monday July 13th ES opened at 875 and last Friday it closed at 1108 for a net move of 233 points. I decided to check what percentage of this move was done during regular trading hours. For each trading day I calculated the daily RTH net move by taking ES price at 4pm eastern and deducting its price at 9.30am that day. Then I added up the results and got a total net RTH move of 45 points in the 109 trading sessions between July 13th and December 11th. It means that the remaining 188 points or roughly 80% of the whole move up was done outside the regular trading hours!

If this is not a proof of manipulation then what is?

It could also be very interesting to do the same exercise for the last 2 ES moves from 875 to 1108 which happened from June 1997 to March 1998 and from March 2003 to January 2004. Unfortunately I was not able to get access to intraday data for that periods.
And here's the support for your observation, jarek. And when I say "I know the kind of game they are playing", this is what I mean.

http://www.zerohedge.com/article/three-month-flat-market-yesif-you-exclude-constant-after-hours-manipulation
RO
roofer
Rep: 3,689
Posts: 3,574
in other words... it used to be that when a bear market was coming to and end, you would see relentless block accumulation. in late 81 and all during 82 there were block after block of million shares.on large upticks... then the stock would selloff so the specialist could cover his short position..it was pure manipulation.... in a market that did not trade over 30 million share a day....but with the advent of bearish etf's,the big traders can accumulate large blocks in small bits on downticks under the radar knowing they are going to take market higher eventually by being hedged with bearish etf's.