ES Short Term Trading 4/9/10
Thought I'd go ahead and launch the topic/thread for Friday's trading. I'm posting what I'm seeing with Price Action S/R levels on the Daily and also 1-Hour charts. Other price trendlines/chanels also included. Looking forward to the interaction from Thursday's trading and analysis.
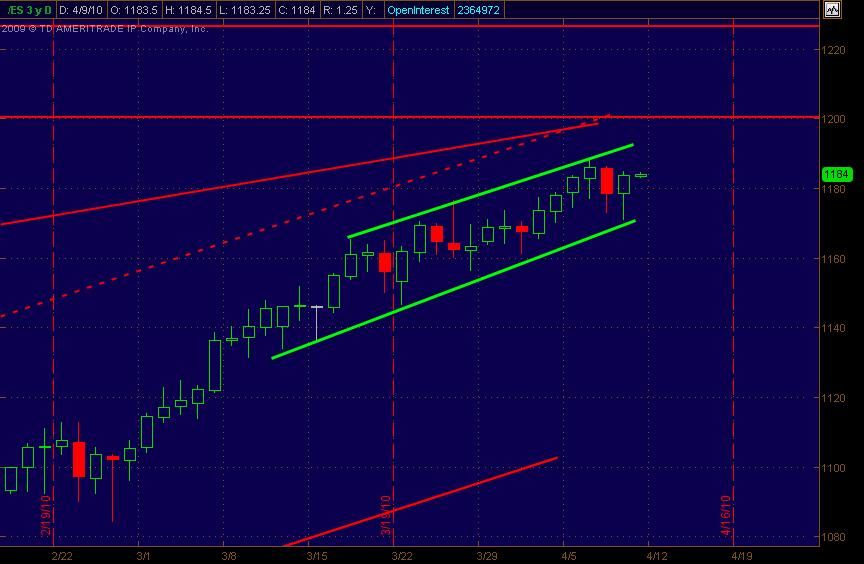
Side note: It still seems that no matter what the mkt news is, price keeps rallying (hard and fast), especially when looking at a 30 or 60 min chart on the ES. It's almost cyclical when just eyeing it. I do have 1200 as a significant upside price resistance (don't most folks!?!).
Anyway, here's the goods ... my map for what I'm looking at for trading both the ES and a "map" that aids my stock trading.
Daily ES Chart:
Click image for original size
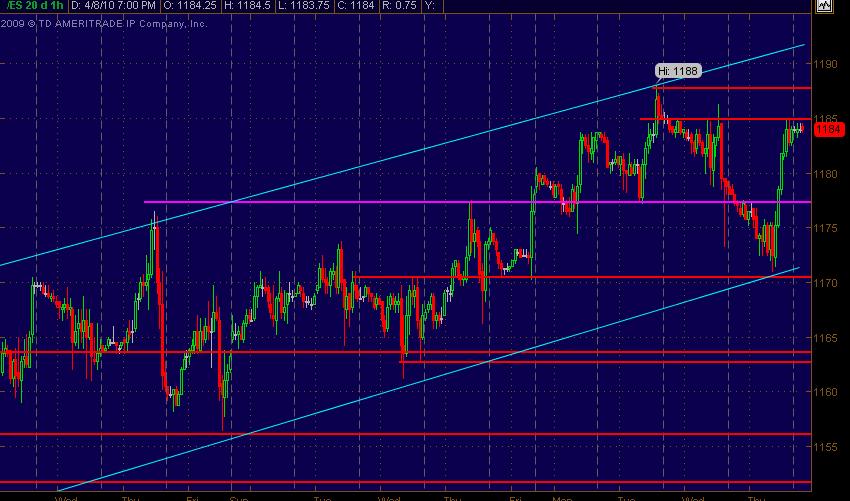
Here's the ES Hourly. The red lines are potential S/R levels with any magenta ones less significant. And 1200 is what I have next above the market that was listed on the Daily chart.
Click image for original size
Hey Red,
Looking at a 5 min chart, I'm showing a data gap from 3:55am to 4:25am central time on my Thinkorswim via TD Ameritrade. Evidently some kind of glitch it seems.
Looking at a 5 min chart, I'm showing a data gap from 3:55am to 4:25am central time on my Thinkorswim via TD Ameritrade. Evidently some kind of glitch it seems.
NO gap here (zenfire)
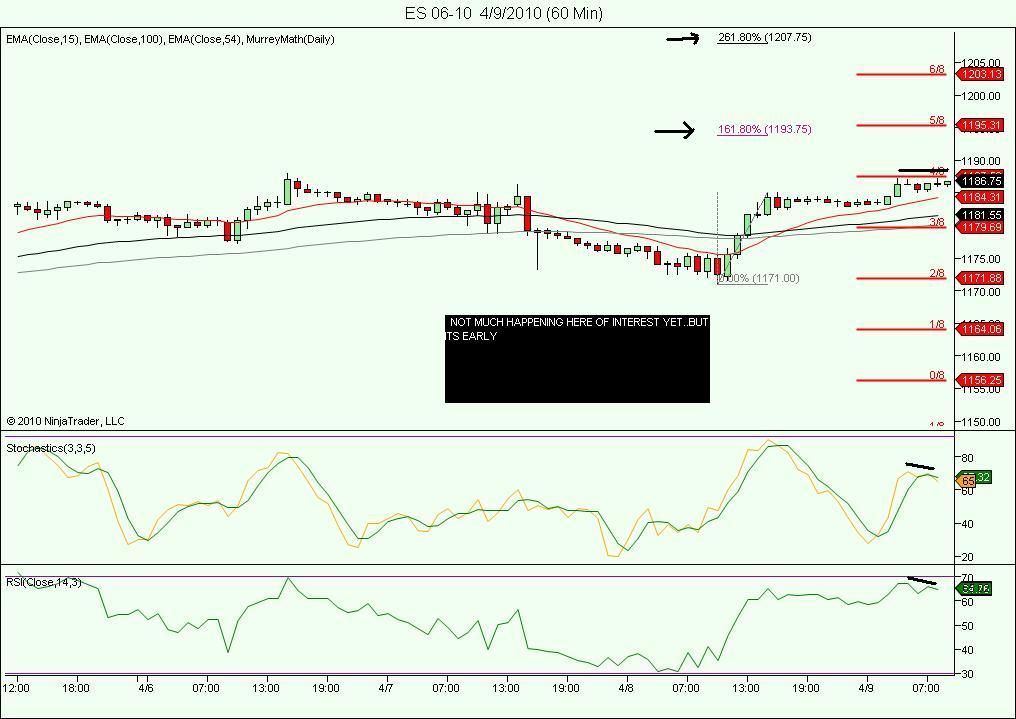
Ok, here we go! Good day yestesrday (for my analysis, not my trading!).We had the 19 hour low right at key price proj and never looked back! I still have my homework to do, but first blush impression is to buy dips looking for 1193.75. That number is coming up consistantly, just like on yesterdays charts 1187.25 kept appearing! In fact i already took advantage of that selling one es at 1187.00 this morning , covering at 1185.25 for a small scalp!...quick early look at the hourly chart....
Click image for original size
Click image for original size
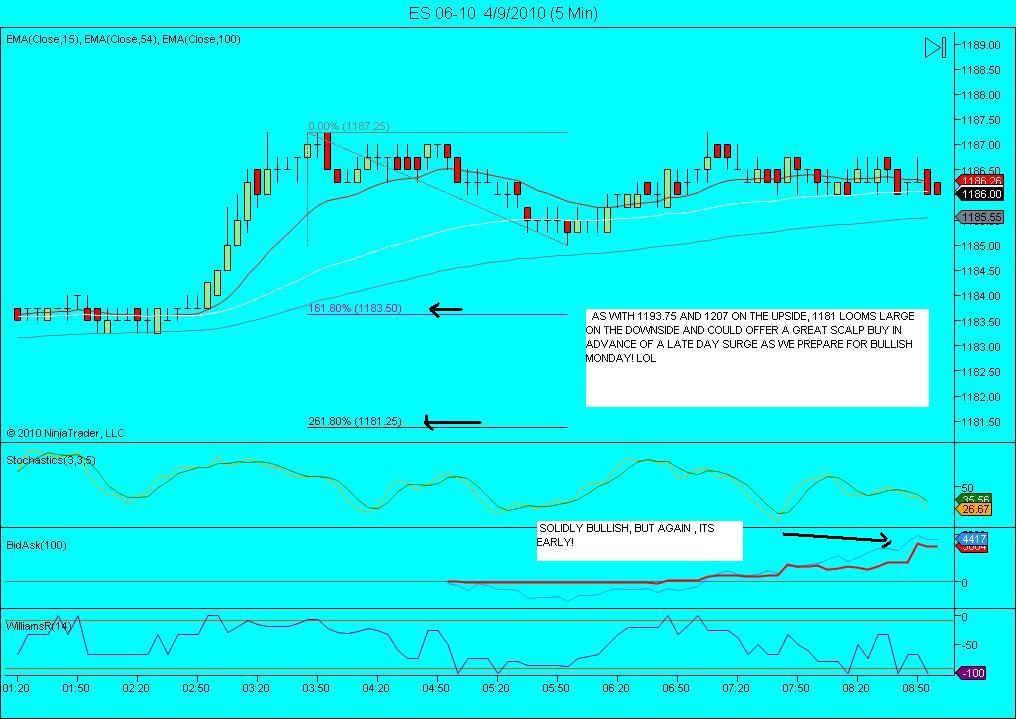
yes red trading for the 1184.25 gap from 86.25....
Originally posted by redsixspeed
Thanks Monkey;
Bruce do you see a gap in your 5 or 15 charts
around 3 am red EST..
ideal trade for me in the RTH will be the short at the Overnight high which is R1 today and obvious previous highs as already mentioned
Just wanted to add my 2 cents on this MATD pattern...
What I look for after a trend day is the market to enter a phase of "price acceptance" as the market develops a well defined value area in MP terms.
The key for me is to see the primary intraday moving averages flatten out and price to cross back and forth across the averages right off the open. Basically the market will spend several hours going nowhere. I like to see long full candle bodies on the 5 and 15 minute time frames, color is not important.
The nice thing about the MATD is the two way trading returns to the market, (as opposed to the one sided market on a trend day). This enables the scalpers to make money going both ways, fading the edges of the newly developing value area. IF you can identify where these edges are in advance, you have a significant trading edge and profit opportunity (assuming you know how to buy support and sell resistance). Also, a word of advice, avoid the mistake of initiating new trades in the middle of developing value. Be patient and stick to the edges.
Emini Day Trading /
Daily Notes /
Forecast /
Economic Events /
Search /
Terms and Conditions /
Disclaimer /
Books /
Online Books /
Site Map /
Contact /
Privacy Policy /
Links /
About /
Day Trading Forum /
Investment Calculators /
Pivot Point Calculator /
Market Profile Generator /
Fibonacci Calculator /
Mailing List /
Advertise Here /
Articles /
Financial Terms /
Brokers /
Software /
Holidays /
Stock Split Calendar /
Mortgage Calculator /
Donate
Copyright © 2004-2023, MyPivots. All rights reserved.
Copyright © 2004-2023, MyPivots. All rights reserved.