ES Short Term Trading 4/9/10
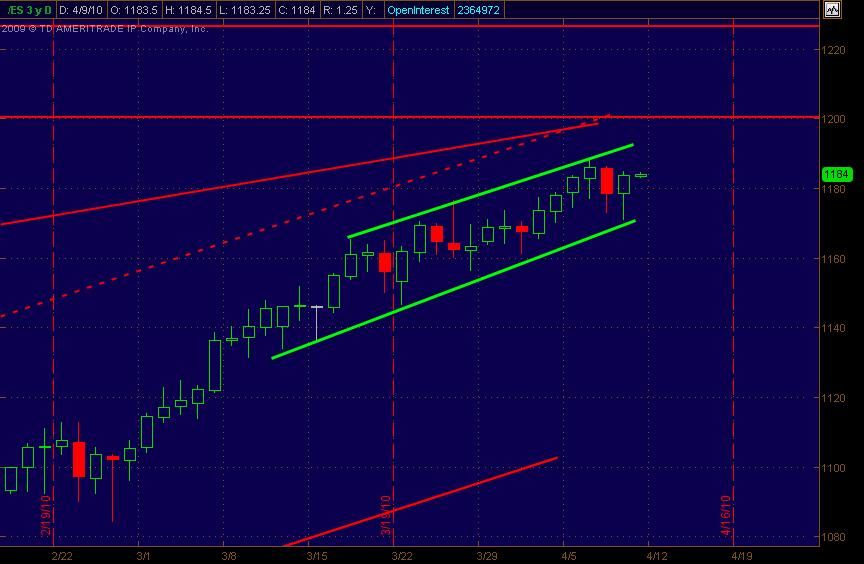
Thought I'd go ahead and launch the topic/thread for Friday's trading. I'm posting what I'm seeing with Price Action S/R levels on the Daily and also 1-Hour charts. Other price trendlines/chanels also included. Looking forward to the interaction from Thursday's trading and analysis.
Side note: It still seems that no matter what the mkt news is, price keeps rallying (hard and fast), especially when looking at a 30 or 60 min chart on the ES. It's almost cyclical when just eyeing it. I do have 1200 as a significant upside price resistance (don't most folks!?!).
Anyway, here's the goods ... my map for what I'm looking at for trading both the ES and a "map" that aids my stock trading.
Daily ES Chart:
Click image for original size
phileo,
I thought miller's favorite pattern was a trend decline with gap lower open, and then willing buyer at negative 720 $TICK.
I thought miller's favorite pattern was a trend decline with gap lower open, and then willing buyer at negative 720 $TICK.
short 86.00 ... looking for 82-80 profit tgt area ... rationale: simply an oscillating range play ... will keep a tight stop
I've heard Miller talk about the price action and back 'n forth type of range movement after a strong trend day. Listened to him refer to it on his site vids a few times. Not familiar with his trend/gap/tick trade. Is that just for a down trending day followed by a gap down and the neg tick coming early in the session? (does the converse also tend to unfold the same way, ie uptrend day / gap up / short a high TICK reading?
And are there any other prerequisite conditions or further specifics to this setup that you or anyone else is aware of ... sounds interesting?
And are there any other prerequisite conditions or further specifics to this setup that you or anyone else is aware of ... sounds interesting?
Originally posted by day trading
Originally posted by phileo
today is MATD, don Miller's favorite day.
First resistance is 1192, imo.
First support is 1182.5
Market picks a direction, and I think one of those will be tagged.
I had not hear of an MATD until now so I've just done a bit of research on it and defined it here: Morning After Trend Day (MATD). What else would you (everyone) add to that definition to improve it?
There is no standardized definition of MATD, and Don Miller is more qualified than I to answer the question, but based on the charts that I've seen the next day, the main characteristics are:
- buyers and sellers are active not too far from the close of the trend day, at least for the initial part of the session.
- because trapped longs, trapped shorts, and profit takers are driving this initially, it is unlikely they would reach consensus that would result in another trend day in the same direction (though 2008 proved to be a good exception to this).
today was a good example:
failed breakdown of gap fill (1183.75), failed breakout of o/n highs
I just reviewed some notes... my original desription was a little off.
my note,
***********************
Don's favorite set-up is described in 03/09/09 TD blog:
1) monster decline previous day
2) next day, gap down to prior day support, BUY tick under -720
***********************
pieces of this were in place yesterday, had a big decline (relatively speaking), gapped lower at open, regestered under negative 720 $Tick at price of near 73-72, at 9:37am
don't quote me exactly, but if you go to his blog and research post for TD (Trade Day) 3/9/9 might find better description.
Originally posted by PAUL9
phileo,
I thought miller's favorite pattern was a trend decline with gap lower open, and then willing buyer at negative 720 $TICK.
Yeah, that's another one of his favourites, the wholesale entry.
He obviously has more than one favourite pattern.....
Originally posted by PAUL9
I just reviewed some notes... my original desription was a little off.
my note,
***********************
Don's favorite set-up is described in 03/09/09 TD blog:
1) monster decline previous day
2) next day, gap down to prior day support, BUY tick under -720
***********************
pieces of this were in place yesterday, had a big decline (relatively speaking), gapped lower at open, regestered under negative 720 $Tick at price of near 73-72, at 9:37am
don't quote me exactly, but if you go to his blog and research post for TD (Trade Day) 3/9/9 might find better description.
Keep in mind the context and market structure here....
I see that setup work, but I think it's because we're in an established uptrend. Not sure if we'll see the same success in an established downtrend (ie. a few weeks of lower highs and lower lows)
Thanks for that Paul and Phileo. Outta short - scratch. Mkt had no down juice kicking in. (Initial PT's were actually 84 then 82 ... chart misread ... was in effect looking for 2point profit risking 1point ... not that it matters now )
For your perusal: (i dont necessarily agree!)....
Click image for original size
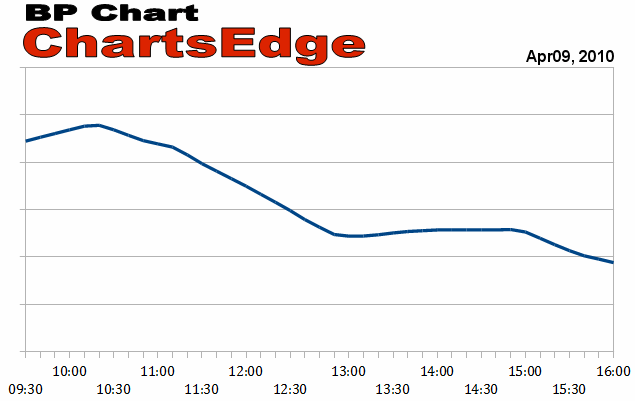
courtesy Charts Edge
Yes, just "one" of his favorites.
I went to the blog and found it. Apparently, on that TD, he did not take it (chastized himself for not taking it in the blog)
I just assumed it WAS his favorite.
I went to the blog and found it. Apparently, on that TD, he did not take it (chastized himself for not taking it in the blog)
I just assumed it WAS his favorite.
Just wanted to add my 2 cents on this MATD pattern...
What I look for after a trend day is the market to enter a phase of "price acceptance" as the market develops a well defined value area in MP terms.
The key for me is to see the primary intraday moving averages flatten out and price to cross back and forth across the averages right off the open. Basically the market will spend several hours going nowhere. I like to see long full candle bodies on the 5 and 15 minute time frames, color is not important.
The nice thing about the MATD is the two way trading returns to the market, (as opposed to the one sided market on a trend day). This enables the scalpers to make money going both ways, fading the edges of the newly developing value area. IF you can identify where these edges are in advance, you have a significant trading edge and profit opportunity (assuming you know how to buy support and sell resistance). Also, a word of advice, avoid the mistake of initiating new trades in the middle of developing value. Be patient and stick to the edges.
Emini Day Trading /
Daily Notes /
Forecast /
Economic Events /
Search /
Terms and Conditions /
Disclaimer /
Books /
Online Books /
Site Map /
Contact /
Privacy Policy /
Links /
About /
Day Trading Forum /
Investment Calculators /
Pivot Point Calculator /
Market Profile Generator /
Fibonacci Calculator /
Mailing List /
Advertise Here /
Articles /
Financial Terms /
Brokers /
Software /
Holidays /
Stock Split Calendar /
Mortgage Calculator /
Donate
Copyright © 2004-2023, MyPivots. All rights reserved.
Copyright © 2004-2023, MyPivots. All rights reserved.