ES Short Term Trading 5-4-10
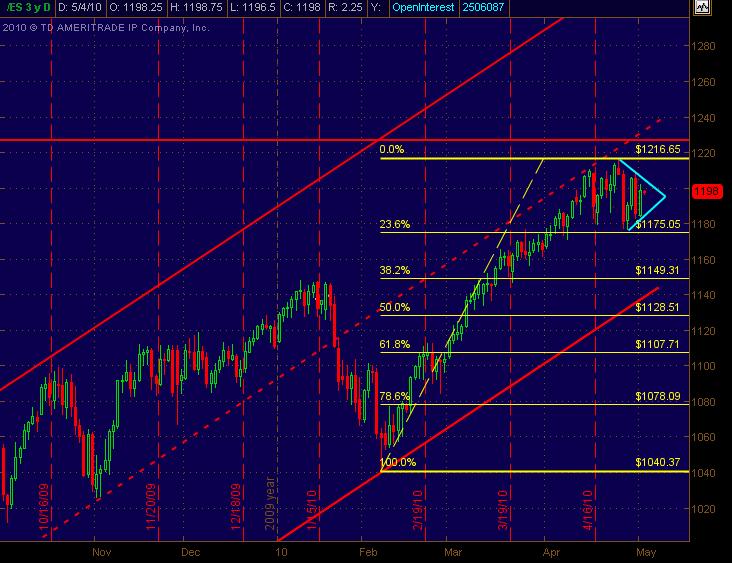
I'm still trying to get used to Thinkorswim, but here's a basic big pic overview of the Daily ES chart. Have the the trend channel and also included Fib Retracement levels though I don't typically use them much ... but nice to know where they are. And Kool and others have referenced the sideways pattern that I've thrown Cyan lines on as a pennant type formation ... even though it's not so much price swings creating it as it is the volatility increase and Wider Range trading sessions of overlapping bars. Hope this is helpful.
Click image for original size
that was the first plus 800 $tick...so if that can't start her up they will get new lows...
note how Monkeys 0.786 retrace was basically achieved (i voted it up!) . I told you it bothered me that yesterday was a turn point high which would imply down good today! Since i think most of the selling is over for the day, slightly lower to my 1174.75 projection from the 1216.50 high WAS NEVER NEGATED!(meaning its still considered 'active' untill 1216.50 is touched! note also the naz is leading (and were lagging yesterday on the move up.I feel the trend may remain down generally for the next 2 days. the rest of today may be up-down mish-mash...Just some thoughts
I'm working from a similar idea kool...and that is that we had to travel 20 points this morningto break last weeks lows.....so who is left to sell once it breaks that low......hopefully nobody is left and we go higher...
Originally posted by koolblue
What we have to keep in mind is this .. even if your real bearish (as i suddenly am) you have to notice that the daily range is already at 22.75 handles, the recent avg is about 20-21. the highest lately was 25.25. Therefore its logical to conclude that the selling is over ,or nearly over(within ,say about 3 handles) so ill be looking to continue buy scalps even tho my bull-bear bias has changed!
Yeah,Bruce, its logical that most or all of the selling is over.. at least for a while!....
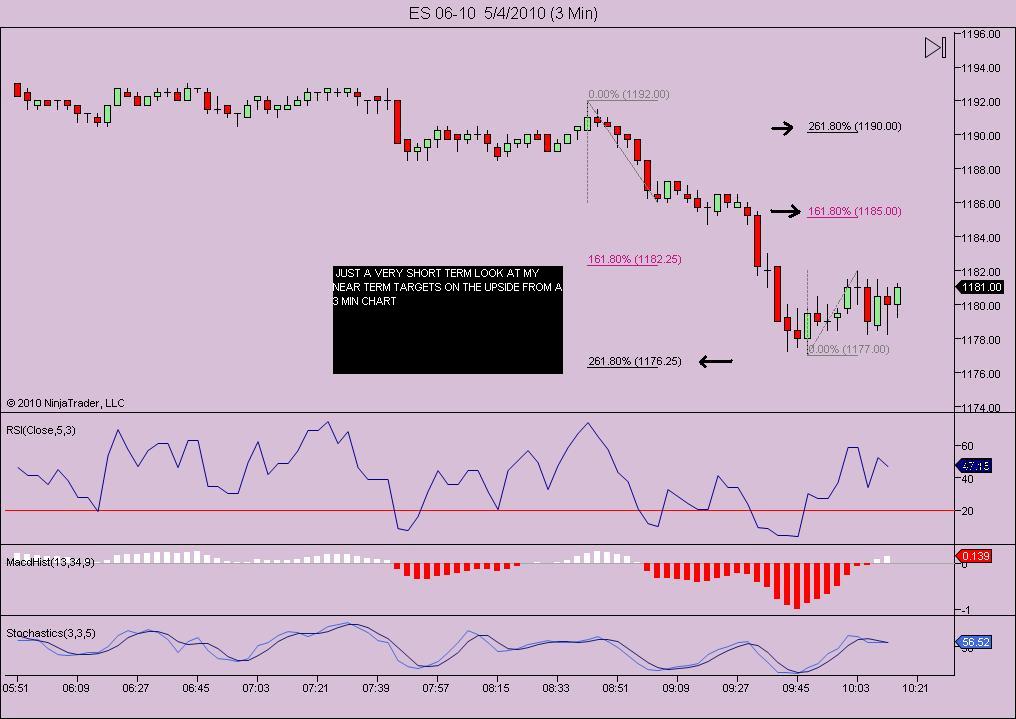
Click image for original size
trying to buy 79 even! Got hit but no fill!
little one mi cycle peaking now
Was watching that avg. range y'all mentioned just eyeballing the size of the daily bars and price seems to have perhaps stabilized here around 81 ... had expected a quicker reversal back up, a bigger bounce at least like a reactionary rubber band effect ... I'm out at 80 ... call it "time in trade" risk ... cut the losses and am watching for now ... that low at 77 needs to hold or things could get nasty
Originally posted by BruceM
I'm working from a similar idea kool...and that is that we had to travel 20 points this morningto break last weeks lows.....so who is left to sell once it breaks that low......hopefully nobody is left and we go higher...Originally posted by koolblue
What we have to keep in mind is this .. even if your real bearish (as i suddenly am) you have to notice that the daily range is already at 22.75 handles, the recent avg is about 20-21. the highest lately was 25.25. Therefore its logical to conclude that the selling is over ,or nearly over(within ,say about 3 handles) so ill be looking to continue buy scalps even tho my bull-bear bias has changed!
Man that 1179 buy would have paid off nicely.. Woulda , coulda, shoulda.. i say that a lot...sigh
NQ and YM are both sagging (no real bounce) and toying with their respective session lows still
Originally posted by PAUL9
ES might not have printed new LOD, but NQ has.
Bruce I find him to be the most thoughtful, accurate and flexable analyst I have ever seen. His Sat audio updates are complete and concise. He has been calling for March 20 high to be followed by a short correction leading to an Aug 20 high which you better get out of the way. This call is over 6 mos old. New Lows, maybe and lasting for a major cycle.
Emini Day Trading /
Daily Notes /
Forecast /
Economic Events /
Search /
Terms and Conditions /
Disclaimer /
Books /
Online Books /
Site Map /
Contact /
Privacy Policy /
Links /
About /
Day Trading Forum /
Investment Calculators /
Pivot Point Calculator /
Market Profile Generator /
Fibonacci Calculator /
Mailing List /
Advertise Here /
Articles /
Financial Terms /
Brokers /
Software /
Holidays /
Stock Split Calendar /
Mortgage Calculator /
Donate
Copyright © 2004-2023, MyPivots. All rights reserved.
Copyright © 2004-2023, MyPivots. All rights reserved.