ES Short Term Trading 5-4-10
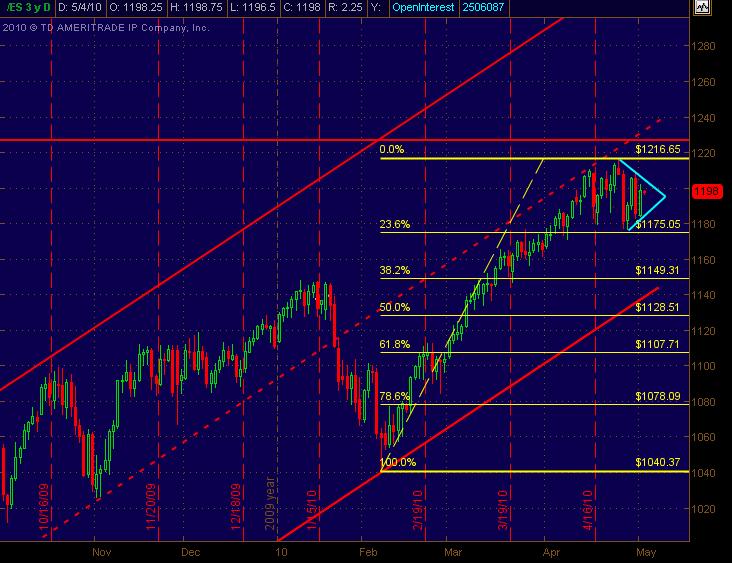
I'm still trying to get used to Thinkorswim, but here's a basic big pic overview of the Daily ES chart. Have the the trend channel and also included Fib Retracement levels though I don't typically use them much ... but nice to know where they are. And Kool and others have referenced the sideways pattern that I've thrown Cyan lines on as a pennant type formation ... even though it's not so much price swings creating it as it is the volatility increase and Wider Range trading sessions of overlapping bars. Hope this is helpful.
Click image for original size
ok that's enough for 71.50 now lets pop up into 76...damn it...lol...
Click image for original size
Paul just an FYI as I know you research ideas on your own and don't take anything at face value...as it should be....
For me I dial down to the one minute and the volume histogram to get a better visual on the "True" air....so if no price overlaps on the one minute and the histogram has no volume then that becomes critical....the 5 minute is fine too but can miss some area just like the 30 minute and single prints can
volume becoming numb now....so we need to stay tight
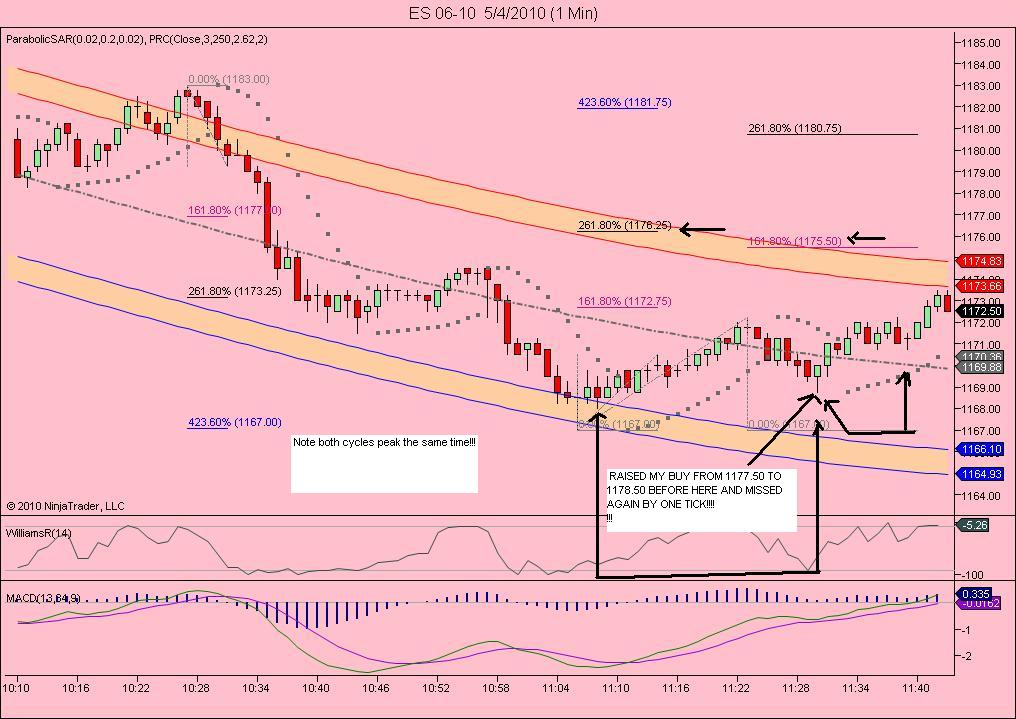
last try today for me ...im trying a long at the 1.618 one min proj down at 1169.50.. also the median line on the on min regression chart is there.. if this trade tanks im at my daily limit and done for the day. looking for 1175-6 minimum
I like the excess on the lows withthat one minute bar but obviously we need some signs of true buyers...$ticks still showing sellers in control but I'd like to see the failure...it just doesn't seem like a real breakout from the trading range...
you'd think they'll want to at least test that breakout which gives more power to 75 - 77
you'd think they'll want to at least test that breakout which gives more power to 75 - 77
well, for better or worse im long from 1169.50 looking for an exit near 75...
market profile traders get satified at 65 area as that is twice the first 60 minute range...very interesting now this 65 - 67.50
I'm with ya kool from 65.75...the new lows and MP folks happy...I hope..after getting last runners stopped at 69.50....
stop at 65...I gotta eat
got 71.25...trying for that 75 - 77 with 2 runners left
Bruce I find him to be the most thoughtful, accurate and flexable analyst I have ever seen. His Sat audio updates are complete and concise. He has been calling for March 20 high to be followed by a short correction leading to an Aug 20 high which you better get out of the way. This call is over 6 mos old. New Lows, maybe and lasting for a major cycle.
Emini Day Trading /
Daily Notes /
Forecast /
Economic Events /
Search /
Terms and Conditions /
Disclaimer /
Books /
Online Books /
Site Map /
Contact /
Privacy Policy /
Links /
About /
Day Trading Forum /
Investment Calculators /
Pivot Point Calculator /
Market Profile Generator /
Fibonacci Calculator /
Mailing List /
Advertise Here /
Articles /
Financial Terms /
Brokers /
Software /
Holidays /
Stock Split Calendar /
Mortgage Calculator /
Donate
Copyright © 2004-2023, MyPivots. All rights reserved.
Copyright © 2004-2023, MyPivots. All rights reserved.