ES short-term trading 5-27-2010
I have never initiated a "topic" here and I don't know if there are rules, but here's a try...
wow, it's all over? I certainly appreciated all the posts by BruceM and Kool, I was even intimidated by their expertise and willingness to pull trigger after trigger.
I hope they understand that many of the people who read the sight might have felt the same as I did (intimidated and questioning the worth of my own assessment of the markets)
I'll post an intermediate term chart in the next post.
I find it virtually impossible to trade and post, but I was amazed that this wonderful forum had become fallow.(apparently)
Right now, the ES market is at a critical juncture, as the High of the week is being challenged O/N and if there is a move to new highs in the RTH, that can easily force bears to cover, especially ahead of a 3-day weekend.
My big problem... I try to juggle too many things and often end up with analysis paralysis... But let's face it, damn little volume has gone into the trend higher overnight and RTH trading might produce a counter move before a resumption of up.
prices are already up over 2% and that is often a BIG move for a day.
I looked at the overnight volume at price
1087-1087.25
1086.50 to 1085 is air
1081
Ledge with 2nd biggest volume (since yest 4:15 close) is at 1087-1087.25
Highest volume at price looks like 1081.25
Shallow zone 1086.25 to 1085 with the closest "smallest volume" at 1086.25
1081 looks like biggest ovenight volume (support de la support?) and ties into BruceM ratchets if it holds.
In alittle bit (if I' e done this right) I hope to post a chart that will show 240 minute chart with cluster of potential targets in the 1106-1109 area.
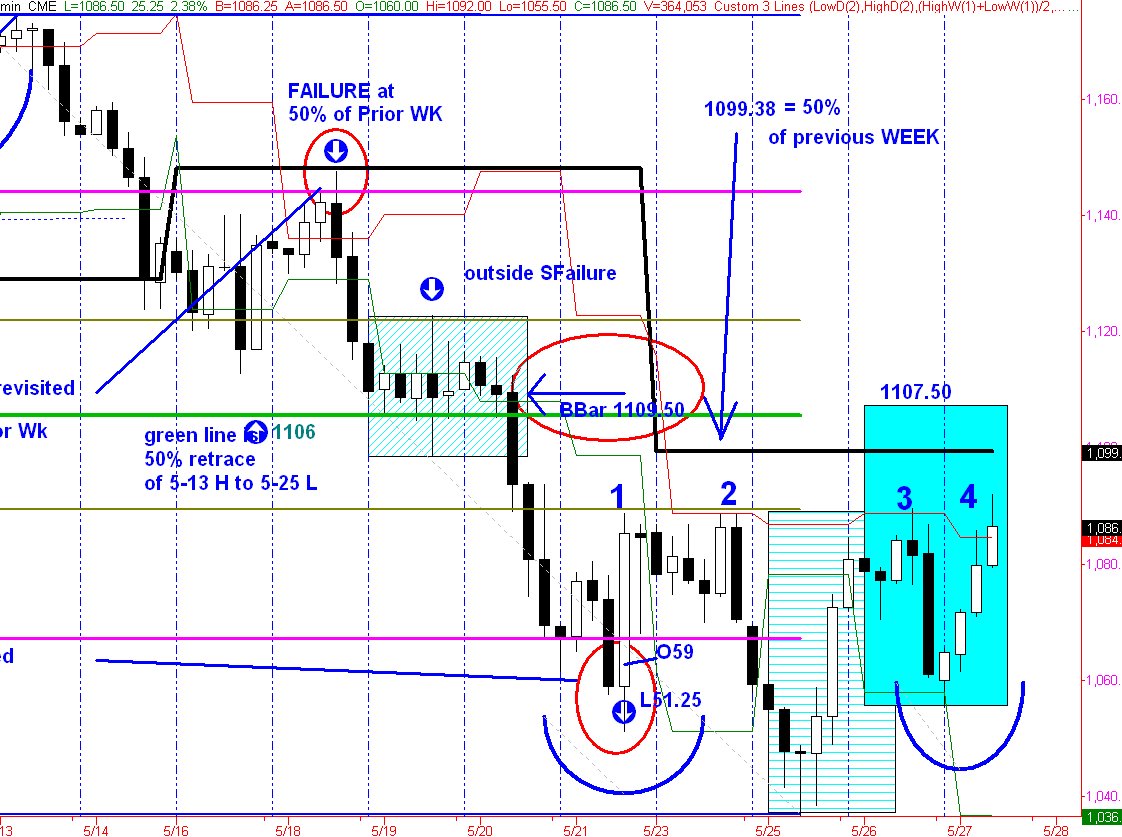
Upside target area sometime today or tomorrow is 1105-1109 area.
first of all, in uptrends and downtrends, price usually (at some time during the week) retraces to test 50% of the previous week's range. That hasn't occurred yet this week.
50% of last week's range is 1099.38 (give or take a few ticks)
Additionally, one thing I have mentioned here is Breaker Bars. A Breaker Bar is a bar that opens inside a sideways range, but then closes dramatically outside of that range.
There is a Breaker Bar in the very middle of the chart. I took the time to frame the sideways consolidation with a rectangle with thin cyan lines on the bias. WHat I have noticed is that the Open of a Breaker Bar is often revisited.
The Open of the Breaker Bar is 1109.50
Additonally,
I am a big fan of 50% retracements, and if you've ever looked at the formula for a pivot point it is just a 50% retracement of the day with a slight kicker, an adjustment for the close...
50% retracement of the 5-13 H to the 5-25 L is right near 1106
Measured Move.
The 5-25 Low up to High yesterday, that advance is at the bottom of the chart in a rectabngle filled with horizontasl lines. All I did was replicate that rectangle and re-position it using the O/N Low as the bottom of the rectangle. (Yeah, I know measured moves are "old school")
measured move comes in at 1107.50.
cluster looks like
1109.50
1107.50
1106
you might notice the numerals 1-2-3-4 in Blue at 1089 area.
Over the years I have developed mnemonic devices, one of them is:
"4 is the door, it either opens UP or shuts DOWN."
The 4th time price challenges a level is usually break point. It either breaks up through it, or breaks down.
Just think about it, if a price level has represented support or resistance for 4 tests, bets have been layered in heavily on both sides, when that damn of R/S breaks or holds and prices start to run, a jam for the exit (by those with losing positons) will force price to move.
Click image for original size
I'm sorry if I intimidated you Paul....I make many bad trades too but usually try to post the high probability ideas so nobody is learning my bad habits. I hope nobody feels pressured to post and trade as that is not the smartist thing to do. I just wish more would share their ideas even if it is after the fact. It doesn't matter to me as I'm alays looking for consistent ideas that work over time.
We never know when we will get inspired or from what source.
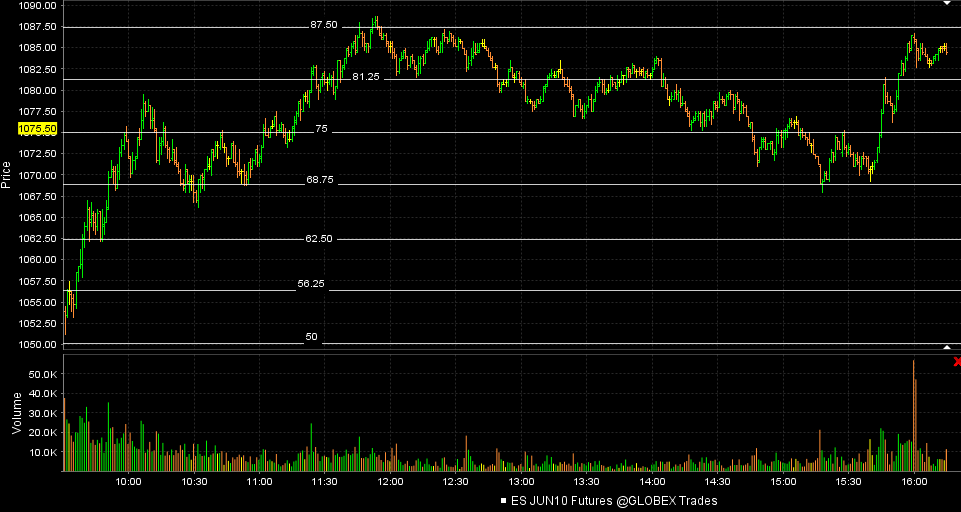
I'm glad you posted your numbers Paul as it demonstrates why I was so "loud" yesterday about the numbers....here are my numbers that we can use for confluence that run from the key 50 number through the key 00 number..this obviously includes the 75 key also..
50
56.25
62.50
68.75
75
81.25
87.50
93.75
100
now look atthe keys you mentioned....look atthe overnight low, look at the 62.50..look at the 68.75 stall...the 75 stall...the 81.25
there all there....just fascinating.....use these for confluence with your signal
We never know when we will get inspired or from what source.
I'm glad you posted your numbers Paul as it demonstrates why I was so "loud" yesterday about the numbers....here are my numbers that we can use for confluence that run from the key 50 number through the key 00 number..this obviously includes the 75 key also..
50
56.25
62.50
68.75
75
81.25
87.50
93.75
100
now look atthe keys you mentioned....look atthe overnight low, look at the 62.50..look at the 68.75 stall...the 75 stall...the 81.25
there all there....just fascinating.....use these for confluence with your signal
Yes, Bruce. This morning when I turned on my computers at 3:15 I put your ratchets on a 1 minute chart... pretty amazing.
and I forgot to say Paul that you do post lots of useful stuff and I appreciate it.......
In general I think it can be tuff being in a room where people post as it can affect what we are thinking and our trades...even in subtle ways...sometimes it rattles our confidence and puts more pressure on us....the desire to be right is very strong in all of us...
OK..nuff said on that...In MP terms we traded higher value yesterday and that key 56 area held...that was also single prints from Tuesdays trade....so hopefully we will see higher trade into the weekly PV at 94 area...
more ratchets...
1106.25
1100
93.75
87.50
all in 6.25 increments off our key splits...how you use the numbers is a different story...
here is a chart that was on my desktop from the other day with the levels on it....so some can see the value or lack of...
The 87.50 seems to be getting a lot of attention today.
Hey Paul have you ever looked at the overnight as a separate day and if we close in the upper 20% then there are good odds we break out of that side first? what happens if it makes a Higher high then the previous RTH or previous O/N session as an additional filter?
Click image for original size
Bruce, RE close AH in top 20%, I'll try to get to it this weekend.
big volume zone is 80 - 86...huge for us....as long as the 80 holds we should go for the weekly PV...in RTH
So Bruce, the 6.25 point ("ratchets") ... are you simply placing those levels statically across price beginning at "0" and then "6.25" and then "12.50" etc. all the way on up to and beyond where the SP is trading ... OR ... are you basing where you pick your "initiating point" on a price swing (for example) and then using that price to then generate the "ratchet" levels above and below that initial price level?
Originally posted by BruceM
I'm sorry if I intimidated you Paul....I make many bad trades too but usually try to post the high probability ideas so nobody is learning my bad habits. I hope nobody feels pressured to post and trade as that is not the smartist thing to do. I just wish more would share their ideas even if it is after the fact. It doesn't matter to me as I'm alays looking for consistent ideas that work over time.
We never know when we will get inspired or from what source.
I'm glad you posted your numbers Paul as it demonstrates why I was so "loud" yesterday about the numbers....here are my numbers that we can use for confluence that run from the key 50 number through the key 00 number..this obviously includes the 75 key also..
50
56.25
62.50
68.75
75
81.25
87.50
93.75
100
now look atthe keys you mentioned....look atthe overnight low, look at the 62.50..look at the 68.75 stall...the 75 stall...the 81.25
there all there....just fascinating.....use these for confluence with your signal
upper value area 88.75 held so far
$tick mostly positive (one brief -10 reading on my feed), and no +1000 spike yet.
RTH-Only players respecting Resist at 89.50, but break above that level should trigger some buys.
I couldn't do it either. Just not enough to convince me to stay long so I stepped out to enjoy the afternoon. Saw it finally reached that 1100. Oh well.
Emini Day Trading /
Daily Notes /
Forecast /
Economic Events /
Search /
Terms and Conditions /
Disclaimer /
Books /
Online Books /
Site Map /
Contact /
Privacy Policy /
Links /
About /
Day Trading Forum /
Investment Calculators /
Pivot Point Calculator /
Market Profile Generator /
Fibonacci Calculator /
Mailing List /
Advertise Here /
Articles /
Financial Terms /
Brokers /
Software /
Holidays /
Stock Split Calendar /
Mortgage Calculator /
Donate
Copyright © 2004-2023, MyPivots. All rights reserved.
Copyright © 2004-2023, MyPivots. All rights reserved.