ES Short Term Trading 6-16-10
Here's a 30m chart of the last 20 days (continuous contract) with Price Action Support Resistance lines drawn in RED with MAGENTA as semi-significant PASR zones. The dashed CYAN lines are the Wkly Pvt levels. It's simply a "map" for trading Wednesday. Volume at Price is also shown on the vertical right side of the chart.
Click image for original size
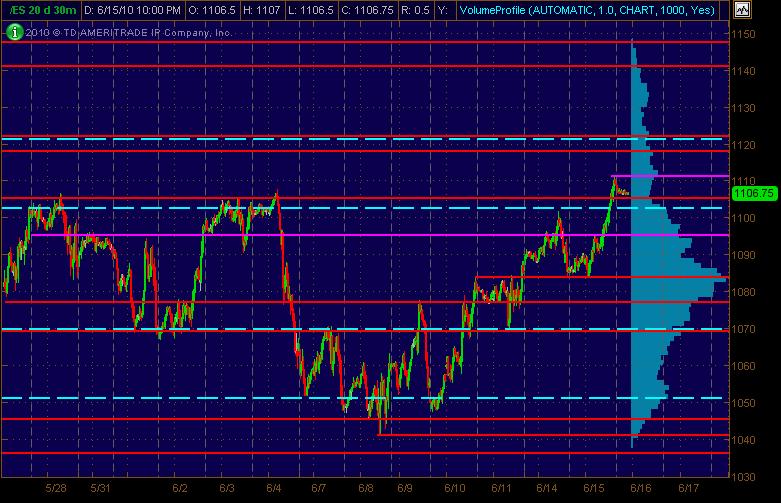
Here are the levels, though spread apart by quite a few points:
1121 potential significant PASR which coincides with the Wkly R2 Pvt
1105-1100 ZONE consisting of:
-1105 Significant PASR
-1103 Wkly R1 Pvt and
-1100 is 6-14 high (within a tick)
1095 semi-significant PASR
1083 potential significant PASR
The mypivots 5-day and 10-day AvgTrueRange is roughly 25 points. And don't forget incorporating Bruce's RATCHETS and tracking the /NQ and /YM intraday for confirmation of moves.
NOTE: Tuesday was by any metric a TREND DAY. So, based on a Don Miller MATD, that should be kept in mind for Wed. morning trading. Here's the link/description: http://www.mypivots.com/Investopedia/Details/336/morning-after-trend-day-matd
I don't know where price will open, but historically (and this is sort of in synch with the MATD observations), gap up or down after day of large unfilled gap will fill roughly 85% of the time.
Where's Phileo?
this market (daily bars) has conditions in place that could create a bullish Jerry's Dragon. You seem much more familiar with the formation than I am, what would be a clear sign of confirmation for a successful Jerry's bullish dragon? (if you could)
Markets have memories...
Remember yesterday, I mentioned that the 97-95 area was a resistance point, a stumbling point where some consolidation could occur? Well, 97 handle is on the radar screen again today, not only because of yesterday's slight sideways at 97, but because 1097.88 is 50% of this week's RTH range.
Markets usually seek confirmation of an initial move and they often do that be retracing 50% of the move or by retesting a breakout point on the chart.
I see that in the O/N 1102.75 printed and attracted buyers.
50% of yesterday's RTH range is 1101.38
50% of this week's range (RTH only, that would be Mon and Tues) is 1097.88
price has broken out above the highest RTH H of the prior 2 weeks which was 1100.75
there are plenty of price points of interest right in the lower 1100 area.
If there is a price move to the 1102 handle down to 1097 handle, it will be a decision zone for buyers and sellers. I would expect a DB or some sort of bounce, but it will be the PA in that zone (if reached) that should offer insight.
I don't know how to handicap the fact that this is a Wednesday in the week of the Triple Witch. I think it is more important to recognize the day as MATD.
I have noticed that (at least the last few times) when there has been an MATD, price oscillation as described in mypivots dictionary occurs, but I have also noticed that there has been a tendency for price to re-assert itself in the afternoon in the direction of the trend of the previous day. WIndow of time for a potential "low that launches" upside has been 12:50-1:40pm Eastern. After Up trend days, I have seen more than one early afternoon low (that reverses) look like a retest of the morning Low (a retest that does not undercut, but I don't know whether not undercutting matters).
If price fails to find support 97-95, would assume needs reteat to 85 area.
this might be my only post of the day... good trading to all. And enjoy your vacation, Bruce.
the 8:30am est 5min. bar is accumulation
now we got a reversal signal under resistance...which one
will win...stay tuned
will win...stay tuned
two 30 minute bars should trade through open print....sell the rallies typw of day.....I'll be surfing...good luck all...monitor that 1100 - 1101...critical today
couldn't resist..short small at 1109..looking for 06.50..hopefilly 1112.50 doesn't print first
Originally posted by BruceM
couldn't resist..short small at 1109..looking for 06.50..hopefilly 1112.50 doesn't print first
can you explain why you shorted here please? the reason i ask is because i wouldve waited till 12.5...am i being too cautious? do you see something that i don't?
sell the rallies day..gap fill...RAT at 1106.50...Volume accumulating at 1106 confirms that number so they will test it...often,,trade back to open magnet and two 30 minute bars need to go through open...soon!!
Originally posted by feng456
Originally posted by BruceM
couldn't resist..short small at 1109..looking for 06.50..hopefilly 1112.50 doesn't print first
can you explain why you shorted here please? the reason i ask is because i wouldve waited till 12.5...am i being too cautious? do you see something that i don't?
flat 1104.75 on last...gotta run.....consolidation day forming
Originally posted by feng456
Originally posted by BruceM
couldn't resist..short small at 1109..looking for 06.50..hopefilly 1112.50 doesn't print first
can you explain why you shorted here please? the reason i ask is because i wouldve waited till 12.5...am i being too cautious? do you see something that i don't?
The 1109 was a couple ticks away from a gap fill.
Gap fill tends to be an area of resistance (at least initially), and today this proved to be the case.
On MATD's, you need to guess the oscillation points, that is where you will do business.
Because Price opened below the gap but inside yesterday's VA and above yesterday's POC, you could make a case for at least a long targetting the VAH 1105, and extended target being gap fill.
my guess for the MATD oscillation low was 1100, price dropped to 1102.5 on the 1st -ve TICK extreme before bouncing.
Note also that this is the 2nd time I've observed the EIA crude oil report moving ES along to its target.
Originally posted by PAUL9
I don't know where price will open, but historically (and this is sort of in synch with the MATD observations), gap up or down after day of large unfilled gap will fill roughly 85% of the time.
Where's Phileo?
this market (daily bars) has conditions in place that could create a bullish Jerry's Dragon. You seem much more familiar with the formation than I am, what would be a clear sign of confirmation for a successful Jerry's bullish dragon? (if you could)
....
Click image for original size
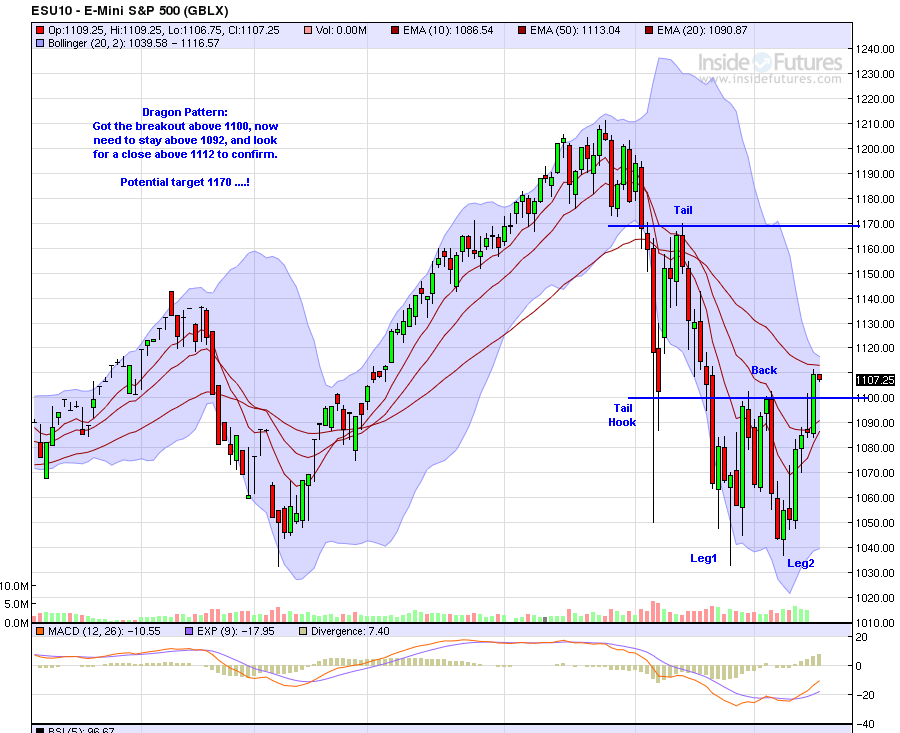
Hope this helps.
Again, I am not really trusting of these patterns, but when they line up with known support and resistance areas, then it's potentially a different story.....
Emini Day Trading /
Daily Notes /
Forecast /
Economic Events /
Search /
Terms and Conditions /
Disclaimer /
Books /
Online Books /
Site Map /
Contact /
Privacy Policy /
Links /
About /
Day Trading Forum /
Investment Calculators /
Pivot Point Calculator /
Market Profile Generator /
Fibonacci Calculator /
Mailing List /
Advertise Here /
Articles /
Financial Terms /
Brokers /
Software /
Holidays /
Stock Split Calendar /
Mortgage Calculator /
Donate
Copyright © 2004-2023, MyPivots. All rights reserved.
Copyright © 2004-2023, MyPivots. All rights reserved.