ES short term trading 7-6-10
This week's Economic Events.
took one more off at OR high....holding 3....because of add on at 37.75 rat!!! any luck they will print the 25 rat today!!
I'll get to that later Paul..I won't forget
I'll get to that later Paul..I won't forget
took two off at 25 print...holding one now.....good start for the week..that was third RAT!!
Bruce what was it that had you focused on the 25 level.
I look at Monthly, weekly, daily H-L-C-50% (for WKLY and Monthly 2 time periods back).
So far, attempt to break above last month's Close and Low has been rejected (tyypical of first attempts) and price has come back to test 1024.50 which was June's close.
Right now I guess prices has to get back above Friday's H (1029) to revive interested bulls.
a beauty as they tested that low range 15 minute bar and sold it off...gotta sell off agin soon or I'll be stopped at 29 area
It was a peak volume price of the O/N session before the volume changed to 29....it's also a Major Rat...(00, 25,50 and 75)
Originally posted by PAUL9
Bruce what was it that had you focused on the 25 level.
I look at Monthly, weekly, daily H-L-C-50% (for WKLY and Monthly 2 time periods back).
So far, attempt to break above last month's Close and Low has been rejected (tyypical of first attempts) and price has come back to test 1024.50 which was June's close.
Right now I guess prices has to get back above Friday's H (1029) to revive interested bulls.
getting a little scary how this rally is fading fast.
If 1025 can't hold, then a test of 1017 is coming up.
If 1025 can't hold, then a test of 1017 is coming up.
Originally posted by BruceM
It was a peak volume price of the O/N session before the volume changed to 29....it's also a Major Rat...(00, 25,50 and 75)Originally posted by PAUL9
Bruce what was it that had you focused on the 25 level.
I look at Monthly, weekly, daily H-L-C-50% (for WKLY and Monthly 2 time periods back).
So far, attempt to break above last month's Close and Low has been rejected (tyypical of first attempts) and price has come back to test 1024.50 which was June's close.
Right now I guess prices has to get back above Friday's H (1029) to revive interested bulls.
Hi Paul,
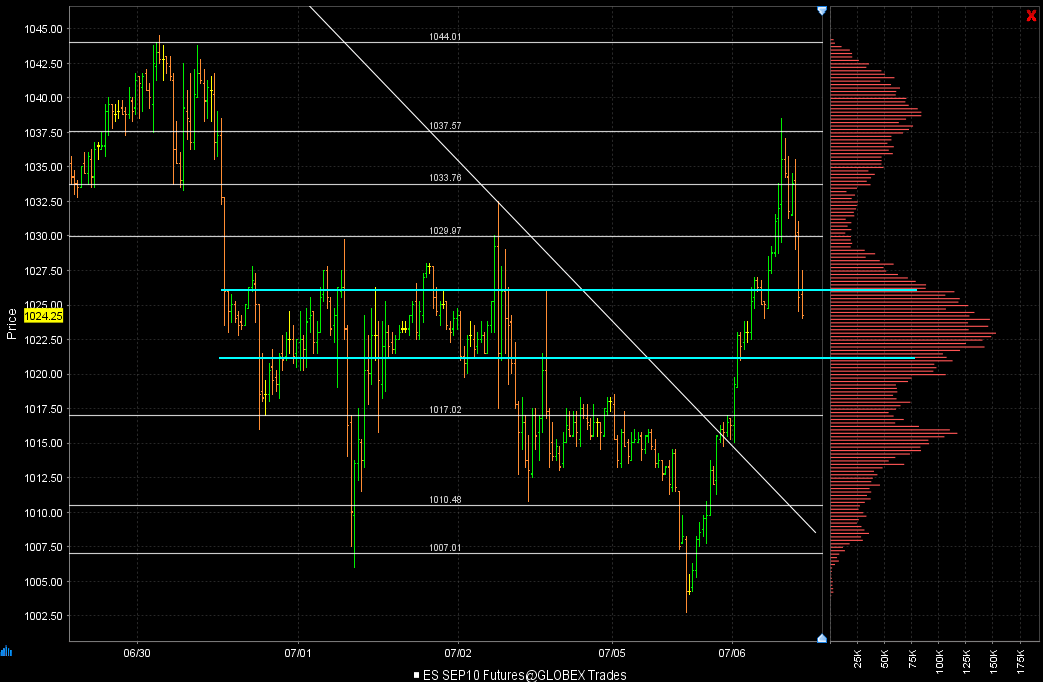
I see 1026-1021 as being the VA from the past 3 day's of price action.
1025 should stop any price probes downward, if not, then 1021 and 1017 are the next targets.
stop on last is now at 27.75....that's a fairly low range bar on the lows so if they can't break it down and hold they will try to run it up and I don't want to be short on that move
Bruce can you please post date and time of that volume spike at 25 price? you are talking about just volume, right, not volume at price sideways histogram
phileo,
yeah, chart breakout point certainly 1018-1017 area.
all in all if price can manage a higher close today and tomorrow, I think it would be a postiive for some upside have to see (IF) what price does at the 1042 level (50% of previous week)
phileo,
yeah, chart breakout point certainly 1018-1017 area.
all in all if price can manage a higher close today and tomorrow, I think it would be a postiive for some upside have to see (IF) what price does at the 1042 level (50% of previous week)
phileo,
is histogram on rt side of your chart MP or Volume at price?
is histogram on rt side of your chart MP or Volume at price?
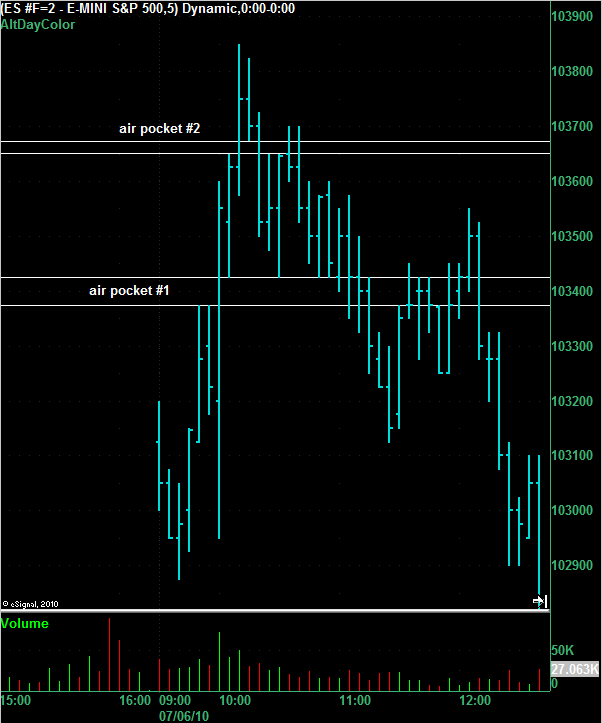
Here's another view of the same chart that BruceM posted above. I've stretched it out vertically to make the air pockets clearer.
Emini Day Trading /
Daily Notes /
Forecast /
Economic Events /
Search /
Terms and Conditions /
Disclaimer /
Books /
Online Books /
Site Map /
Contact /
Privacy Policy /
Links /
About /
Day Trading Forum /
Investment Calculators /
Pivot Point Calculator /
Market Profile Generator /
Fibonacci Calculator /
Mailing List /
Advertise Here /
Articles /
Financial Terms /
Brokers /
Software /
Holidays /
Stock Split Calendar /
Mortgage Calculator /
Donate
Copyright © 2004-2023, MyPivots. All rights reserved.
Copyright © 2004-2023, MyPivots. All rights reserved.

