ES short term trading 7-6-10
This week's Economic Events.
Thought I'd toss out my S/R price action levels that I have for Tuesday's trading map. The 30-min bar chart has Red as potential significant S/R levels with Magenta as semi-significant. The dashed Cyan lines are the Wkly Pvts from mypivots site. The light blue bars on the right legend of the chart are Volume at Price for the past 20 trading days on a 30-min bar basis.
Hope this is helpful and can be combined with whatever analysis any trader brings to the market to increase the odds of a decent, high probability trade. A bit late, so don't have any stock setups or internals to post (long weekend - worn out).
If the market opens inside of the 1010-1030 range of the past 2+ trading sessions (after probing down near 1000), then I'm looking at more range type trading ... with the expectation of another strong directional move as it cycles out of big to small and back to big(ger) range. Have been playing some non-directional (delta neutral) straddle and strangle strategeries lately for a decent profit ... even with the jacked up volatility. Just sharing my cent and a half. Here's my map for trading equities and the ES/SPY:
Click image for original size
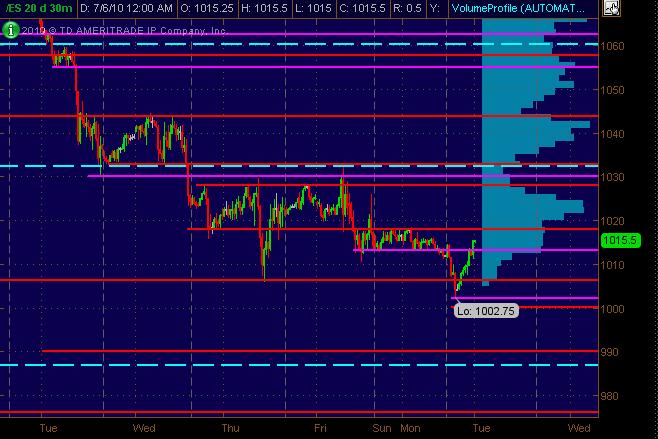
To post numbers and walk it down with coinciding S/R ZONES with "confluence" (for lack of a better, overused word) ... here's what I've got (PASR = Price Action Support/Resistance):
1033 PASR Level and weekly Mid Pivot
1028 PASR Level and R1 Daily Pivot
1022-1024 High Volume at Price Zone
1018 PASR and Median Daily Pivot @ 1019
1006 PASR and S1 Daily Pivot
1033 PASR Level and weekly Mid Pivot
1028 PASR Level and R1 Daily Pivot
1022-1024 High Volume at Price Zone
1018 PASR and Median Daily Pivot @ 1019
1006 PASR and S1 Daily Pivot
Looking for a retest of 25 in RTH...hopefully after a higher trade up above 30....
1033 has lots of numbers there...the ideal trade would see a breakout above there that fails going back to 1025..
Overnight key breakout area is 1017 - 1018.50
so we have lots of the same areas MM...!! lets break the bank open today!!
1033 has lots of numbers there...the ideal trade would see a breakout above there that fails going back to 1025..
Overnight key breakout area is 1017 - 1018.50
so we have lots of the same areas MM...!! lets break the bank open today!!
new peak volume is O/N is 29 so that 25 number is secondary volume now..
short small at 28.75...we may need to add in RTh above 30 but otherwise 25.75 should test
short small at 28.75...we may need to add in RTh above 30 but otherwise 25.75 should test
Two weeks ago, we had a huge gap up (+16pts) resulting in a bearis engulfing candlestick to kick off this vicious 10 days of intense selling.
Now, we are about to have a similar huge gap up (+14pts as of 550am PST) and a potential bullish engulfing candlestick if ES closes above 1032 today.
Do we all agree that a +24pt run-up in the O/N globex session is "unusual"? This could mark the relief rally that everyone is looking for.
Last week's range was 73pts.
3WAR = 58pts.
3DAR = 22pts.
Today's range is already +25pts. On Friday, we saw some responsive selling starting at 1025.5, but we are now above that level. I also remember several times last week each attempt to probe 1026 level was rejected. Now priced is potentially gapping up above that level to trap some sellers. Potential fuel for a rally. For those who might doubt a rally, I refer you to Tues 6/29, when we gapped down -16pts, and sold off another 20pts.
Every currency that I am watching has rallied overnight, with the Aussie leading the way with a +190pip gain. Bonds have sold off overnight, and will soon be approaching a key support level (127.03).
For these reasons, My bias for the session today is up. As such, I will look for pullbacks to go long.
Potential Areas of support:
1025.5-26.5: opening price for last Thurs + Fri + starting pt of two selloffs on Fri. + afternoon pullbacks on Thurs.
1017-1018: key inflection point on Thurs. + acted initially as support on Fri.
Potential Resistance zones:
1029: RTH for both last week Thurs + Fri.
1030.5: last Tues. RTH low.
1032 - 33: NFP PreMkt high, Feb5 lo + May 25 Lo + last Wed. O/N lo
1035-36: last week former support level + former VAL
Now, we are about to have a similar huge gap up (+14pts as of 550am PST) and a potential bullish engulfing candlestick if ES closes above 1032 today.
Do we all agree that a +24pt run-up in the O/N globex session is "unusual"? This could mark the relief rally that everyone is looking for.
Last week's range was 73pts.
3WAR = 58pts.
3DAR = 22pts.
Today's range is already +25pts. On Friday, we saw some responsive selling starting at 1025.5, but we are now above that level. I also remember several times last week each attempt to probe 1026 level was rejected. Now priced is potentially gapping up above that level to trap some sellers. Potential fuel for a rally. For those who might doubt a rally, I refer you to Tues 6/29, when we gapped down -16pts, and sold off another 20pts.
Every currency that I am watching has rallied overnight, with the Aussie leading the way with a +190pip gain. Bonds have sold off overnight, and will soon be approaching a key support level (127.03).
For these reasons, My bias for the session today is up. As such, I will look for pullbacks to go long.
Click image for original size
Potential Areas of support:
1025.5-26.5: opening price for last Thurs + Fri + starting pt of two selloffs on Fri. + afternoon pullbacks on Thurs.
1017-1018: key inflection point on Thurs. + acted initially as support on Fri.
Potential Resistance zones:
1029: RTH for both last week Thurs + Fri.
1030.5: last Tues. RTH low.
1032 - 33: NFP PreMkt high, Feb5 lo + May 25 Lo + last Wed. O/N lo
1035-36: last week former support level + former VAL
starting RTH shorts at 32 now...29 is key first
will look for new sells above 33 now.....would like to see $ticks higher still...harder fade as 29 already tested and held....so far!!
on the 33.75 now.....as I type...yikes
on the 33.75 now.....as I type...yikes
flat 32.75...too close to report
Gapguy says Up gaps fp;;pwong 3 day weekend less lkely to fill.
My own measures based on Steenbarger sayu open above .4* 5day average ATR added to previous close historically fills opening gap only about 40% of the time. Today opened at 31.25, .4 * 5 day atr etc came in today at 1031.08, hmmmmm
5 day average of H versus Open calcs to day to 1035.15
5 day average of L versus Open calcs to 1015.10
this 32-33 area has a few numbers bunched weekly PP 33 Friday's R1 32.50 (my pivots based on RTH only)
Bruce, would you be looking for a volume spike OVB and then an inside bar in this area?
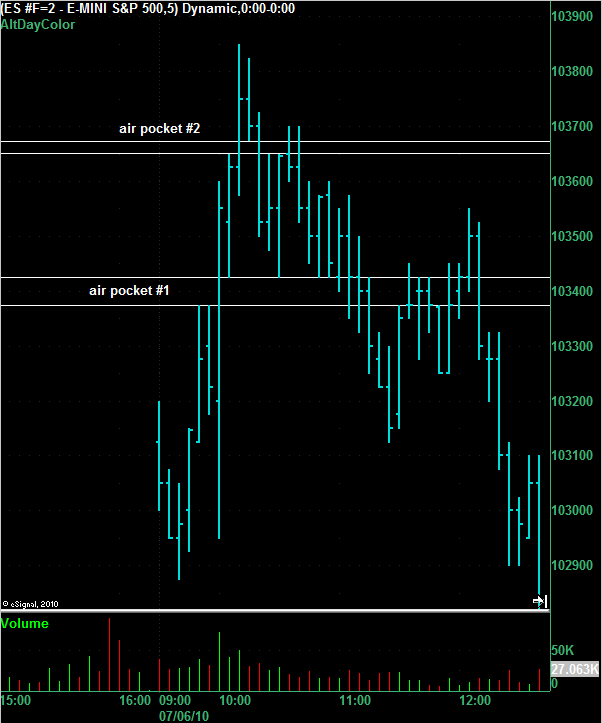
s 36.50 air pocket below...light
Here's another view of the same chart that BruceM posted above. I've stretched it out vertically to make the air pockets clearer.
Click image for original size
Emini Day Trading /
Daily Notes /
Forecast /
Economic Events /
Search /
Terms and Conditions /
Disclaimer /
Books /
Online Books /
Site Map /
Contact /
Privacy Policy /
Links /
About /
Day Trading Forum /
Investment Calculators /
Pivot Point Calculator /
Market Profile Generator /
Fibonacci Calculator /
Mailing List /
Advertise Here /
Articles /
Financial Terms /
Brokers /
Software /
Holidays /
Stock Split Calendar /
Mortgage Calculator /
Donate
Copyright © 2004-2023, MyPivots. All rights reserved.
Copyright © 2004-2023, MyPivots. All rights reserved.