ES short term trading 7-6-10
This week's Economic Events.
flat at 20.75..just don't like that 27.50 high and the fact that we are getting close to the single prints from O/N session...I'll get to those questions soon...gotta eat some lunch
Click image for original size

Originally posted by PAUL9
phileo,
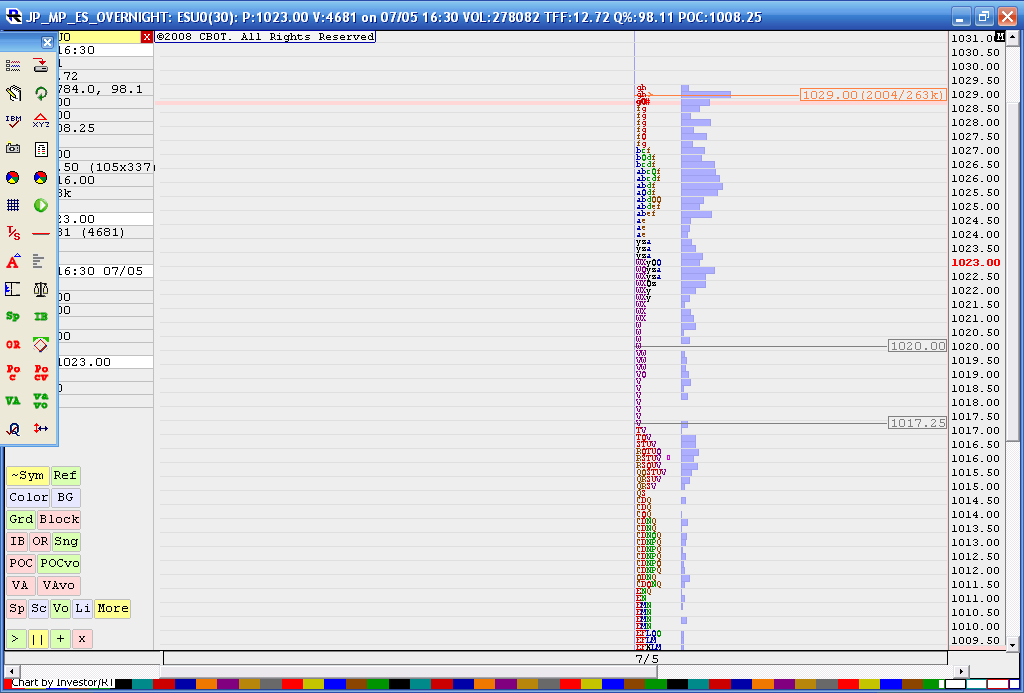
is histogram on rt side of your chart MP or Volume at price?
It's vol. @price.
Note that the gap 1014.25 hasn't filled yet.
i smell some hidden bullishness amongst this selloff
Paul,
This is screen shot of my O/N chart up until about 9 a.m. I'm not showing the last half hour of trade. As per my first posts on this thread today, I thought 25.50 was the big volume area from the On but then it switched to about 29.
Investor r/t draws an Orange line through the POC based on Volume...so you see that ..the software also snaps lines at the single prints so you see lines at the 1117.25 and 1120 area...
Interactive brokers does strange things with the volume so I seem to be drifting towards the lines and volume bulges the software shows. I can't get a clear answer form IB on their histogram...but it still works at finding the low volume areas where no time has spent trading..
I'm gonna work on a chart later which will go into crappy highs and stuff..
Click image for original size
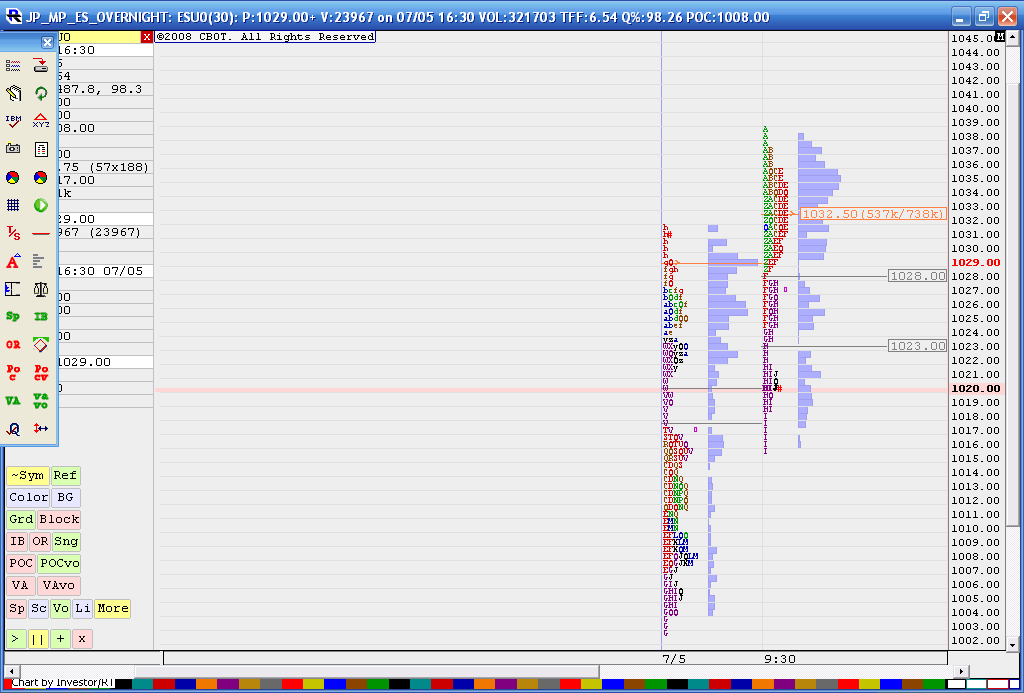
Here is the O/N session and how we are doing in todays sessioin..side by side...they are trying to hold back the decline as we traded slightly below the O/N single prints and are trying to reject that area...look at "H" and "I" periods..
I had to scale this to fit it in...you are looking at the O/N it has a 7/5 at the low time scale and then the day session..it has the 9:30 marker
Good odds they will fill inthe 23 as that is the second set of singles form todays session... I have no trade working..
I had to scale this to fit it in...you are looking at the O/N it has a 7/5 at the low time scale and then the day session..it has the 9:30 marker
Good odds they will fill inthe 23 as that is the second set of singles form todays session... I have no trade working..
Click image for original size
thanks, Bruce
I didn't think that price had a prayer of even approaching its the 5 day average of L vs Open (posted earlier, it was 1015.10)... but that was my problem, I didn't think.
DavidS,
I am curious why you stopped the range retracement tool at the bar completing at 8:30am ET.
I didn't think that price had a prayer of even approaching its the 5 day average of L vs Open (posted earlier, it was 1015.10)... but that was my problem, I didn't think.
DavidS,
I am curious why you stopped the range retracement tool at the bar completing at 8:30am ET.
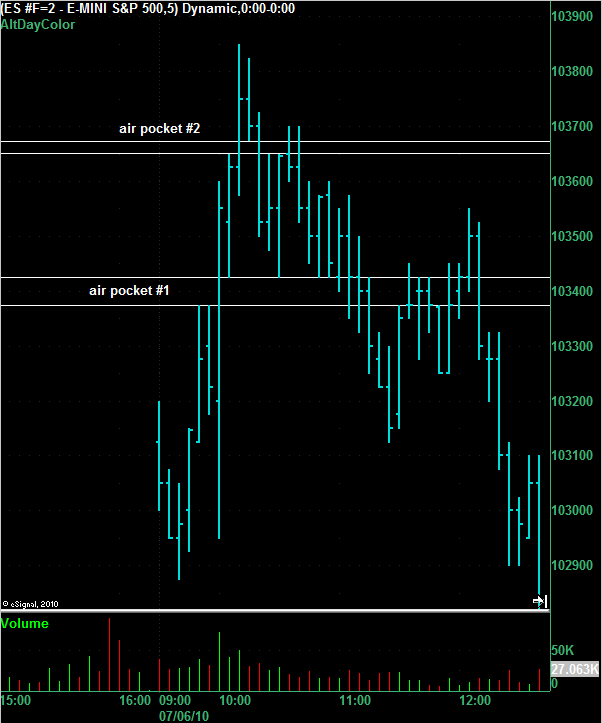
Sizno..not sure if you are here today but fading every 2nd 5 minute air pocket was a winner today..meaning that it filled the second air pockets air fairly quickly I mentioned this the "interesting gap " thread form last night
So we have that 27.50 ledge that didn't get broken and it dropped at least 8 - 10 points below there....even more...this was the same concept I mentioned this morning with those 34.25 bars....but in reverse..
just pointing out the concept...for those interested in ledges.
That 27.50 is critical as we have the ledge, the low range 15 minute and single prints.....that needs to go on our radar for the future if not later today
just pointing out the concept...for those interested in ledges.
That 27.50 is critical as we have the ledge, the low range 15 minute and single prints.....that needs to go on our radar for the future if not later today
Sorry it's not quite perfectly placed.I was attempting to mark the high until it wasn't. Close to 1040 S/R futures(and the S&P 1042.5 high.) Using the 1 minute chart here today.
I'm a little under the weather. Something I ate.
Noticed your nice trade last pm.
I'm a little under the weather. Something I ate.
Noticed your nice trade last pm.
Here's another view of the same chart that BruceM posted above. I've stretched it out vertically to make the air pockets clearer.
Click image for original size
Emini Day Trading /
Daily Notes /
Forecast /
Economic Events /
Search /
Terms and Conditions /
Disclaimer /
Books /
Online Books /
Site Map /
Contact /
Privacy Policy /
Links /
About /
Day Trading Forum /
Investment Calculators /
Pivot Point Calculator /
Market Profile Generator /
Fibonacci Calculator /
Mailing List /
Advertise Here /
Articles /
Financial Terms /
Brokers /
Software /
Holidays /
Stock Split Calendar /
Mortgage Calculator /
Donate
Copyright © 2004-2023, MyPivots. All rights reserved.
Copyright © 2004-2023, MyPivots. All rights reserved.