ES short term trading 7-6-10
This week's Economic Events.
We just saw the bottom of a normal cycle with the O/N low. Could get quite ugly if we're in a super cycle down. I like em as much as anybody but an 81% retrace would increase the probability for 3 digits. Time to be prudent. There just hit the 68% retrace
50 and 68% usual for B waves if ABC up.
no time for charts but the 50% s/r at 1020 and change. I see the 1023/4 on the 5 min and the 1027 on the 10 but nothings positive until that 50% R breaks and holds.
still think they want to clean up that 23.75 pocket...
I hope it works for you. my comments not so much focusing on the end of day moves as general account safety.back at R line 1020+
Really great call Bruce.
Thanks Rburns but anyone can see that (and eventually they will) because it takes extreme selling to leave TWO sets of unfilled single prints on the 30 minute time frame....It's just a high probability...and we filled the gap close from Fridays trade..and then held above the Volume node of 14.50 that someone for some reason has been messing with last week
If you look at those 15 minute lows and notice how they had trouble closing those bars at the lows , they close two bars up off the lows....never closed below 1014.50
The 14.50 was a number I had forgotten about until about 3:15...still a hard trade to take a long on.......Sometimes we know what is suppose to happen but can't find a way to take the trade without undue risk!!
Originally posted by rburns
Really great call Bruce.
Originally posted by BruceM
still think they want to clean up that 23.75 pocket...
Good call Bruce! I am so impressed!
back into that low range bar with a 27.50 high on the 15 minute around 3 PM eastern time...I'm not holding Overnight but that 27.50 high will be interesting
Hey Paul...here is a chart I did after that exit earlier...
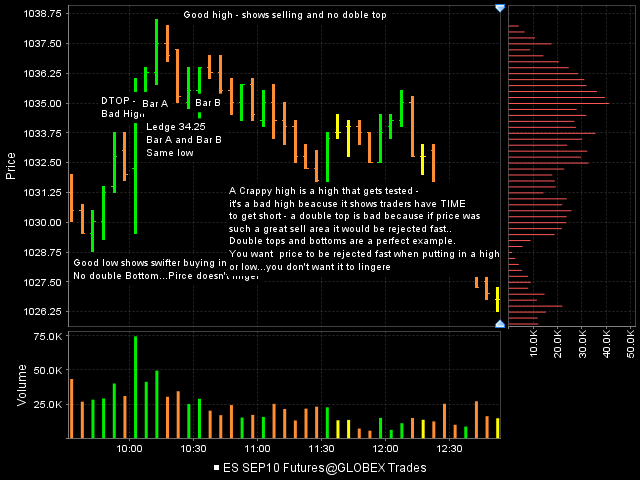
Look at the 5th and 6th five minute bars of the day of RTH...we have a double top at the then current high of the day in front of the reports...I was short and exited in front of the report due to those bars.....The small traders look at double tops at highs and DB's at lows and think they have the high of the day,,,but they get run out..too often
The point about the "crappy" highs and lows is that you really want to see impulse in the move down off highs when you are short....if price is such a great sell at high points then it won't stay there for long...the smart money will sell and sell quickly....double tops on 5 minute bars shows me that price is hanging out and nobody is in a rush to sell...so often those won't be good highs that hold...the market will go up above them...Double tops are obvious but we need to watch how we close off the 5 minute highs to show some selling impulse..
Reverse the concept for good lows...Great lows on the 15 minute this afternoon..the air pocket got the low...tough trade though at that time of day....anyway here is a chart with the double top and some other ramblings....this is obviosuly for all to see and not just Paul...kinda crude but it was hammered out fast
Click image for original size
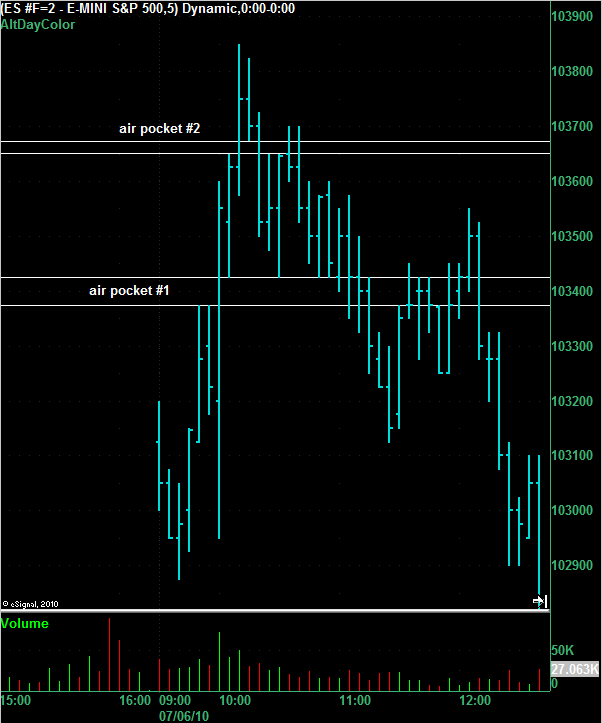
Here's another view of the same chart that BruceM posted above. I've stretched it out vertically to make the air pockets clearer.
Click image for original size
Emini Day Trading /
Daily Notes /
Forecast /
Economic Events /
Search /
Terms and Conditions /
Disclaimer /
Books /
Online Books /
Site Map /
Contact /
Privacy Policy /
Links /
About /
Day Trading Forum /
Investment Calculators /
Pivot Point Calculator /
Market Profile Generator /
Fibonacci Calculator /
Mailing List /
Advertise Here /
Articles /
Financial Terms /
Brokers /
Software /
Holidays /
Stock Split Calendar /
Mortgage Calculator /
Donate
Copyright © 2004-2023, MyPivots. All rights reserved.
Copyright © 2004-2023, MyPivots. All rights reserved.