ES short term trading 7-7-10 5921
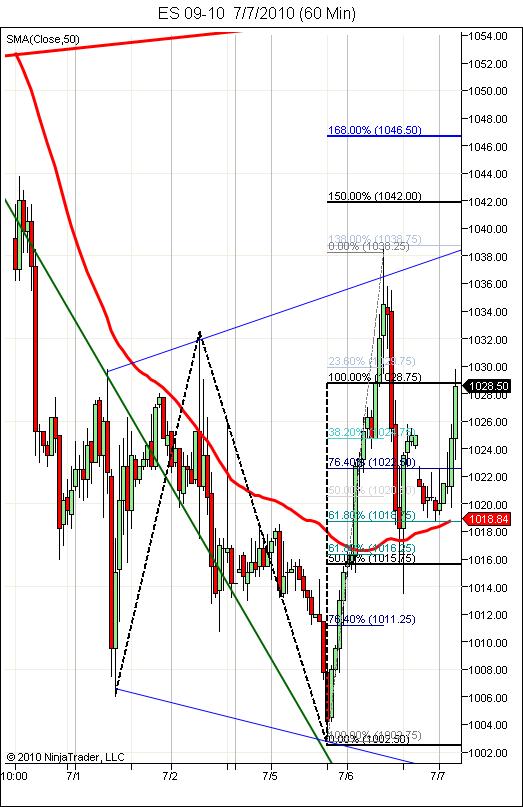
Just a giant range between 1039 and 1006
key zones
1037 - 1039
1025 - 1028
1014.50
1006
key zones
1037 - 1039
1025 - 1028
1014.50
1006
Favor shorts with that failure into the 39 spike and yesterdays single print at the 27.50 area...
starting small at 27.25..shorts...24.50 is peak volume from O/N
added at 28.75...good volume so we need caution on this fade
Click image for original size
broke O/N high and filling in single prints...even more tricky now..new highs coming agin I think
flat 27.25..may miss the down move but don't like that double top
I like it. I'm attempting to short under that high too, Let's see?
Oh well. Upside target 1050 area if it makes it. Megaphone pattern. Usually a reversal signal. I'mnot sure.
The early attempt to short worth the risk.
The early attempt to short worth the risk.
bias has been up since 321am PST.
we had an opening drive away from 1025-1026 key level.
Now we are testing yesterday's opening price.
pullbacks have been shallow, no -ve TICK extreme yet.
we had an opening drive away from 1025-1026 key level.
Now we are testing yesterday's opening price.
pullbacks have been shallow, no -ve TICK extreme yet.
Here are Phileo's comments from the duplicate thread:
Click image for original size
Past 3 days of action suggests more range bound consolidation. If it weren't for yesterday's new contract low (1003.5) in the O/N session, I'd say the higher lows are being made.
Afternoons have sold off or remained flat bias throughout the past 2 weeks. I will be looking for a change in behaviour.
Key levels I will be looking at:
1016.5-1018: key inflection point on Thurs. + acted initially as support on Fri. + support for YDay.
1025.5-26.5: this continues to be a key line in the sand, as it is:
closing price last Wed + opening price for last Thurs + Fri + starting pt of two selloffs on Fri. + contained afternoon pullbacks on Thurs.
1039-1040: VAH + prior support zone, should provide resistance
1030.5 - 1031.5: last Tues. RTH low. + YDay's open + POC
bias has been up evers since 321am PST.
opening drive broke out of the 1025-26 key area
Now we have to see if buyers step up on the pullbacks, or will we see another repeat of YDay where HoD was made in the morning, and LoD in the afternoon....?
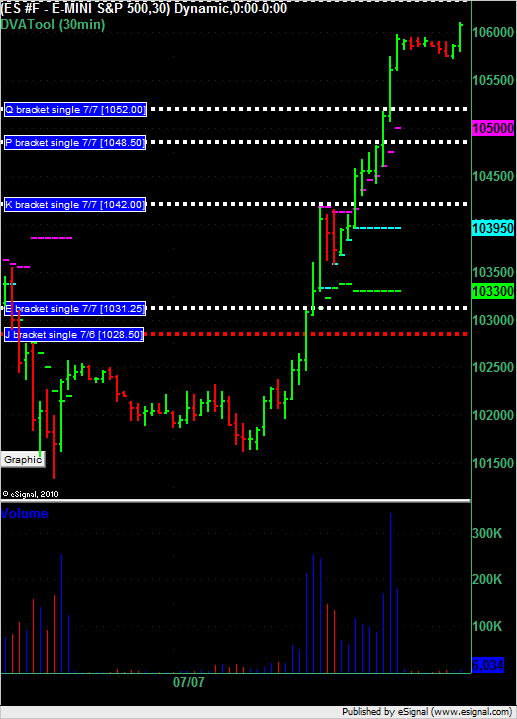
Here's a 30 minute chart of the ES with the DVATool on it showing 1 filled in single print from Tuesday (red horizontal dotted line) and 4 single prints left from today's trading (white horizontal dotted lines).
Click image for original size
Emini Day Trading /
Daily Notes /
Forecast /
Economic Events /
Search /
Terms and Conditions /
Disclaimer /
Books /
Online Books /
Site Map /
Contact /
Privacy Policy /
Links /
About /
Day Trading Forum /
Investment Calculators /
Pivot Point Calculator /
Market Profile Generator /
Fibonacci Calculator /
Mailing List /
Advertise Here /
Articles /
Financial Terms /
Brokers /
Software /
Holidays /
Stock Split Calendar /
Mortgage Calculator /
Donate
Copyright © 2004-2023, MyPivots. All rights reserved.
Copyright © 2004-2023, MyPivots. All rights reserved.