ES short term trading 9-23-10
Key area above is 25.50 - 27.75....that is a ledge and single prints from O/N session and part of key volume from Mondays breakout trade.....that becomes resitance now
Other area is 20.50 as that is midrange of volume spike from 8:30 report
ON low is also important today...currently at 17.50
we will open outside of YD range most likely so we need to think a bit differently...reports at 10 am.
Other area is 20.50 as that is midrange of volume spike from 8:30 report
ON low is also important today...currently at 17.50
we will open outside of YD range most likely so we need to think a bit differently...reports at 10 am.
If the P-62 concept plays out then that projects down into the key rat of 1100! just an FYI....using 20 point range for Monday
If my data is correct then we have some huge volume here at that O/N report...so hopefully that will carry over to the day session
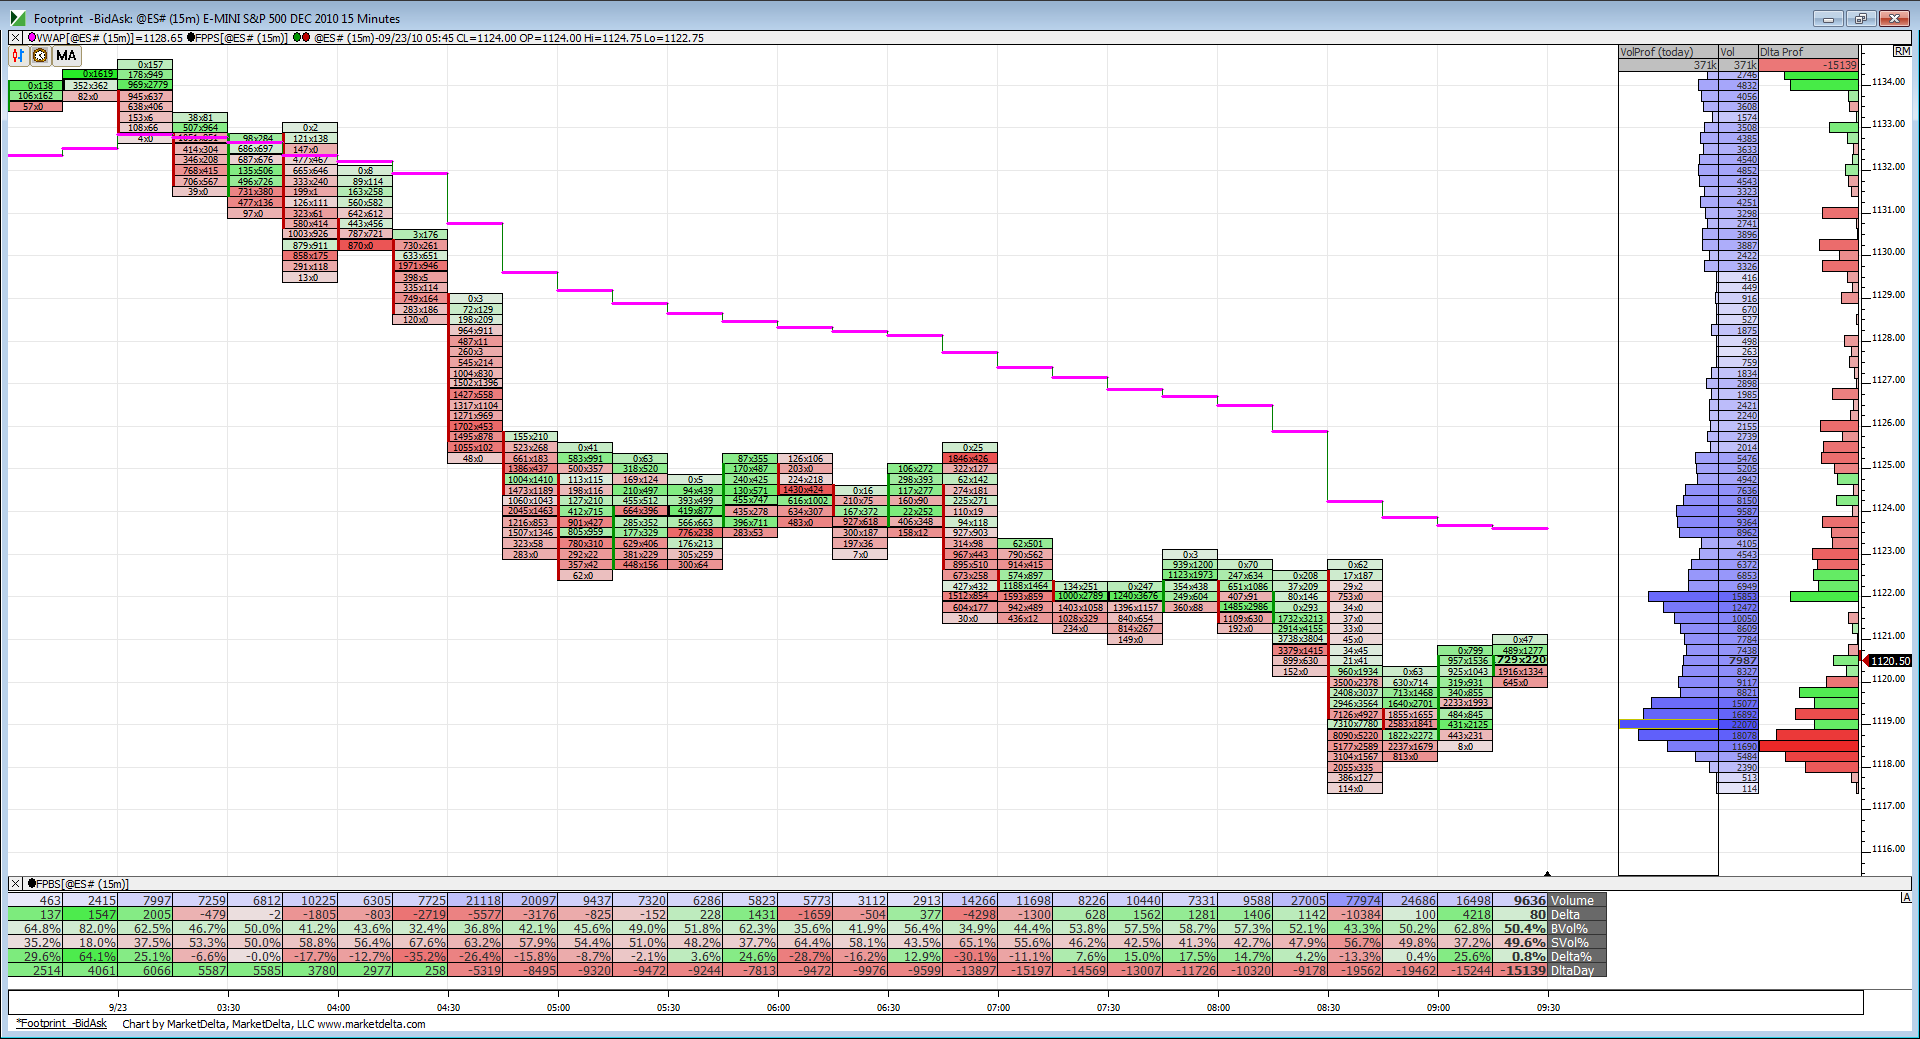
Here is the footprint. Lots of action to the downside here in the O/N and it started before the 8:30 news. RTH will be opening below yesterday's range so look for a possible dynamic move in either direction.
That NVPOC of 1120 is gonna most likely be hit and right below it is 1116.75.
That NVPOC of 1120 is gonna most likely be hit and right below it is 1116.75.
Click image for original size
Interesting that the O/N low coincides with those two lows back on the 17th and 20th. Definitely an important support.
Originally posted by BruceM
ON low is also important today...currently at 17.50
RTH prices
618 extension DOWN of Monday's range means price would have to print 1109.50 in order to activate expectation for print (full extension) of 1102.25.
If 1109.50 prints, possibility of 1102.25 print runs all the way to close on MOnday (RTH only)
618 extension DOWN of Monday's range means price would have to print 1109.50 in order to activate expectation for print (full extension) of 1102.25.
If 1109.50 prints, possibility of 1102.25 print runs all the way to close on MOnday (RTH only)
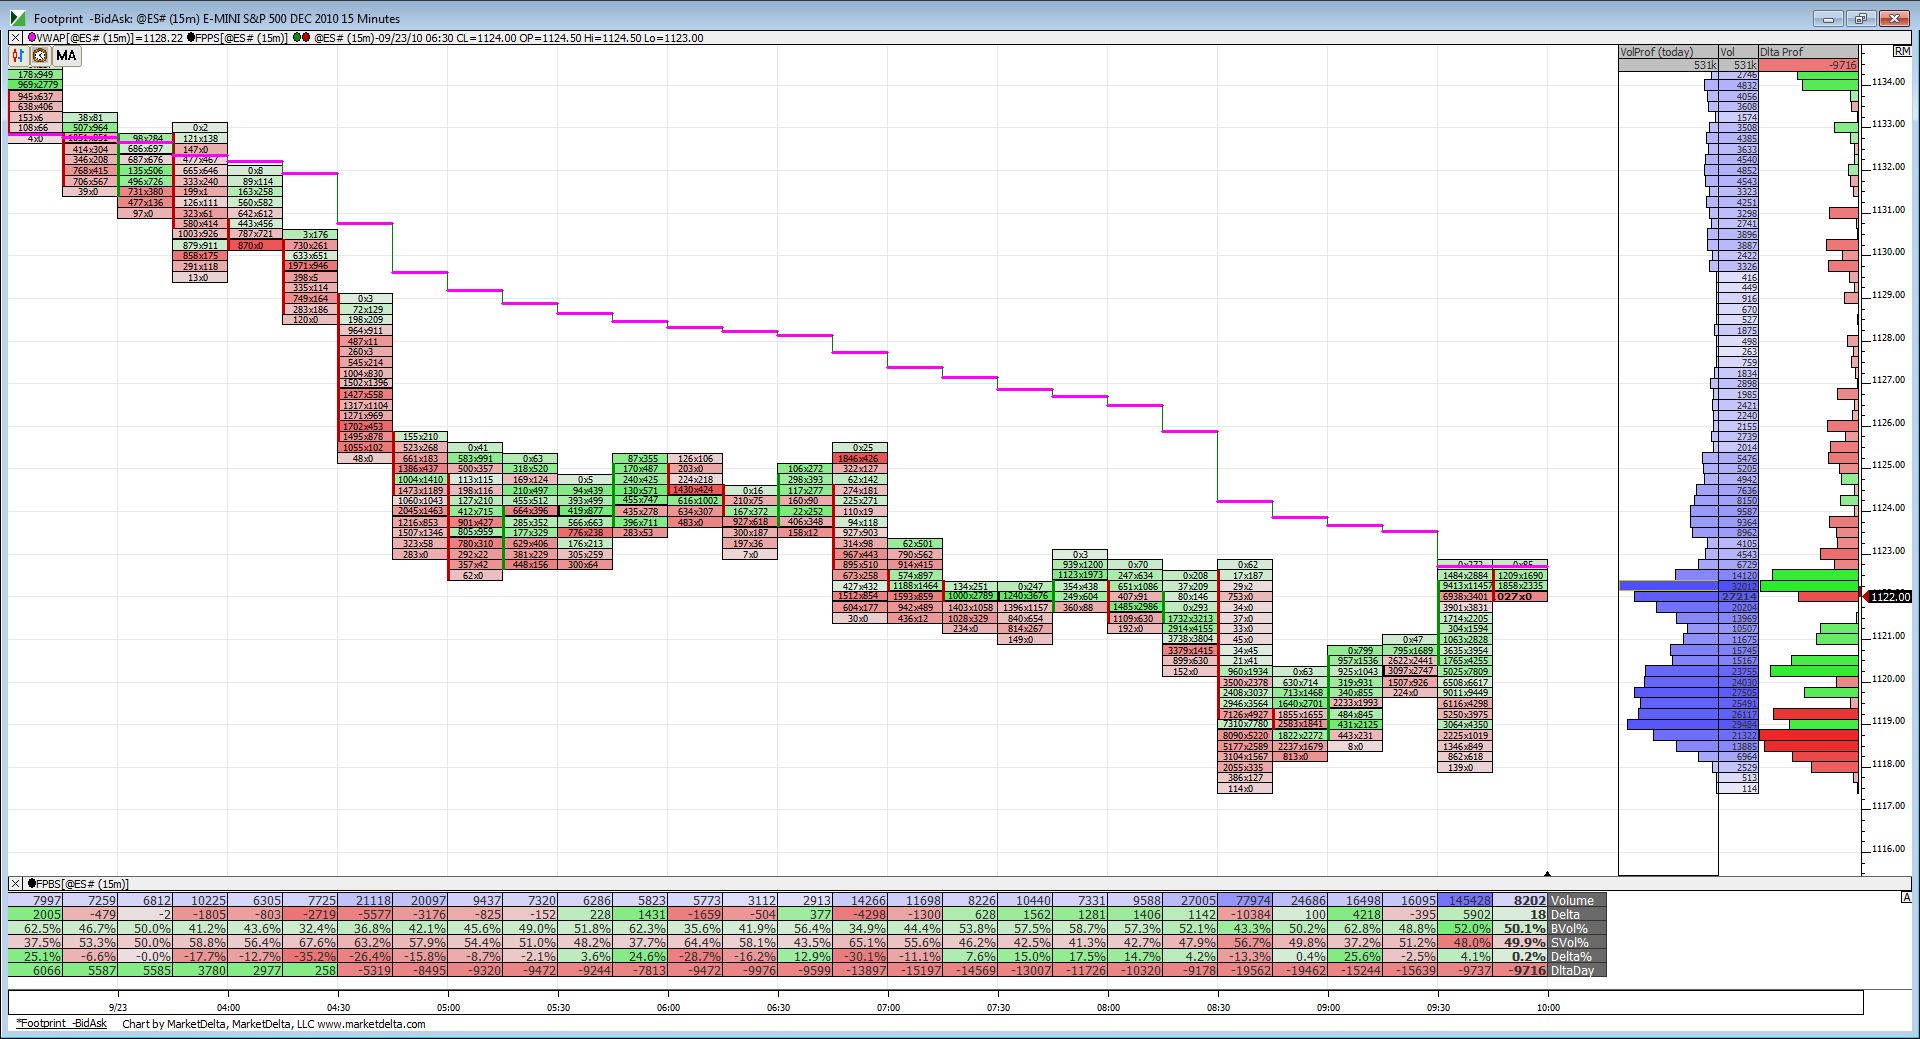
Back to VWAP. If prices can get above it YD's low should be a target. With the 10:00 news though it might find some difficulty doing that.
Click image for original size
sold 25.50 for air fill...agressive trade due to open type...will it be open , test and drive higher...not adding////will take loss if 26.50 prints before air fill
stop now at 26 even
Something odd since the first hour breakout is that TRIN has been trending higher which isn't what the bulls want to see.
Forming the H&S? Or can it hit that blue trendline for the downside?
To run higher would have to break all those lines and would become an obvious impulse. That's what I mean when I say that.
I'm thinking not breaking that 1117 level means this could have been a wave 2 decline. Not analyzing but it's just a fact by EW rules that it can't be a wave 2 if it breaks that.
1126 is your 50% retrace for that O/N wave down.
Still watching the same things mentioned yesterday. Stocks are strong so far today. Banks and MSFT, not so much.
Click image for original size
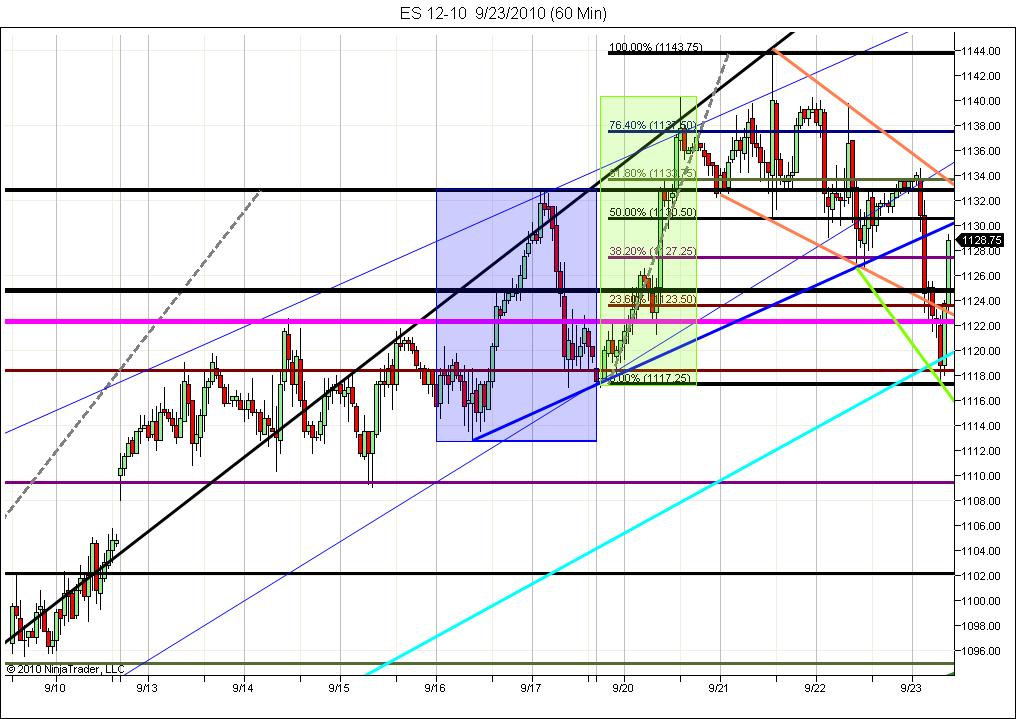
50% of the RTH week = 32.50
Emini Day Trading /
Daily Notes /
Forecast /
Economic Events /
Search /
Terms and Conditions /
Disclaimer /
Books /
Online Books /
Site Map /
Contact /
Privacy Policy /
Links /
About /
Day Trading Forum /
Investment Calculators /
Pivot Point Calculator /
Market Profile Generator /
Fibonacci Calculator /
Mailing List /
Advertise Here /
Articles /
Financial Terms /
Brokers /
Software /
Holidays /
Stock Split Calendar /
Mortgage Calculator /
Donate
Copyright © 2004-2023, MyPivots. All rights reserved.
Copyright © 2004-2023, MyPivots. All rights reserved.