ES Short Term Trading 9-24-10
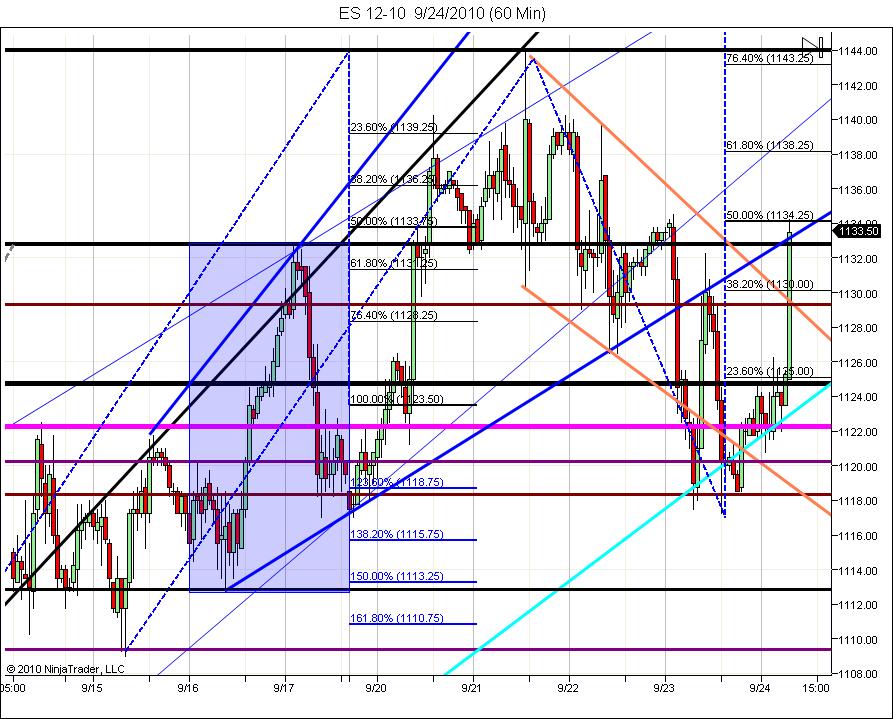
Already broke yesterdays high and my downtrend line quickly.. Things like this can happen when you don't break 1117.
Thick black line at 1124.75 is the former high previously known as 1129 on the old contract.I think we all know the other levels. 1100 or 1160?
Thick black line at 1124.75 is the former high previously known as 1129 on the old contract.I think we all know the other levels. 1100 or 1160?
Click image for original size
Oh, it can get a lot further apart than that. Many are calling for S&P 150, or 350-400, and so on. That's a bit more apart...
Originally posted by redsixspeed
O.K. we made it thru eom,Ben and the #s...my support zone so far is holding...first of the month this is the best chance to head back up to zone 1163.25/1167.50
I saw a post today to a link for a guy named Mr. Top Step..this
guy and myself could not be further apart on what we think is
going to happen...he said a possible move down to 1100.00
I been calling 1163.25...can't get much more apart than that
I'am running out of time...was looking to be up there by Friday
No, I never hold long period of time...I day trade the move inside
the larger move on my matrix...I think a move down is coming as well
what I have been saying in this topic is IMO the move down will not
come until we hit the next zone up...this would mean folks should
have been buying the pull backs...as far as going to 300 150 whatever,
when I said we were far apart I was talking about that one particular
trader and myself
Friday close was above the 1140 which is the top of the zone it also closed above 1141 a key # for me...this was a weekly close as well so I am still looking for more up...gotta have a plan..
Originally posted by redsixspeed
Friday close was above the 1140 which is the top of the zone it also closed above 1141 a key # for me...this was a weekly close as well so I am still looking for more up...gotta have a plan..
====================================================================
We made it to zone 1163.25/1167.50..this area is hit 80% 0f
the time...the next zone above is 1176.00/1180.00 and is hit
90% of the time....I view these as giant magnets...we seem
to have stalled at these areas...some say a reversal is near.
Its one thing to see a cluster of #s in an area...but if I know
how often the area is hit I have a better idea of market direction
Emini Day Trading /
Daily Notes /
Forecast /
Economic Events /
Search /
Terms and Conditions /
Disclaimer /
Books /
Online Books /
Site Map /
Contact /
Privacy Policy /
Links /
About /
Day Trading Forum /
Investment Calculators /
Pivot Point Calculator /
Market Profile Generator /
Fibonacci Calculator /
Mailing List /
Advertise Here /
Articles /
Financial Terms /
Brokers /
Software /
Holidays /
Stock Split Calendar /
Mortgage Calculator /
Donate
Copyright © 2004-2023, MyPivots. All rights reserved.
Copyright © 2004-2023, MyPivots. All rights reserved.