es short term 10-5-10
biggest thing to watch is if volume comes in above YD RTH high trspping shorts...otherwise they will drift it back to the 41.50 magnet.....
above is 46.75 and that old micro gap at 49.75...we are still
connsolidating...I'd be surprised if 41.50 doesn't print in RTH today
Report at 10 am...good volume at 39 area so the 39 - 41.50 will be key support and O/N air pocket there
above is 46.75 and that old micro gap at 49.75...we are still
connsolidating...I'd be surprised if 41.50 doesn't print in RTH today
Report at 10 am...good volume at 39 area so the 39 - 41.50 will be key support and O/N air pocket there
53.5 now S/R
right now is natural time for pullback because price has tested last week's H (RTH H 53.50) and BTW, price tested last week's Low (72.25 RTH) yesterday and buyers stopped the decli9ne in prices)
Large unfilled gaps (if they remain unfilled and this one certainly looks like it will remain unfilled to me) can often see a run-up at the end of the day (after 3:15, but can start as early as 3:00) when shorts who have not covered get a final squeeze from their bullish brethren.
would doubt a strong leg up late in the day if 50% of today's range is broken by more than 3 pts.
50% is currently 48.35. 48.25 - 3 = 45.25
if 45.25 prints and buyers do not come swooping in, then chaos can ensue
Sometimes on trend day like this, overnight range added to Open can give an area of likely resistance
O/N rng = 12 pts, Plus open of 43.25 = 55.25
considering 3 points can swing at anytime without real reason (3 pts is noise), upside could be 58.25
this info and a billion dollars would make me a millionaire.
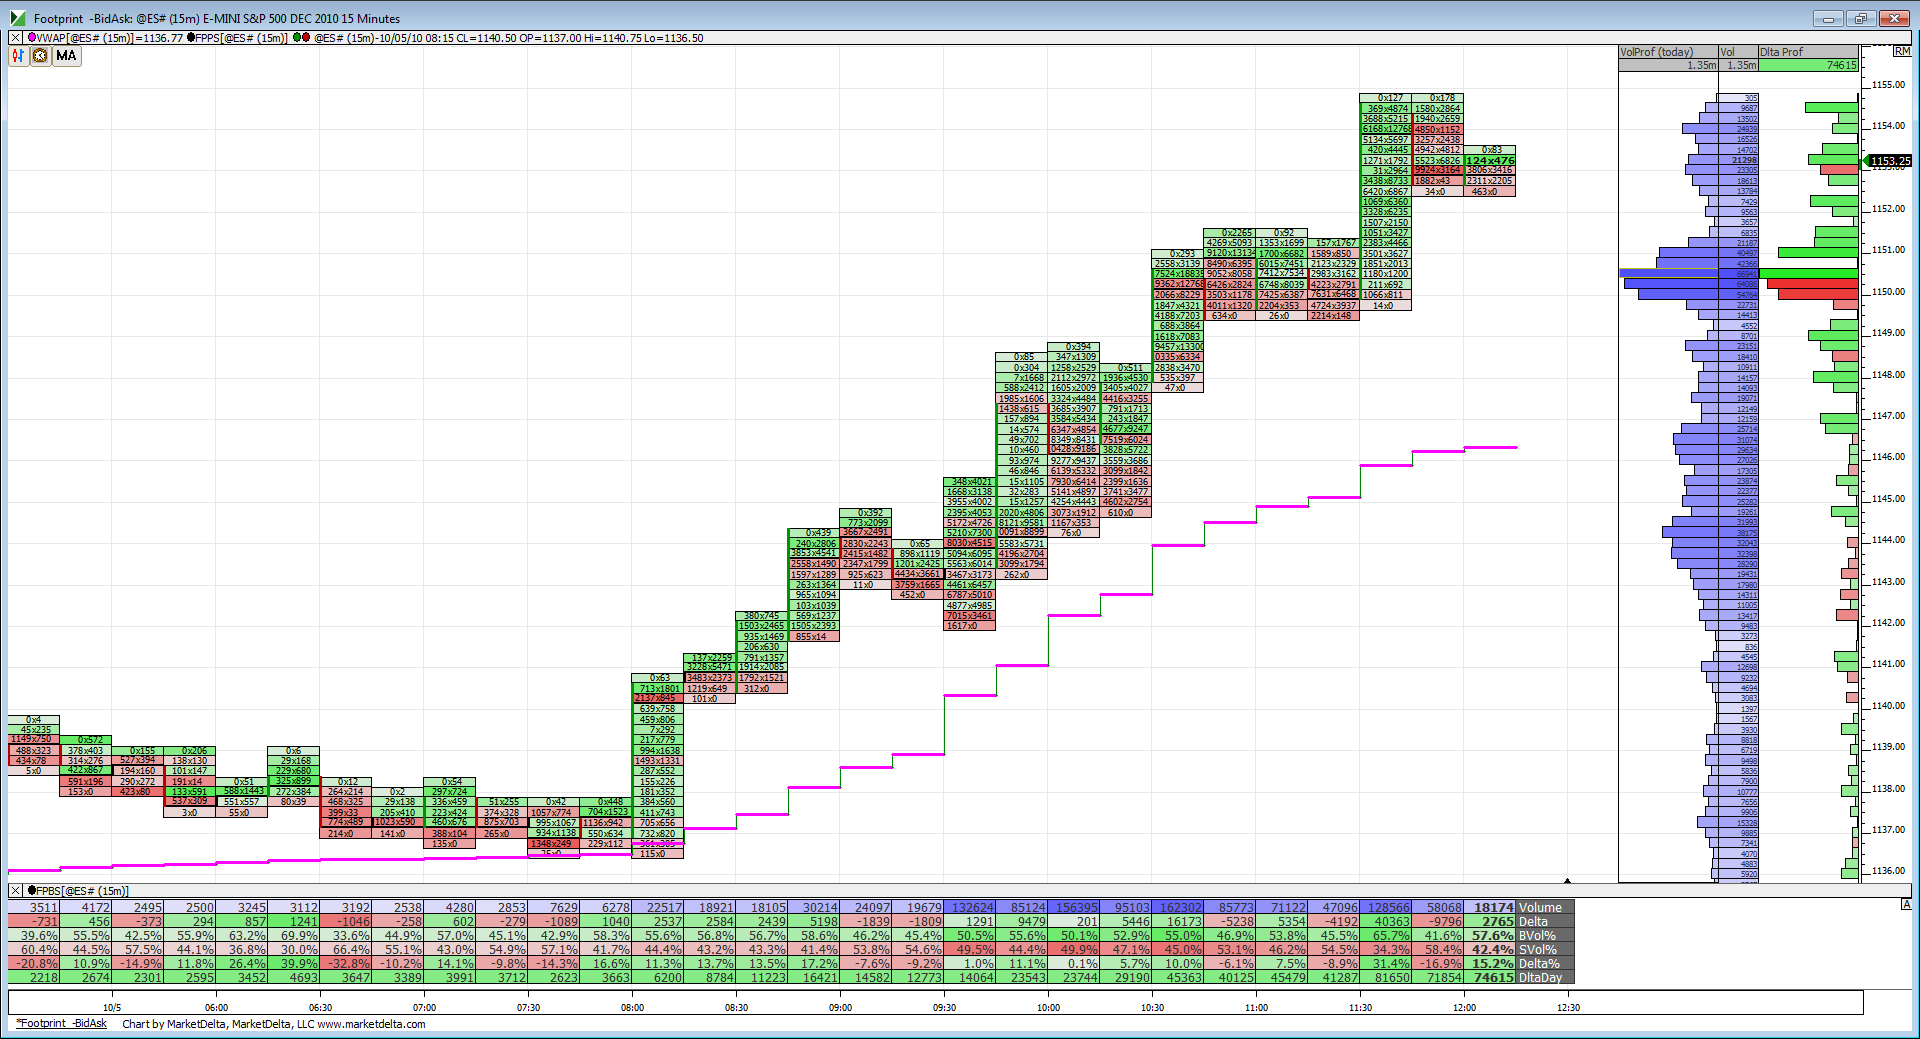
Just getting into the office. Interesting morning indeed. Look at that stair stepping VWAP climb. And check out that volume bulge in the 1050-1051 area. Should be first real support test if a pullback ensues over the lunch break.
Click image for original size
lol.....have you ever considered making a small fortune in farming? You need to start with a large fortune!
Originally posted by PAUL9
this info and a billion dollars would make me a millionaire.
wow Lorn, have you ever thought about using your figures on the left side of your chart for Elliott interpretation?
Originally posted by Lorn
Just getting into the office. Interesting morning indeed. Look at that stair stepping VWAP climb. And check out that volume bulge in the 1050-1051 area. Should be first real support test if a pullback ensues over the lunch break.
Click image for original size
hehe...it does appear to show some clear looking waves heh?
Originally posted by DavidS
wow Lorn, have you ever thought about using your figures on the left side of your chart for Elliott interpretation?Originally posted by Lorn
Just getting into the office. Interesting morning indeed. Look at that stair stepping VWAP climb. And check out that volume bulge in the 1050-1051 area. Should be first real support test if a pullback ensues over the lunch break.
impulse wave from O/N low
I was thinking the same thing the other day and forgot to ask Lorn -- It does looks like it could work, the question is: How consistent is it?
Originally posted by DavidS
wow Lorn, have you ever thought about using your figures on the left side of your chart for Elliott interpretation?Originally posted by Lorn
Just getting into the office. Interesting morning indeed. Look at that stair stepping VWAP climb. And check out that volume bulge in the 1050-1051 area. Should be first real support test if a pullback ensues over the lunch break.
Click image for original size

Consistency in wave counting is a very tricky subject imo. Everyone has an opinion on how to do it best.
Wave counting is an art form. The only mechanical part in it are the three rules.
Wave counting is an art form. The only mechanical part in it are the three rules.
Originally posted by i1hunter
I was thinking the same thing the other day and forgot to ask Lorn -- It does looks like it could work, the question is: How consistent is it?
new 10 and 20 day highs in S&P and advancers over decliners somewhere close to 6 to 1.....huge closing $tick...doesn't seem that there can be much power left for a big move tomorrow UP...
keys for me are 56.50, 51.50 and 46.50....a run above highs will try for the 61 - 63 area but not expecting that...hopefully just a slow drift down..
keys for me are 56.50, 51.50 and 46.50....a run above highs will try for the 61 - 63 area but not expecting that...hopefully just a slow drift down..
Emini Day Trading /
Daily Notes /
Forecast /
Economic Events /
Search /
Terms and Conditions /
Disclaimer /
Books /
Online Books /
Site Map /
Contact /
Privacy Policy /
Links /
About /
Day Trading Forum /
Investment Calculators /
Pivot Point Calculator /
Market Profile Generator /
Fibonacci Calculator /
Mailing List /
Advertise Here /
Articles /
Financial Terms /
Brokers /
Software /
Holidays /
Stock Split Calendar /
Mortgage Calculator /
Donate
Copyright © 2004-2023, MyPivots. All rights reserved.
Copyright © 2004-2023, MyPivots. All rights reserved.