ES short-term trading 10-6-10
Here is an historical study that (IMHO) is worth tracking and its "set-up" might be realized today.
I've related that I get the gap-guys free videos (I don't subscribe and I don't necessarilly trade opening gaps) but I do like to see what he has to say about the daily bars and he does provide technical historical studies that are pure data.
Last week he published a study that looked at Gap Up openings where the Open was a new 40 trading day H. Incredibly, historically, 82% of these gaps fill on the same day.
This happened on Thursday, 9-30-10 and that gap filled.
If today, Wed, 10-06-10 opens above 1158.75, that would be a gap open at a new 40 trade day High.
I operate from what I consider to be a safe reality when it comes to forecasts,considerations, and predictions. It's not my goal to be right,but to trade with some amount of safety and wisdom along the patterns.
If you've been reading my posts here for any length of time I hope that has become at least a little evident.
I bring this up as from the July lows we ascended twice now and are at the usual level of completion for a C wave,1160(1137 was the minimum).
I don't know if it is a C wave. Could be wave a 3rd wave? I just know that from this point I'll leave it at that. From 1160,which just hit and reversed,anything is possible. Complete reversal? 1250?
I would prefer higher, but that's not guranteeed from my analysis.
A C wave can extend. A 3rd wave will lead to a 4th wave. Here we are.
Are we done here is the question?
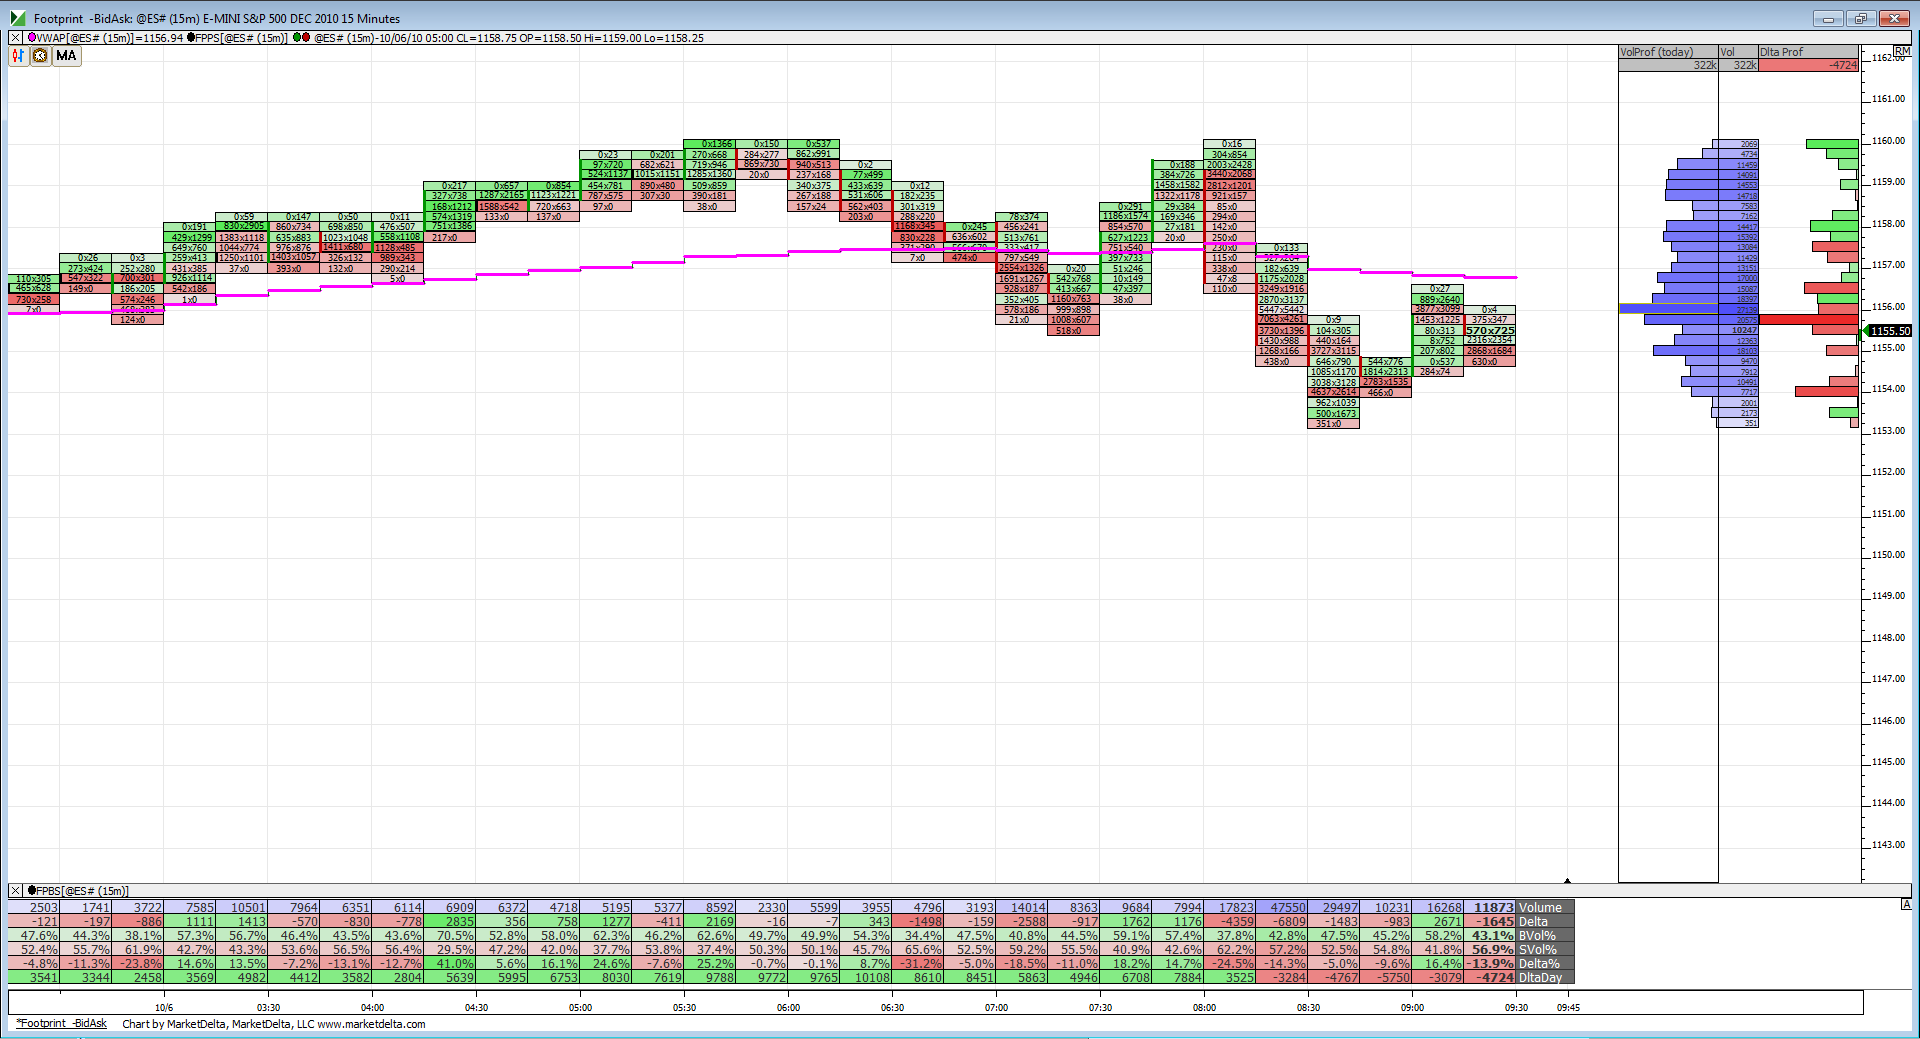
because of where we traded in the O/N I'm still using the following:
1161 -1163
1156 ********ON midpoint now TOO
1150 -1151 key number and air pocket
I'm hoping they pop it up so we can get better shorts working on the open.....this SHOULD be a fade the rallies type of day....consolidation day and the better traders ( not me ) will be get some good buys off drops too......Tick should work better today.
If you look at your volume yesterday ( 30 or 60 minute bars), all the heavy volume came in BEFORE the break of that key 1153.50 high ( last thursdays high) then it basically dried up except for the 4 PM close....so shorts are prefered
Don't forget, it's a MATD and may well be 2-sided trading (some kind of morning range bound activity) ... even on the heels of a breakout yday of consolidation on the daily chart. Just a heads up.
shorted 56 and will add higher if needed
1st add point will be 57.75 if it prints....targeting 53.75 now
any add ons above or at 57.75 will target 56 first as that is first initiation and key number
they trying for M pattern!!
Originally posted by MRamzan
where i can read more about technical indicators and what about the analysis that brokers provide ?
You can read about the indicators almost everywhere on the net.
Just place in Google terms like "technical indicators" "technical analysis indicators" "price action indicators", etc.
Brokers today (guilty as charged )have become sales people for software trading platforms. If you are a beginner maybe could you enjoy the benefit of working with a full service broker: http://www.optimusfutures.com/commodity-futures-phone-execution.htm
our chief broker is Chad, and he will provide you advice and research before the execution of any trade.
Emini Day Trading /
Daily Notes /
Forecast /
Economic Events /
Search /
Terms and Conditions /
Disclaimer /
Books /
Online Books /
Site Map /
Contact /
Privacy Policy /
Links /
About /
Day Trading Forum /
Investment Calculators /
Pivot Point Calculator /
Market Profile Generator /
Fibonacci Calculator /
Mailing List /
Advertise Here /
Articles /
Financial Terms /
Brokers /
Software /
Holidays /
Stock Split Calendar /
Mortgage Calculator /
Donate
Copyright © 2004-2023, MyPivots. All rights reserved.
Copyright © 2004-2023, MyPivots. All rights reserved.