MyPivots
Sign In
JA
jarek
Rep: 94
Posts: 3,474
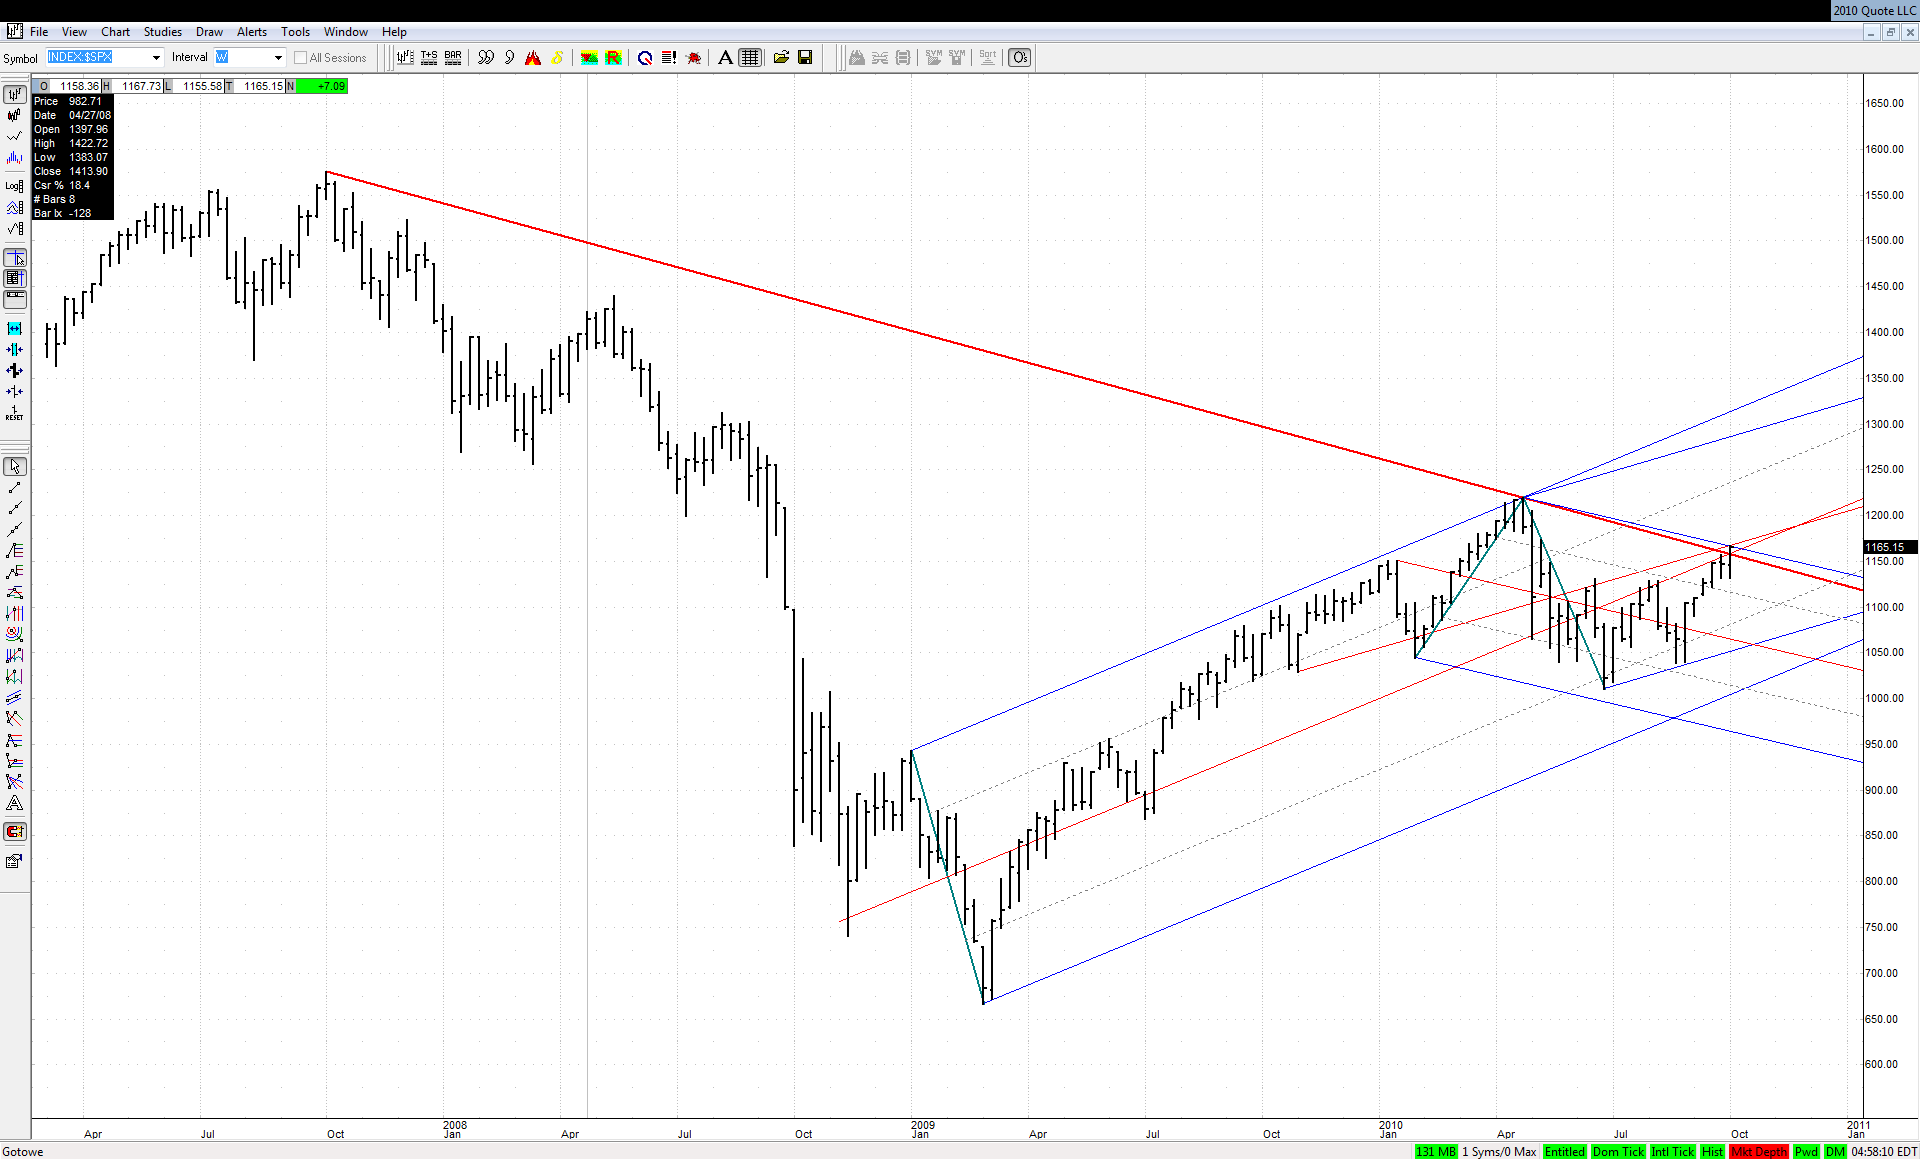
Here is the $SPX equivalent of our longer term bearish setup in ES:


Click image for original size
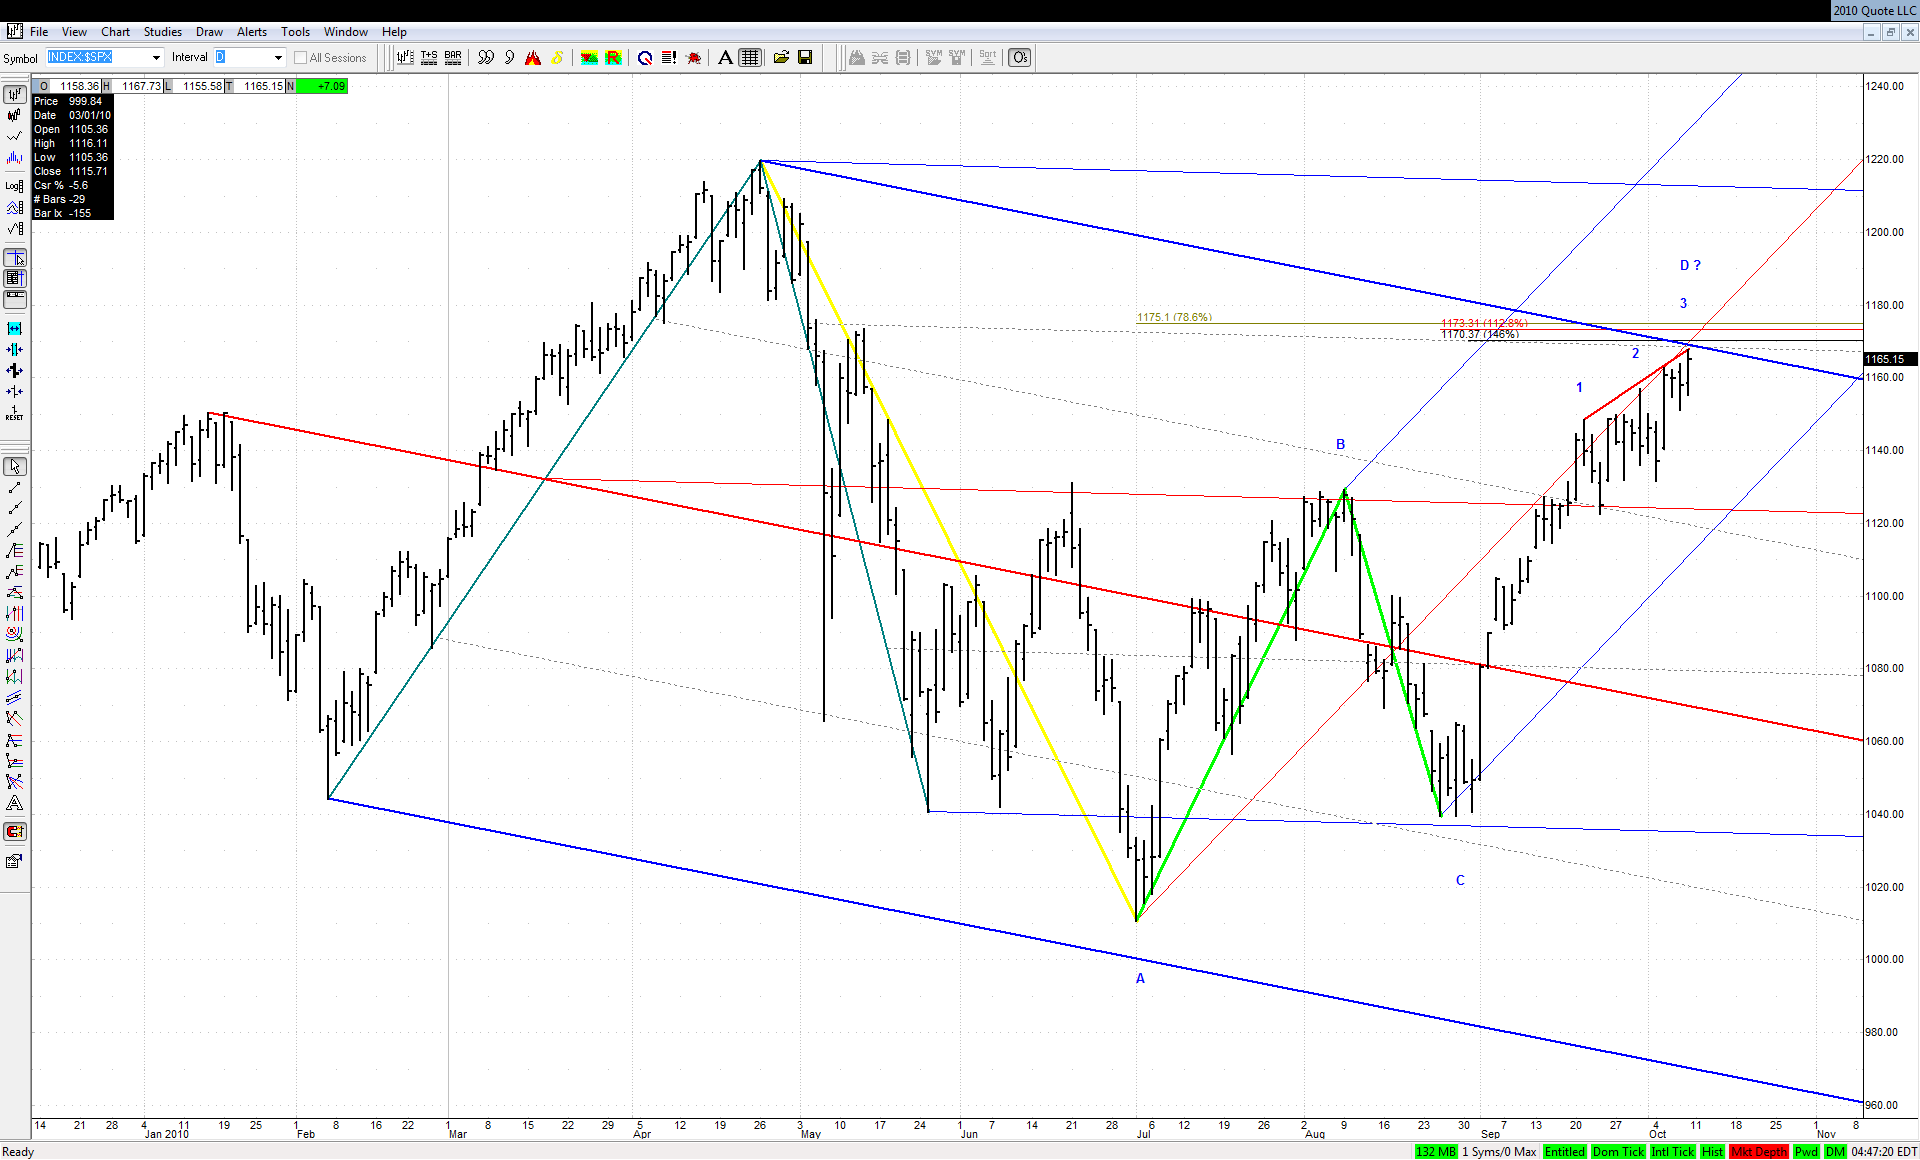


The importance of the current market position is even more visible here, because Friday's high was exactly at the upper ML of the downsloping set at what looks as a possible 3D at the spike line.
If this breaks to the upside than we should witness an acceleration of the upward move, since there is nothing but air above:


Click image for original size
JI
jimkane
Rep: 3,058
Posts: 33,089
Recall my areas for today, 80.75 and 84.25. The HOD on that last push was 81.00.
JA
jarek
Rep: 94
Posts: 3,474
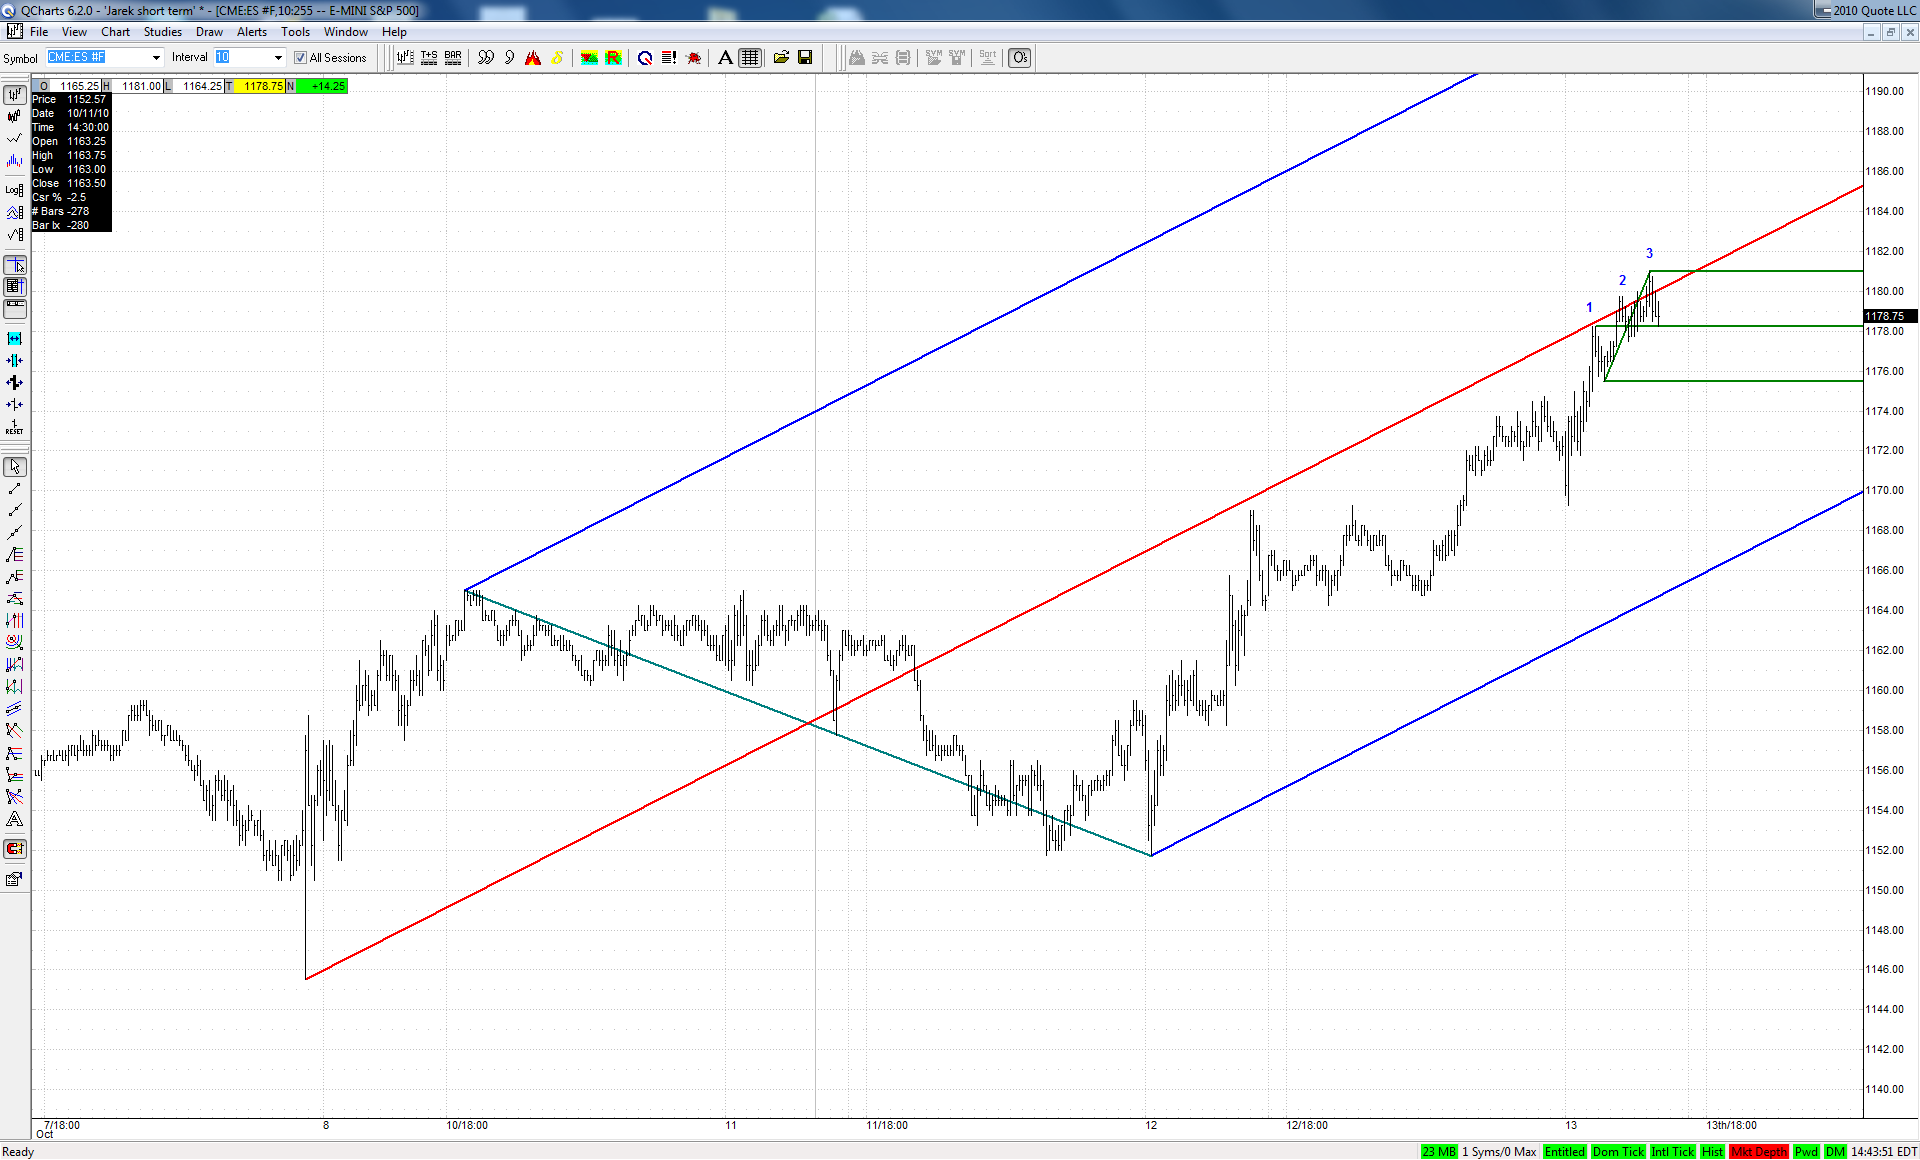
They have clear problems with taking this upsloping ML and a small 3D formed right at your first area. Green set target already met:


Click image for original size
JI
jimkane
Rep: 3,058
Posts: 33,089
If this breakout holds, here's my higher timeframe very broad and preliminary areas right now:

1245-1275

1330-1350 (maybe as low as 1315)

1455-1480

I think the primary area is the middle one, for now. I'd say that is what they have in mind. Can they do about 150 points in just under three weeks, say 14 trading days? That would be around 10 points per day average for almost three weeks. Throw in maybe three +30 days, and it would only need to do 5 points average per day for the remaining 11 days. That does sound doable. Who knows. Maybe it will react here, or struggle to just get to the highs. I don't really care, I just look for setups. I'm just pointing out technical areas and looking at scenarios these maniacs may use.
JI
jimkane
Rep: 3,058
Posts: 33,089
And, as much as I hate to admit it, I am short side bias intraday in here, but 99.999999% sure it will rise and not offer much. But it is a spot too good to not accept.
JI
jimkane
Rep: 3,058
Posts: 33,089
Okay, watch the ABCD right here at 77.25 for clues to see if this short side bias is pure frivolity (insanity is probably a better term).
JA
jarek
Rep: 94
Posts: 3,474
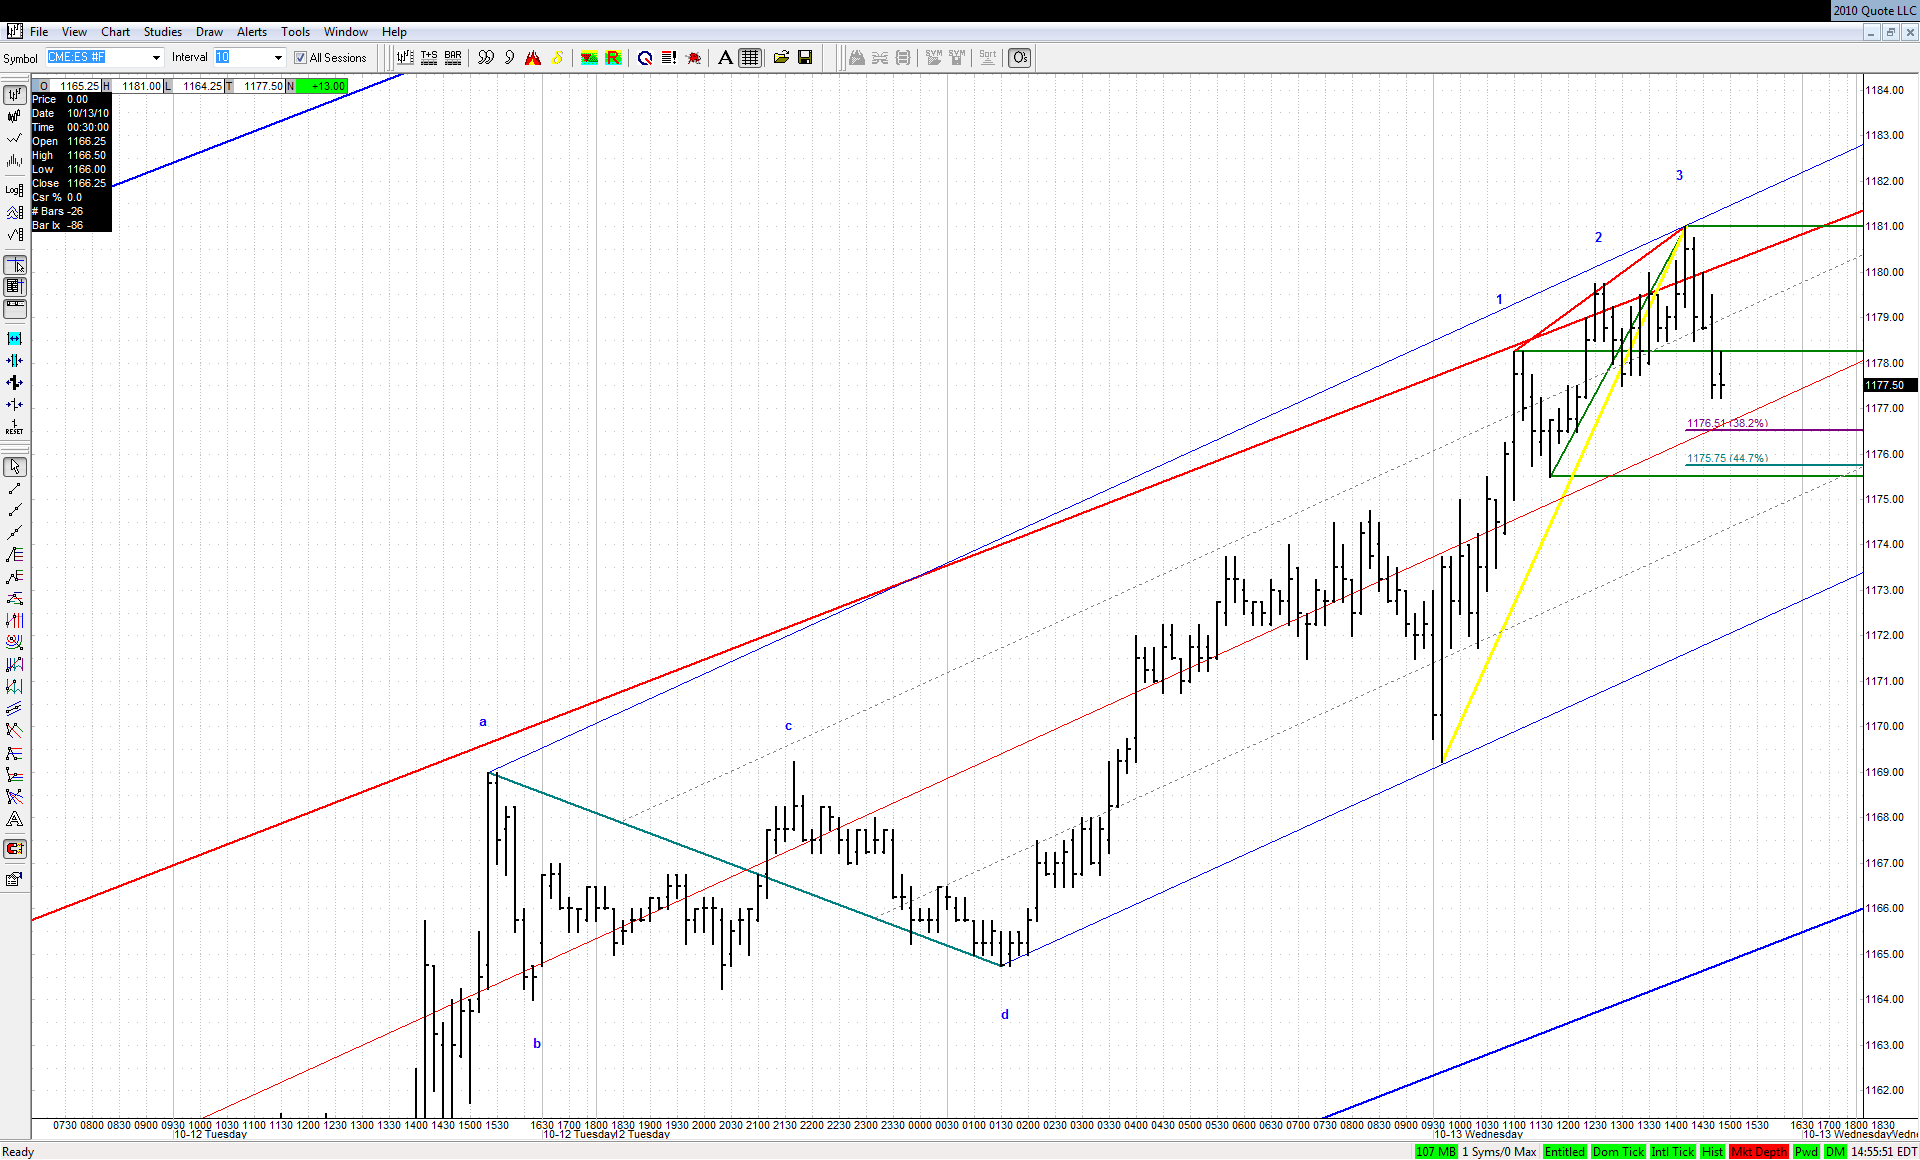
I'm looking at the following lines right now:


Click image for original size
JI
jimkane
Rep: 3,058
Posts: 33,089
Nice, jarek.

Notice the wicked bid in treasuries, likely some short-covering. I am curious to see how the market reacts now that the pit closed. Maybe straight up now off the ABCD? I'd prefer not.
JA
jarek
Rep: 94
Posts: 3,474
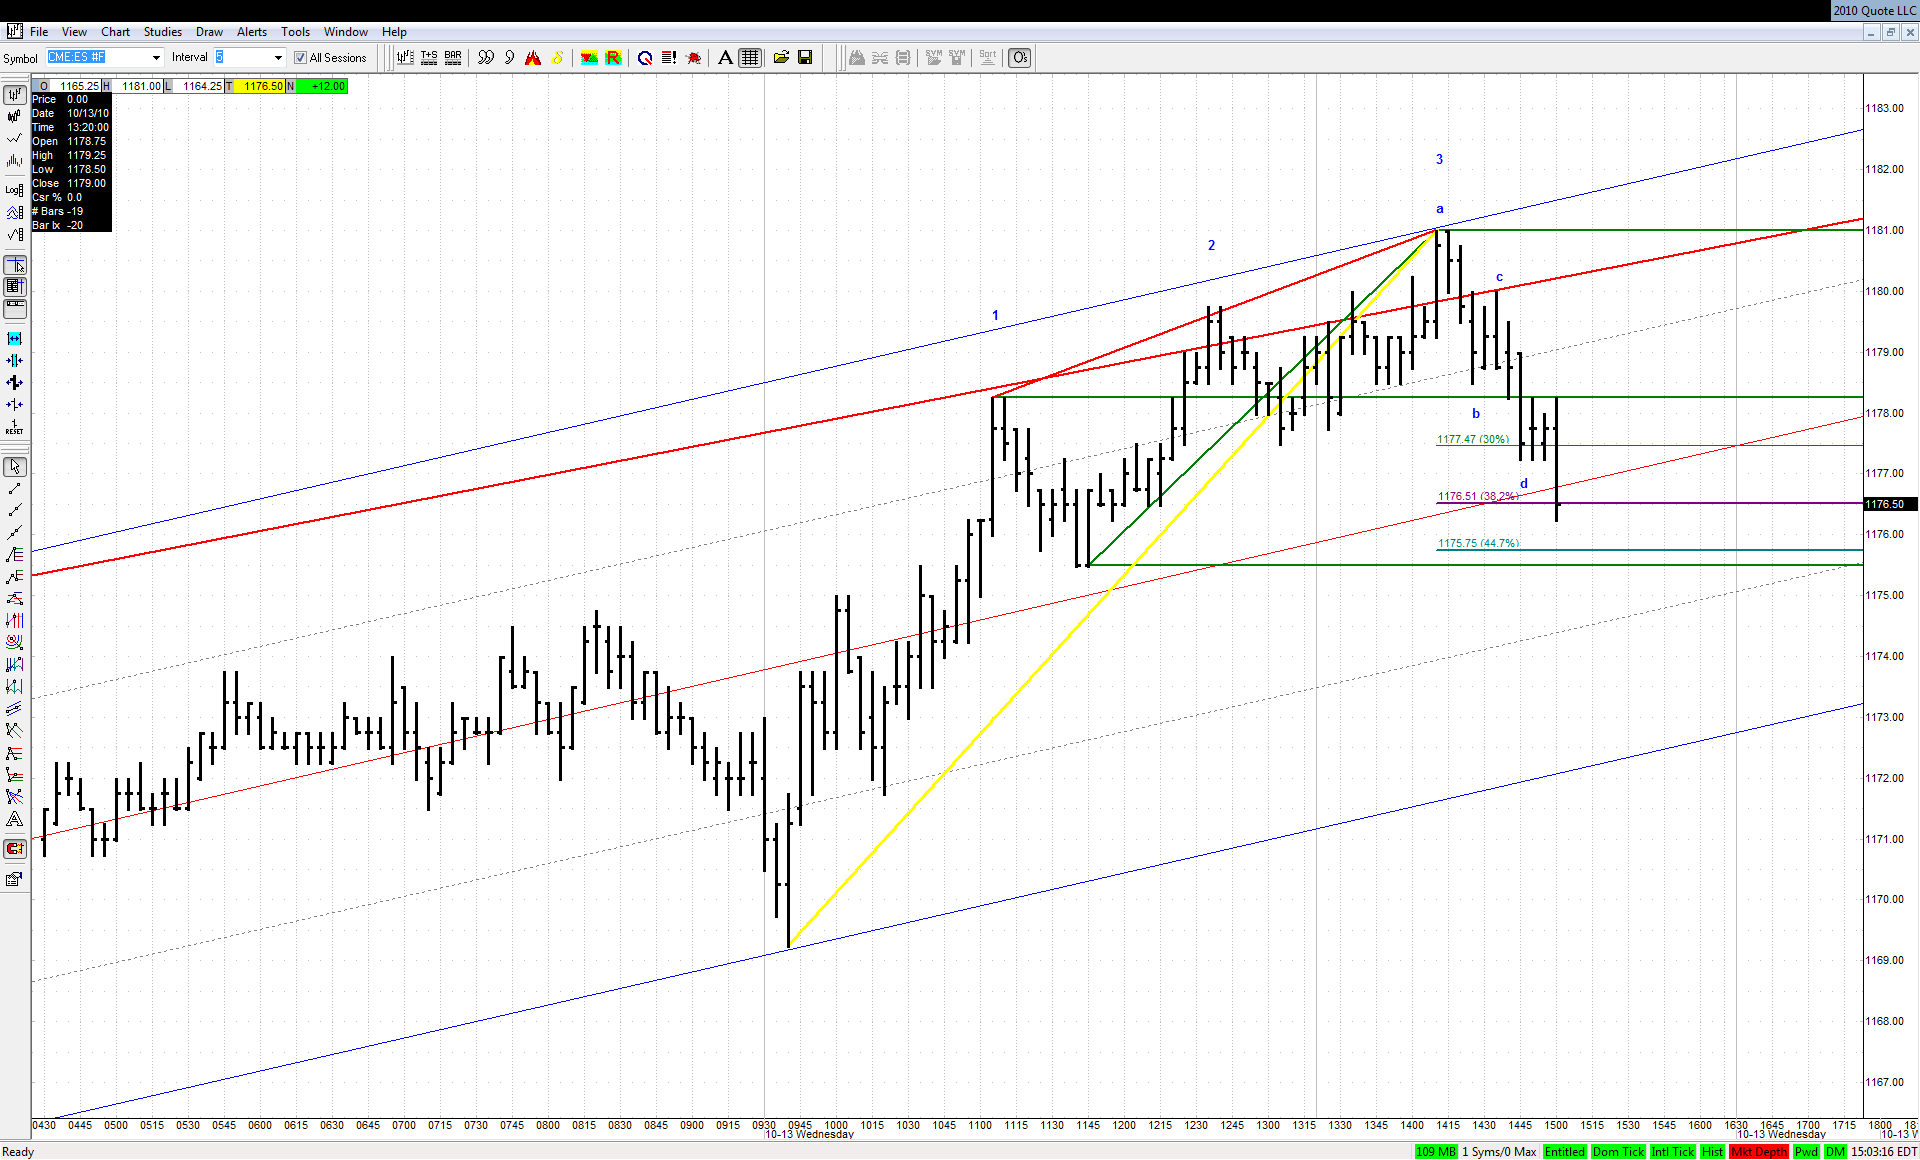
This .300 ABCD taken out decisively. The move off it looks like just a checkback of the green ML:


Click image for original size
JI
jimkane
Rep: 3,058
Posts: 33,089
jarek's area hit. Now we get some big-time clues. If it doesn't jump off his area, watch out below.
JI
jimkane
Rep: 3,058
Posts: 33,089
Likely that's it, and it was more than I expected. But, my next area below is 73.75-74.75, and then it has a lot of air. We'll see. Going to 'let it breathe' and see what it does.
JI
jimkane
Rep: 3,058
Posts: 33,089
And there's the close, 75.50 was the high. I'd still say that's close enough, it finished a lot closer to my area than any other place it could have finished. And followed the lines almost like a script. Oh, and BTW, that was a positive close for the ES.