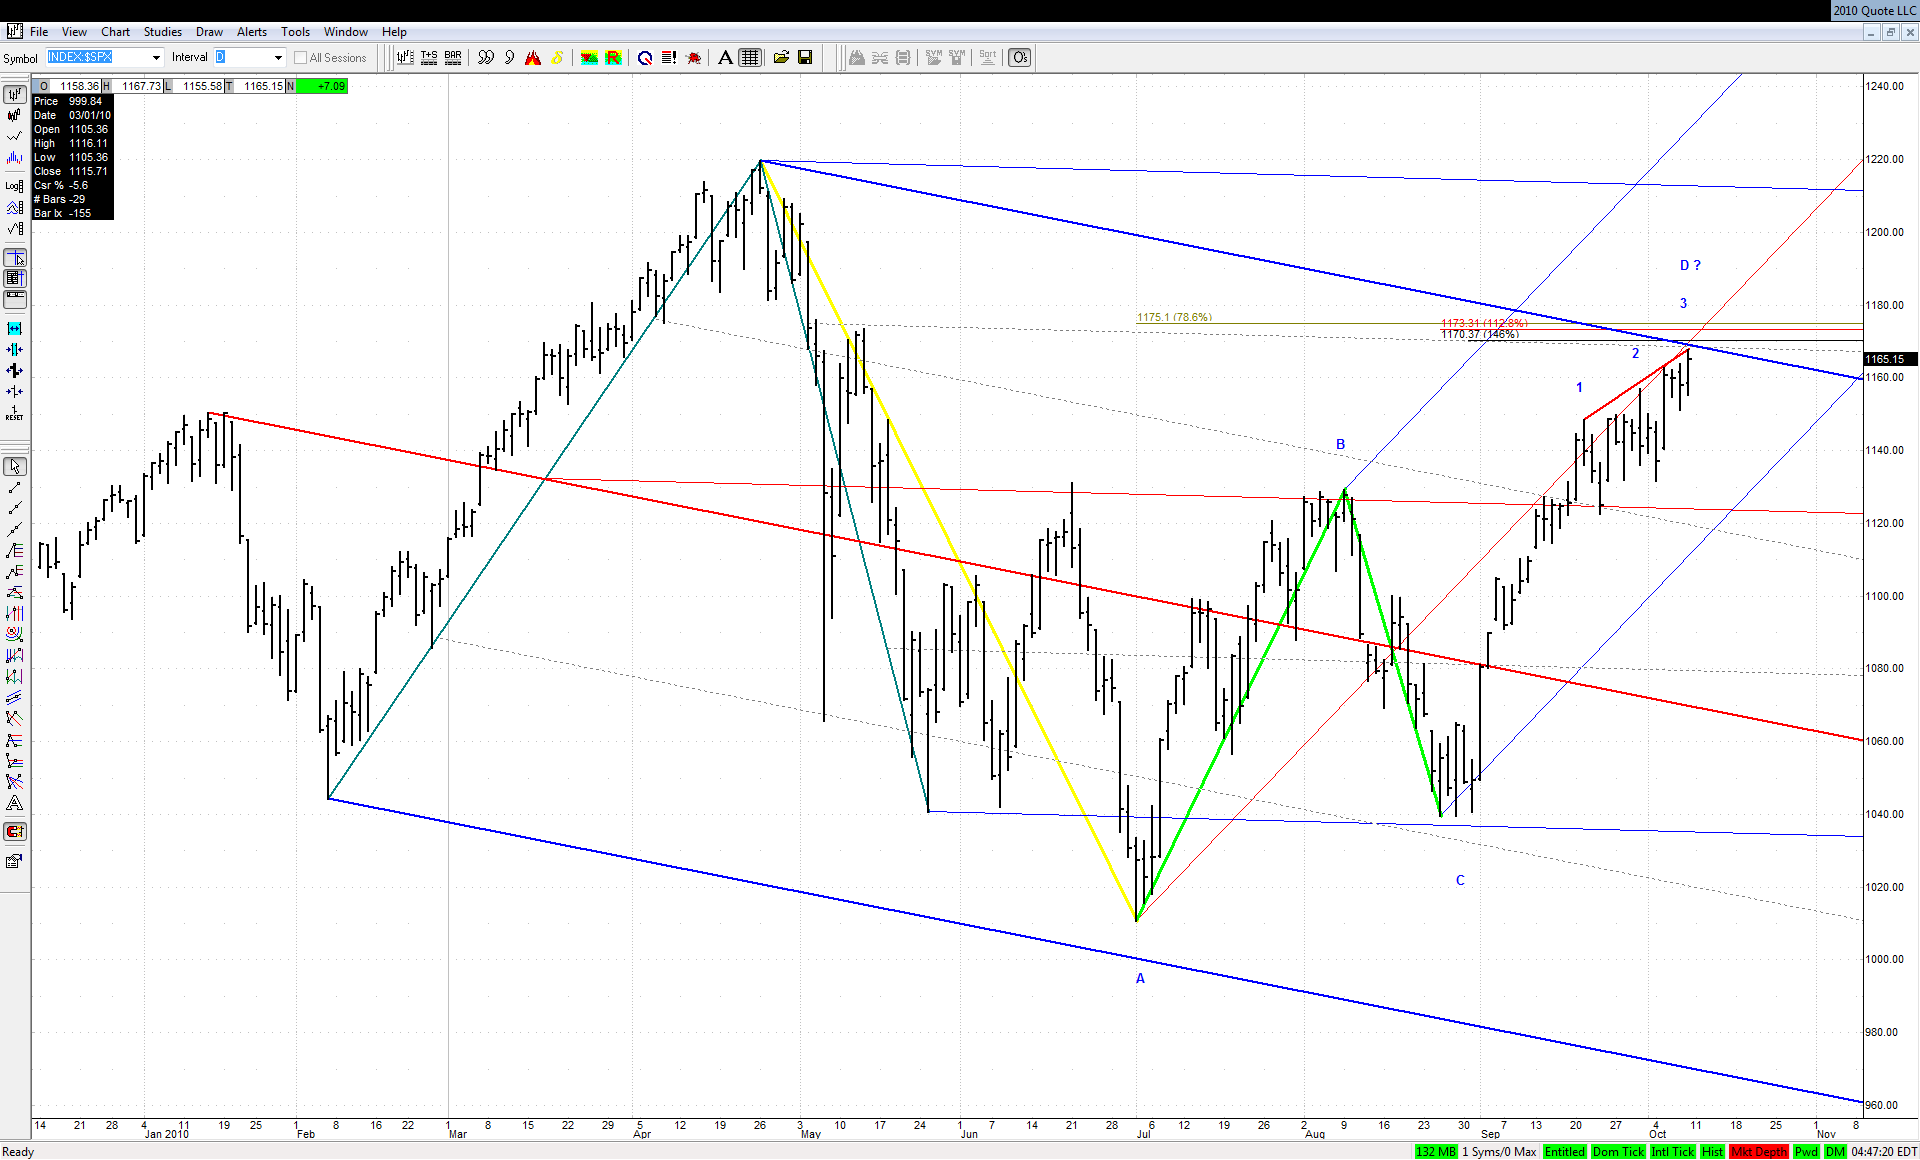
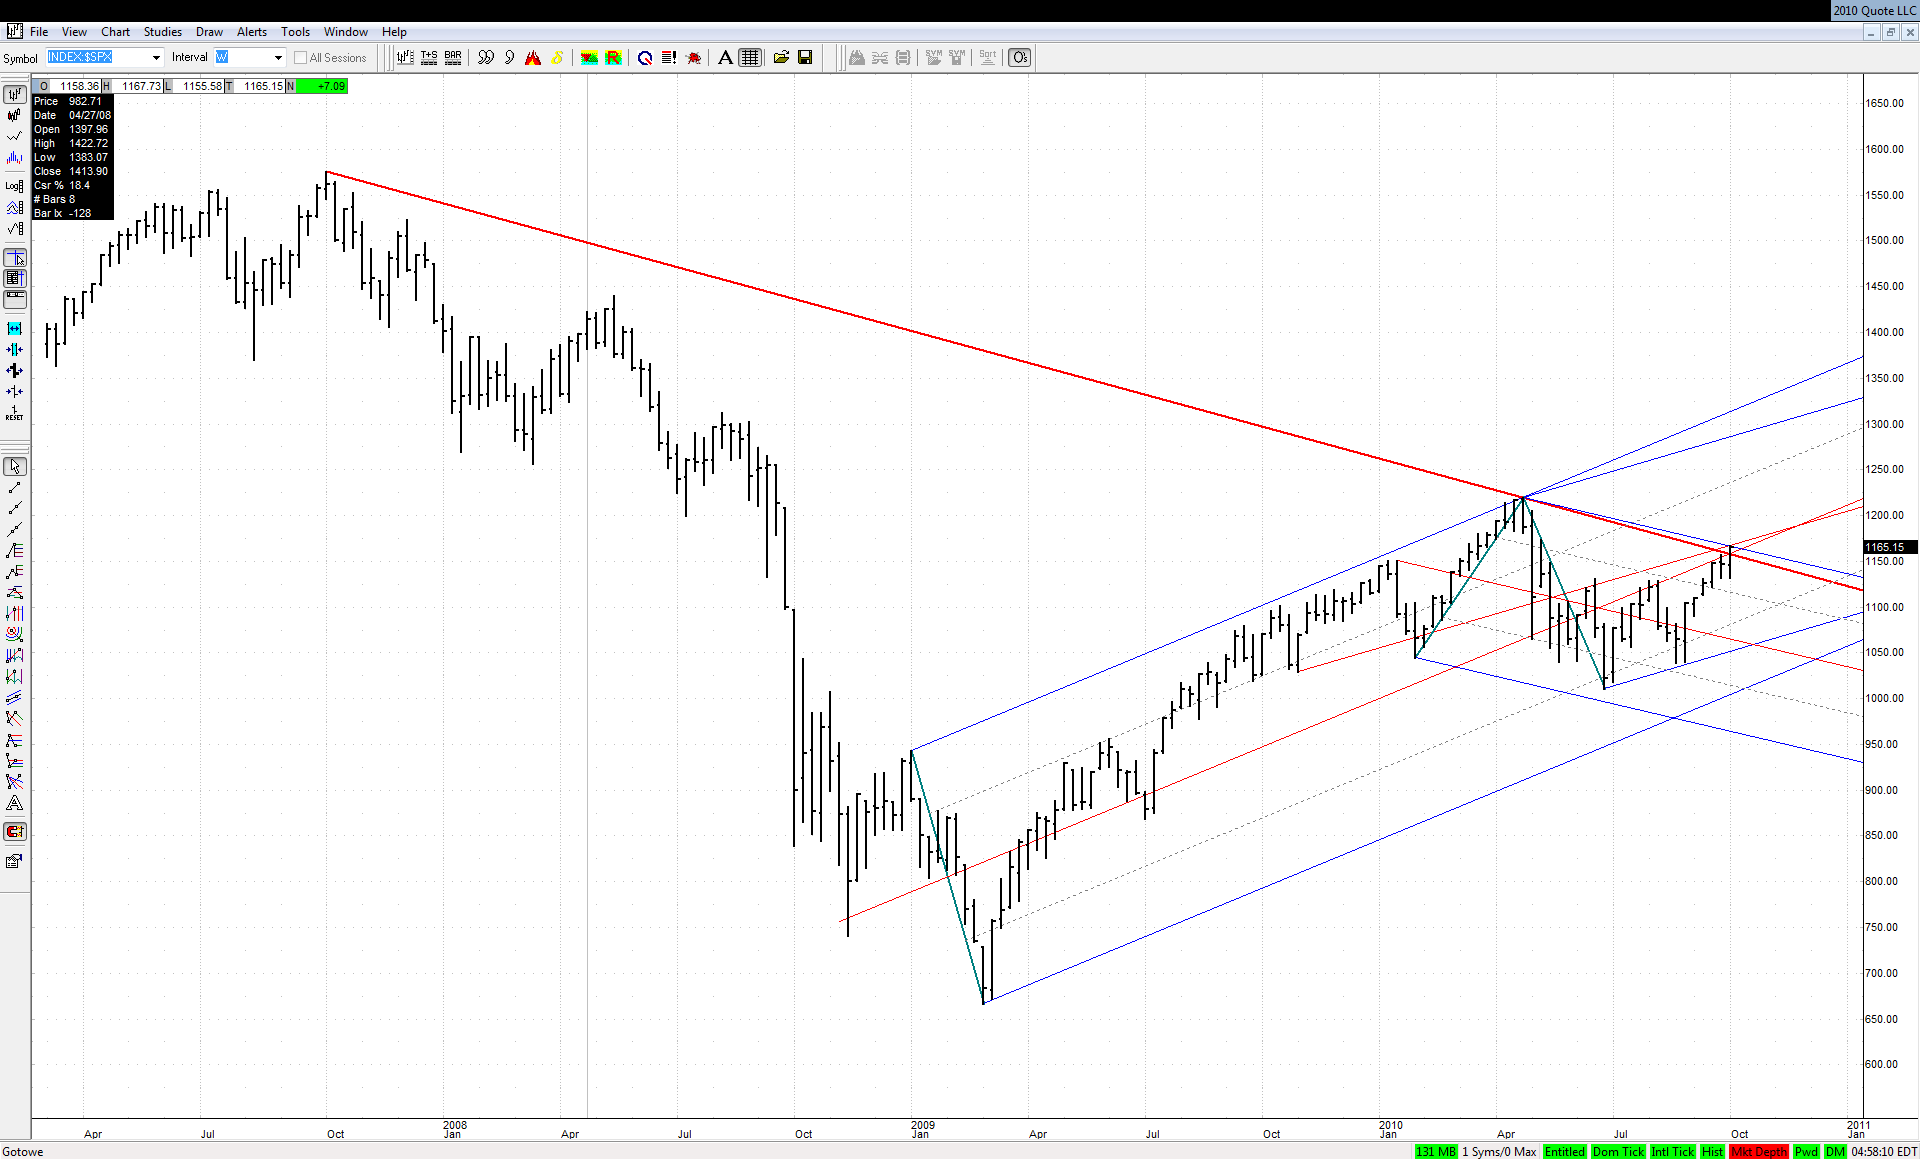
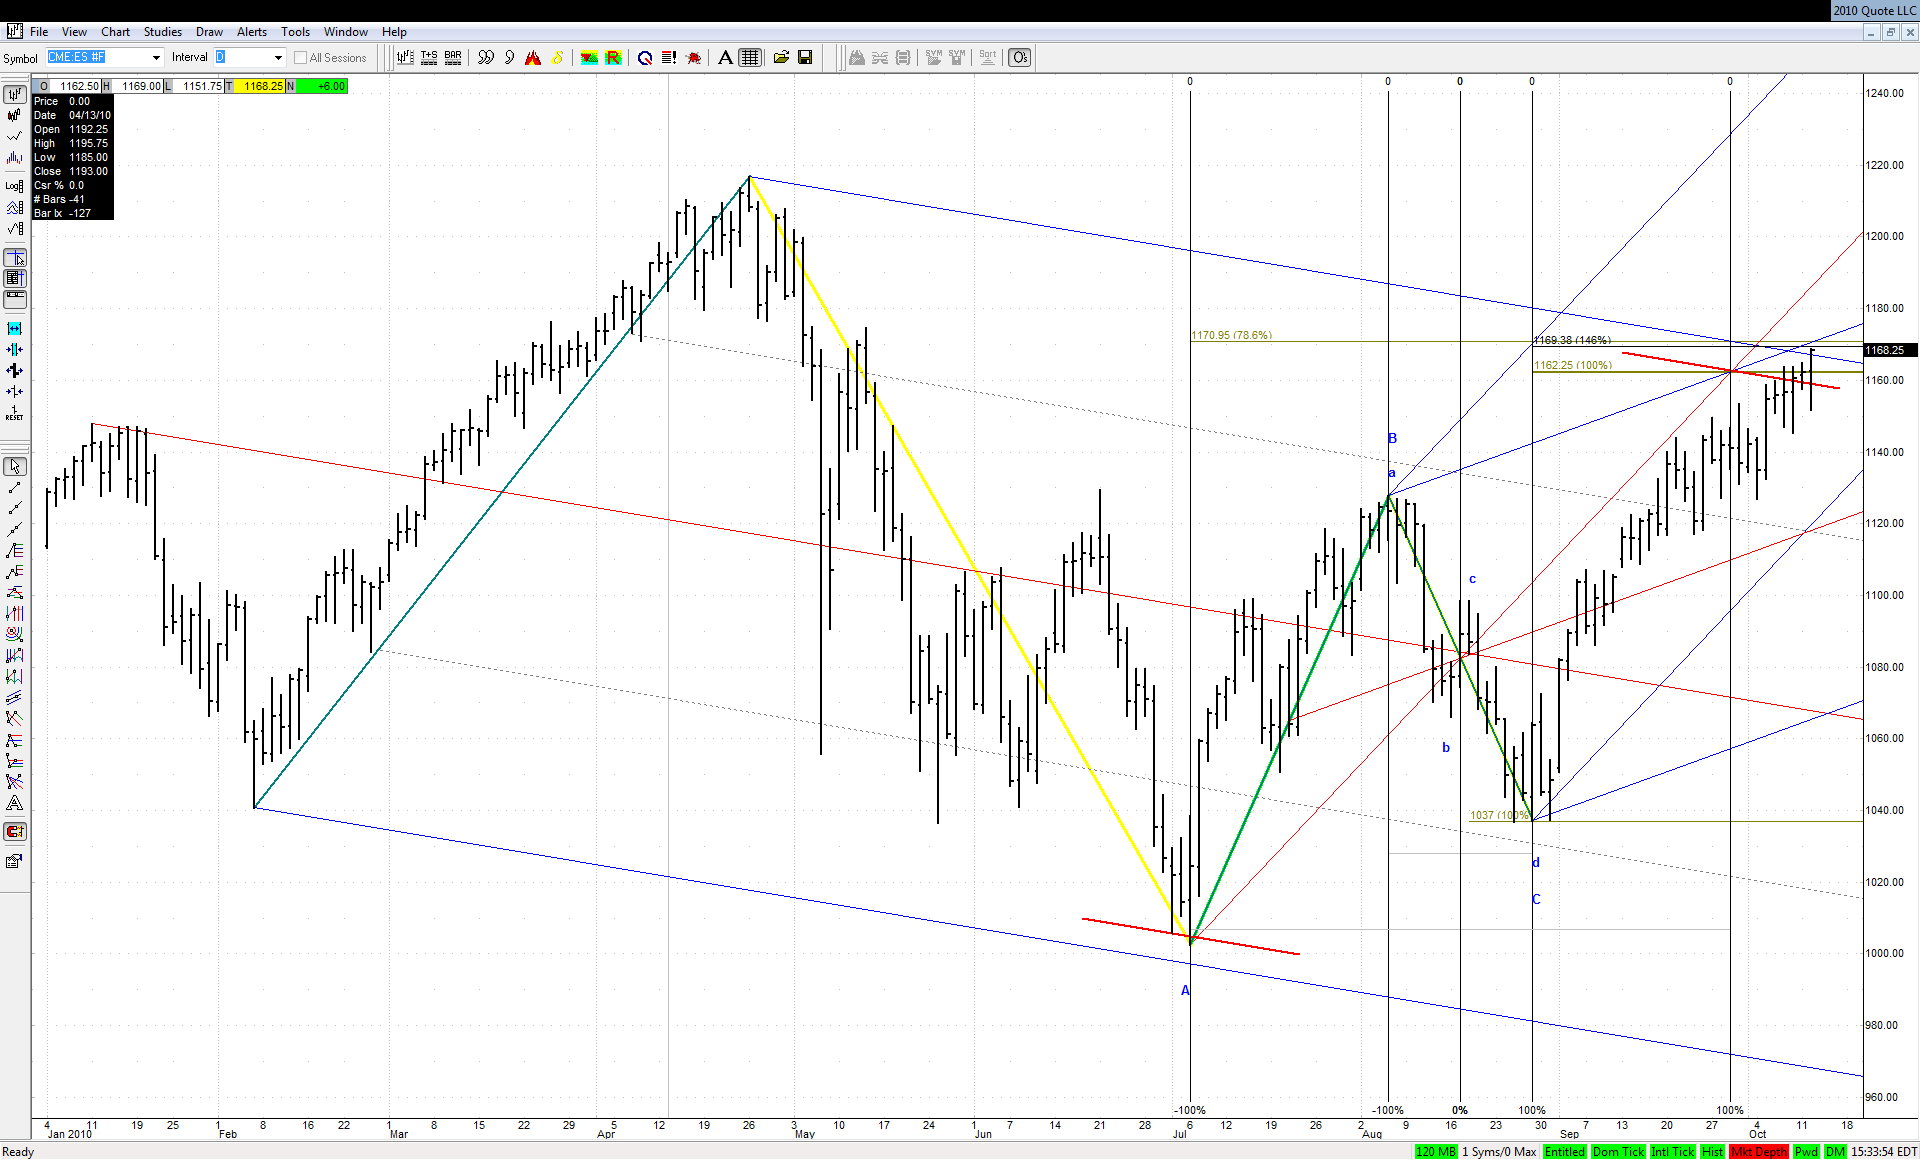
Here is the $SPX equivalent of our longer term bearish setup in ES:
The importance of the current market position is even more visible here, because Friday's high was exactly at the upper ML of the downsloping set at what looks as a possible 3D at the spike line.
If this breaks to the upside than we should witness an acceleration of the upward move, since there is nothing but air above:
JI
jimkane
Rep: 3,058
Posts: 33,089
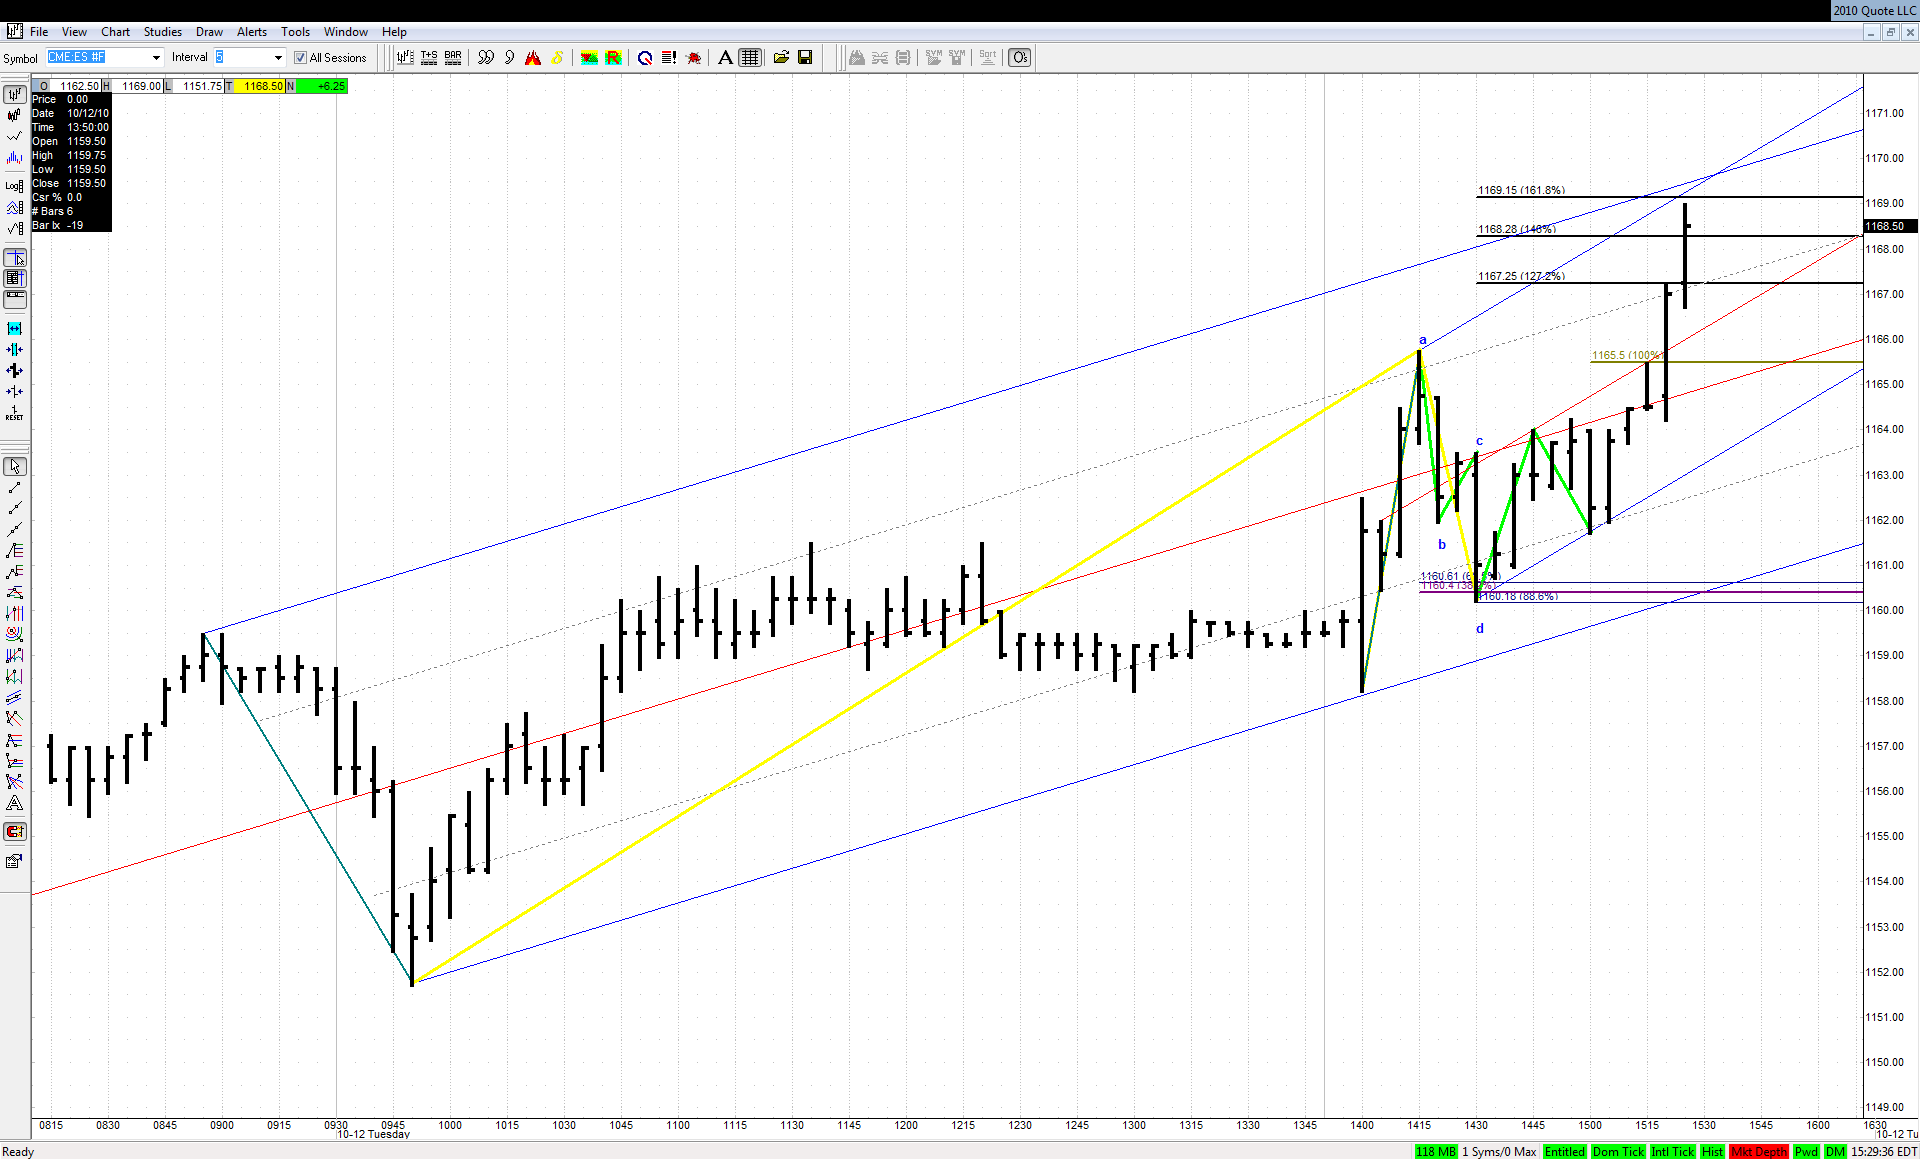
Let's see if they check it back at all here, or just drive right to that 68.50. And since they are doing this so fast, will that even slow it down?
JI
jimkane
Rep: 3,058
Posts: 33,089
68.50. Here's my surprised look. In case you can't see it, it looks identical to my normal expression.
JI
jimkane
Rep: 3,058
Posts: 33,089
Now, if this doesn't slow it down, the next area I'd think they'd want to stretch for would be 71.75-72. Keep in mind, this is just information I'm considering for management purposes, not to necessarily get short against.
JI
jimkane
Rep: 3,058
Posts: 33,089
Nice chart, jarek. So, you can see what my reasoning was, for a play and for management areas in general.
JI
jimkane
Rep: 3,058
Posts: 33,089
Pullback launchpoint for a move to the 72 area, or will they just be happy with what they did and chop until close?