MyPivots
Sign In
JA
jarek
Rep: 94
Posts: 3,474
Here is the $SPX equivalent of our longer term bearish setup in ES:


Click image for original size
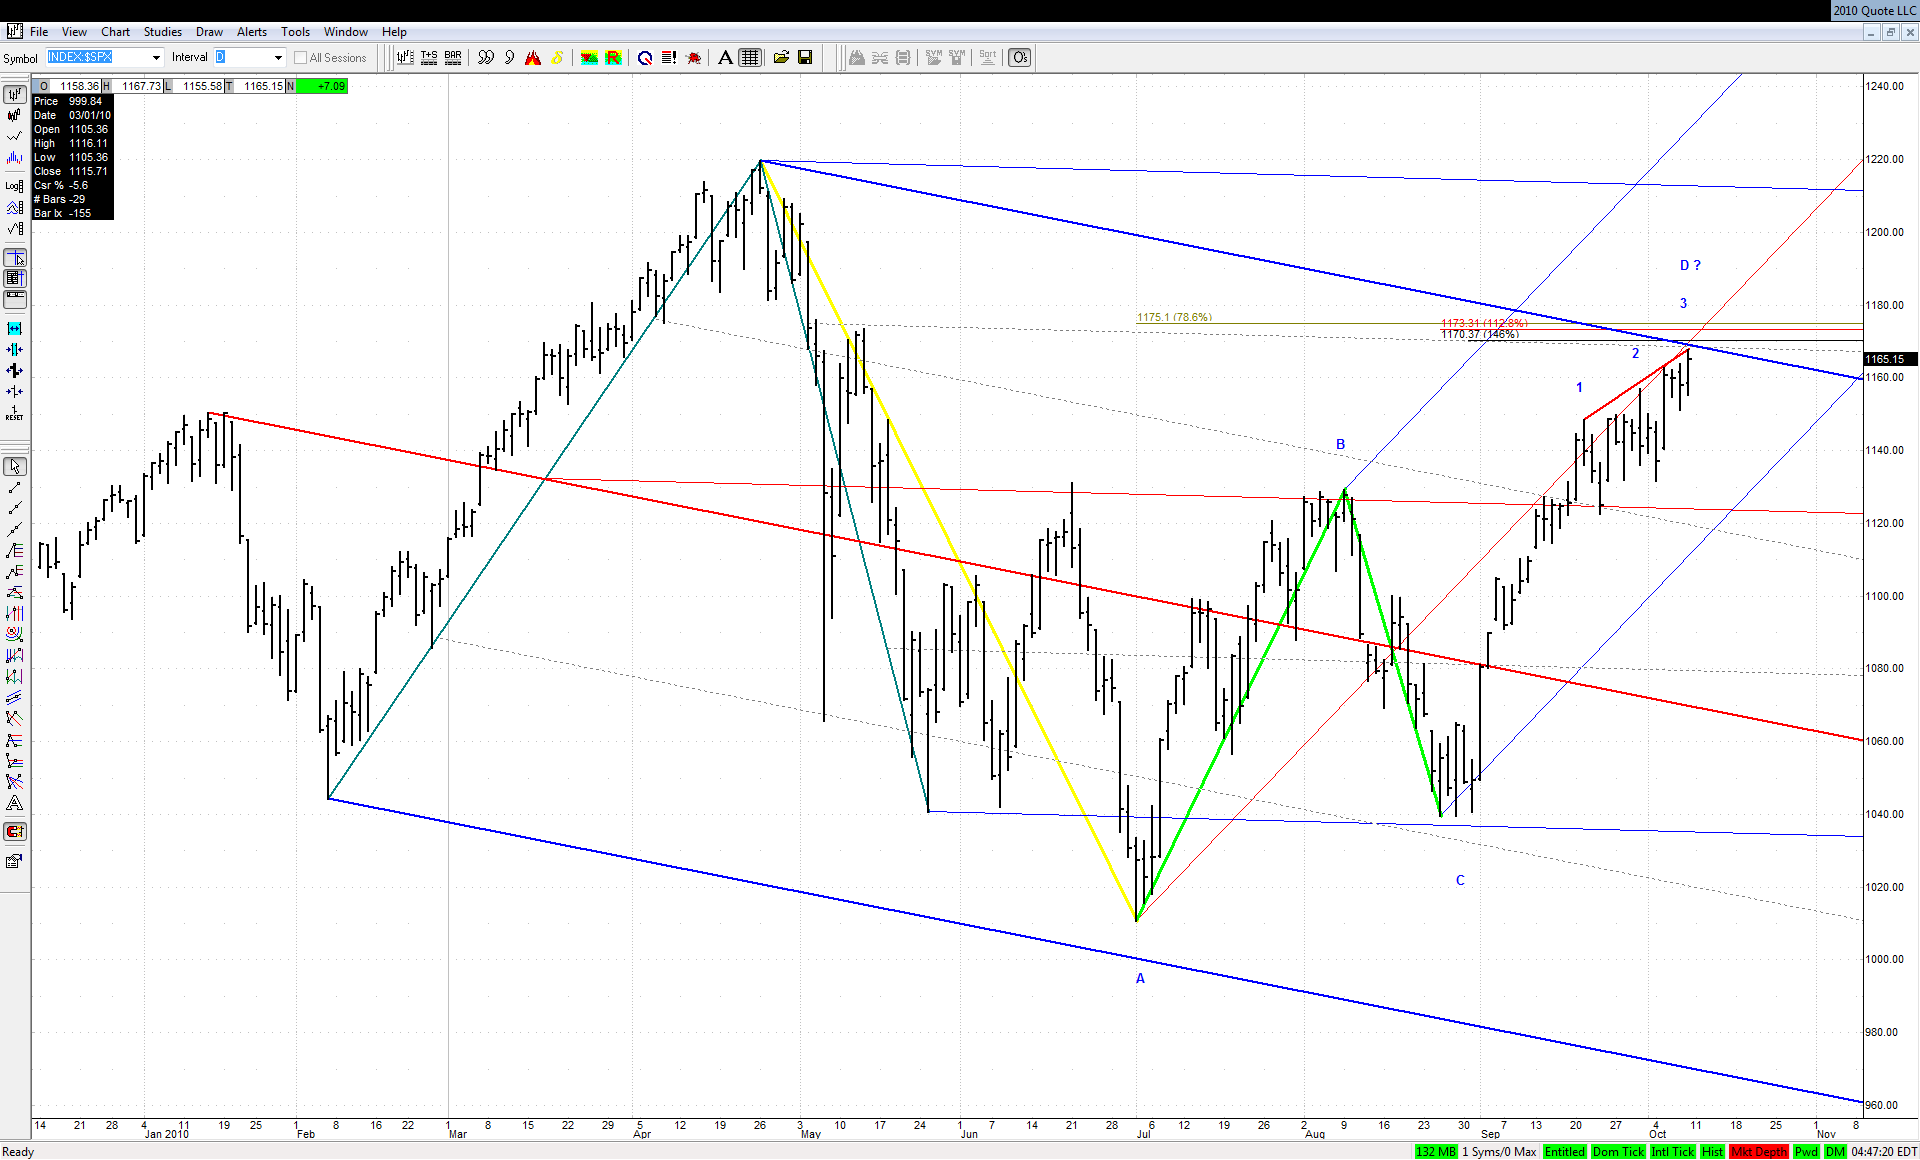


The importance of the current market position is even more visible here, because Friday's high was exactly at the upper ML of the downsloping set at what looks as a possible 3D at the spike line.
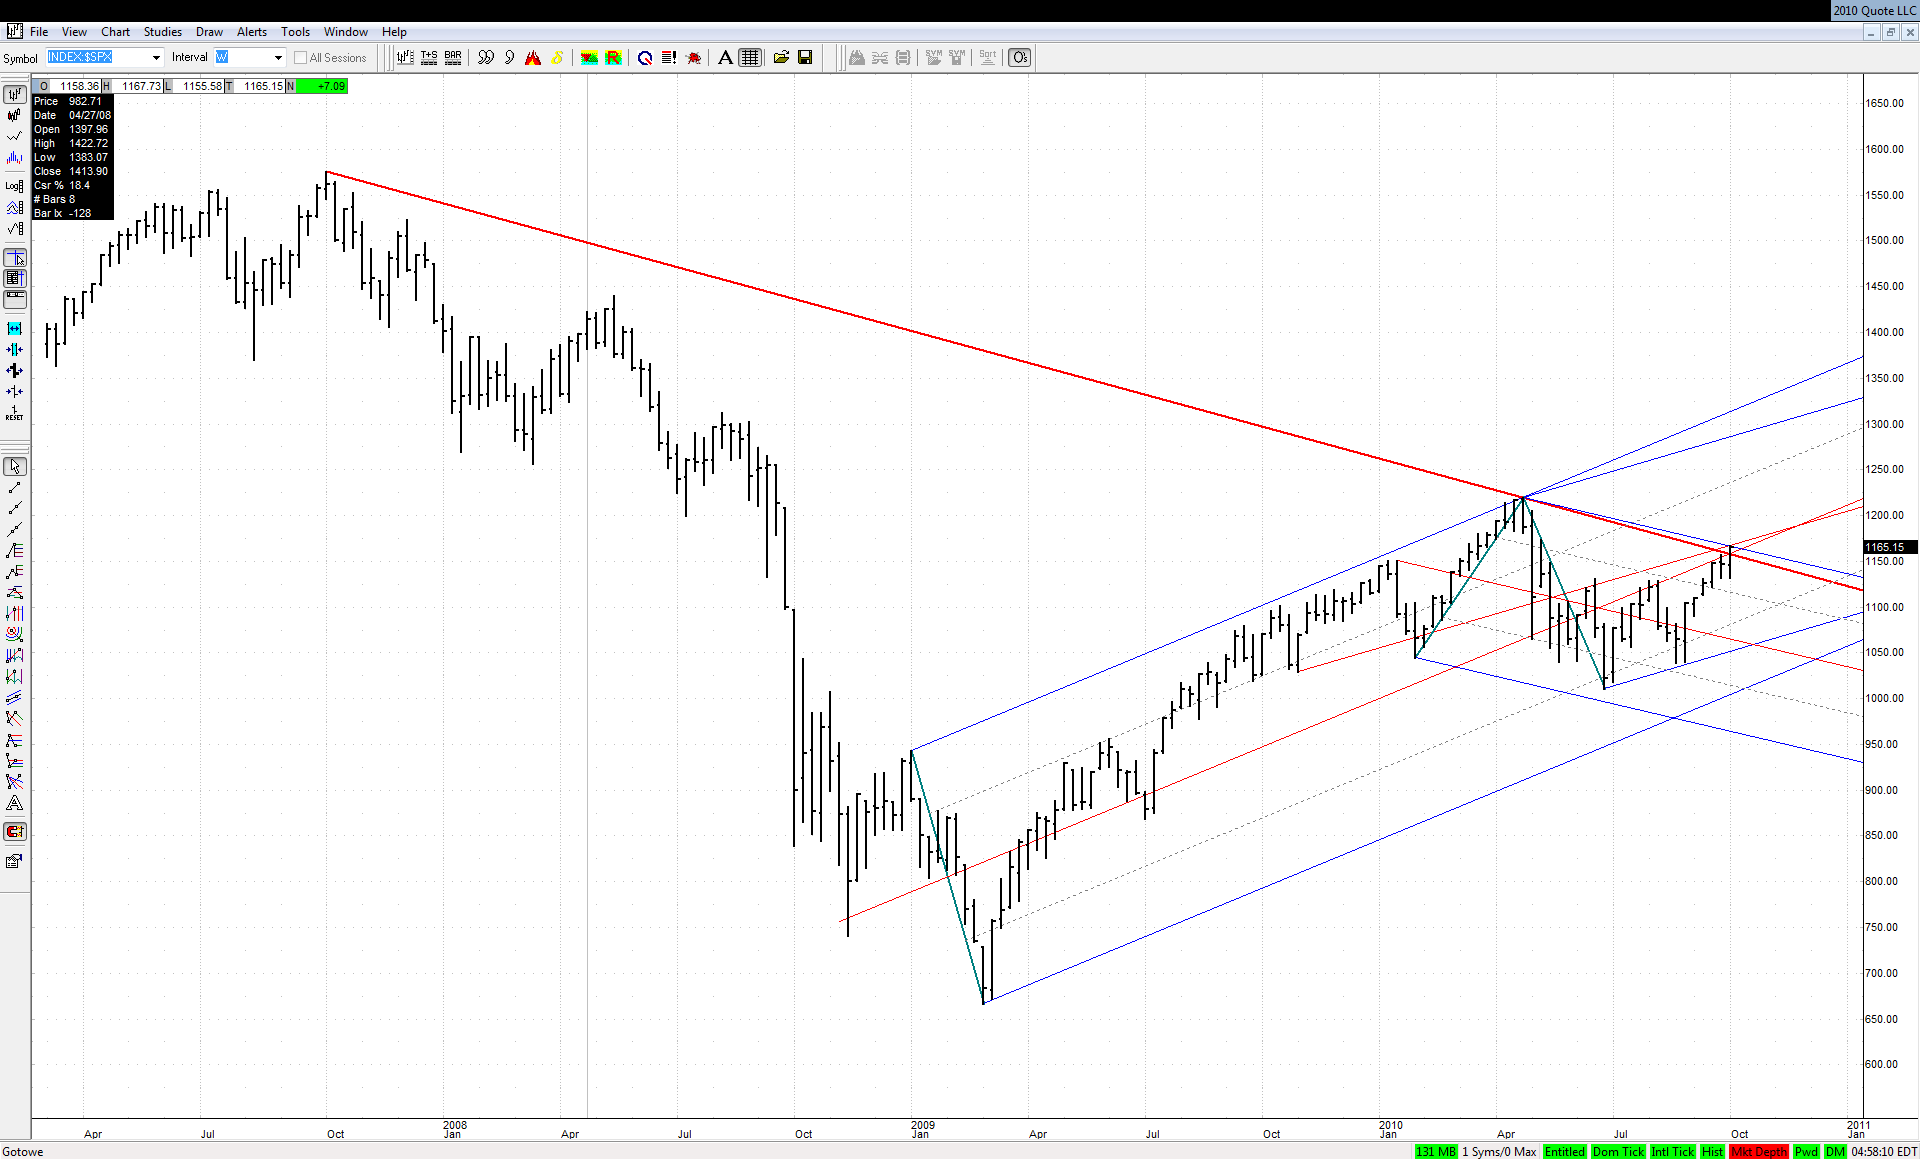
If this breaks to the upside than we should witness an acceleration of the upward move, since there is nothing but air above:


Click image for original size
JA
jarek
Rep: 94
Posts: 3,474
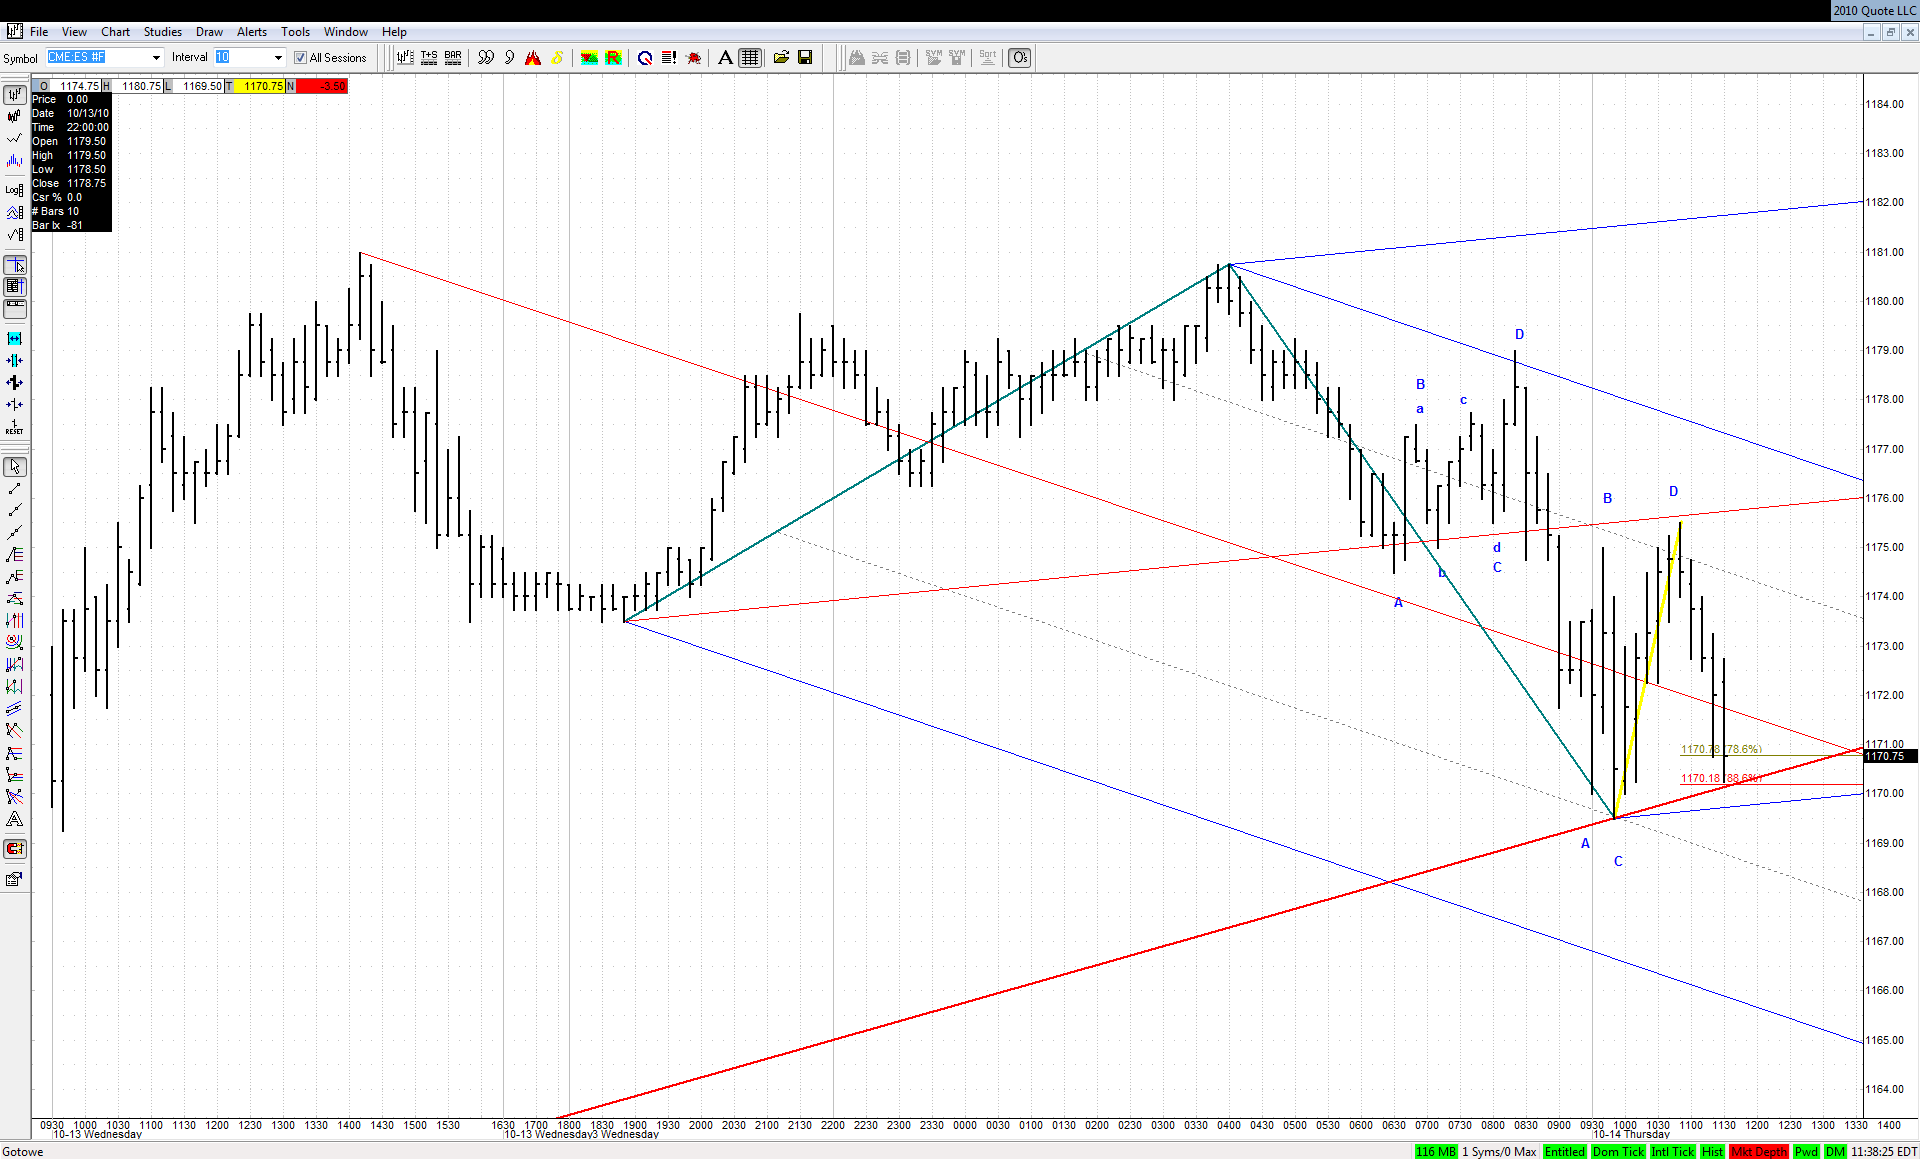
There is a TL from the recent low helping the 'Game Zone'


Click image for original size
JA
jarek
Rep: 94
Posts: 3,474
Originally posted by jimkane


...ES key line here at that 70.25 low...


I see you were first with this TL which just gave way
JI
jimkane
Rep: 3,058
Posts: 33,089
Be very cautious in that ES here, as this is where the insane-bots may hit.
JA
jarek
Rep: 94
Posts: 3,474
We may say that our whole bullish .382 ABCD is just giving way without playing out...
JI
jimkane
Rep: 3,058
Posts: 33,089
If it survives this 2-tick new low, I'm watching 67.75-68 next. If that gives way, this might get interesting.
JI
jimkane
Rep: 3,058
Posts: 33,089
Okay, 68 hit by the time I got that posted. Let's see.
JI
jimkane
Rep: 3,058
Posts: 33,089
65.50-66.50 next, and it's a big one.
JA
jarek
Rep: 94
Posts: 3,474
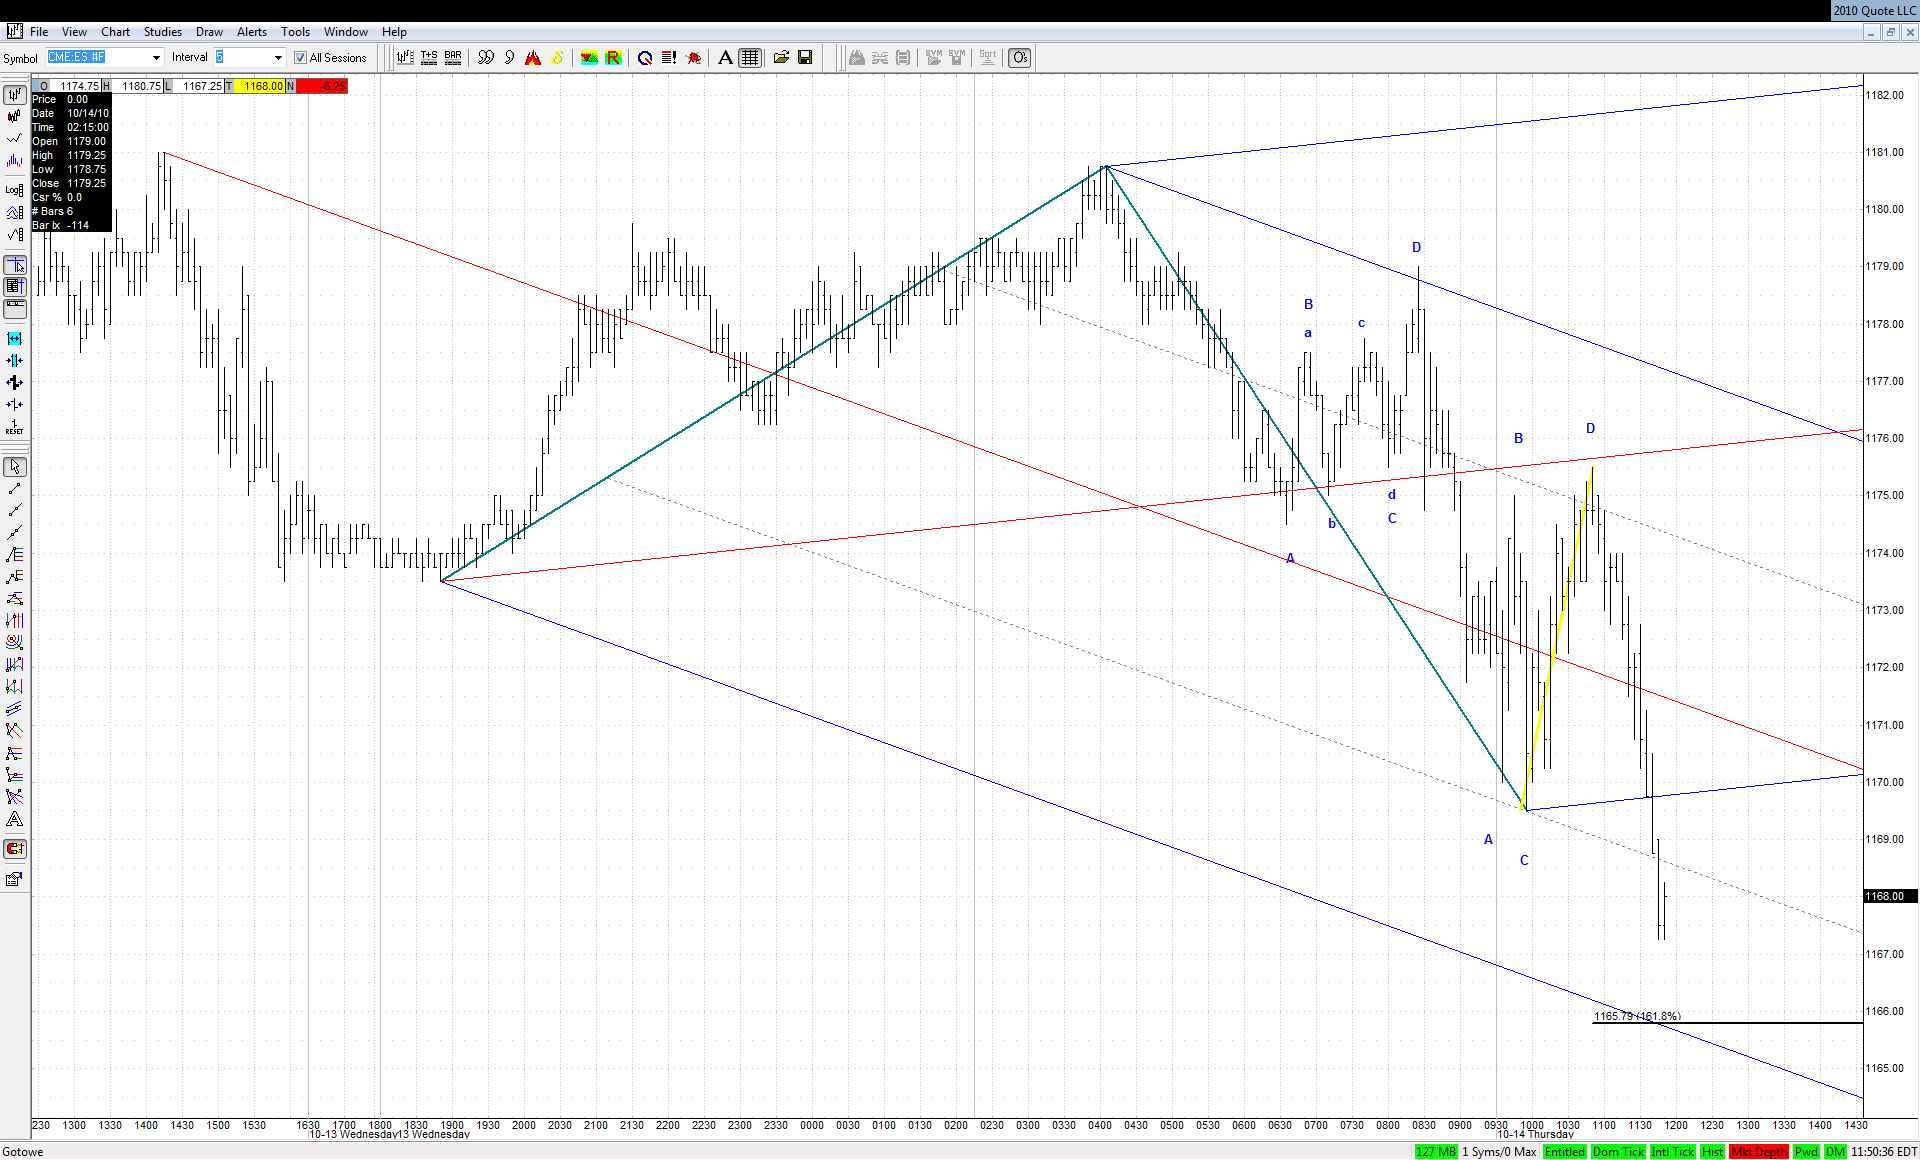
It would mean that our bearish EXP played out perfectly well:


Click image for original size
JI
jimkane
Rep: 3,058
Posts: 33,089
This is the area. That's close enough. Get ready for a big pop up. Hopefully it drops more, but be ready, this is where the drones may get activated.
JI
jimkane
Rep: 3,058
Posts: 33,089
Yes, jarek, that EXP was it. Now you can see some of the basis for my area I mentioned.
JI
jimkane
Rep: 3,058
Posts: 33,089
And there's the close, 75.50 was the high. I'd still say that's close enough, it finished a lot closer to my area than any other place it could have finished. And followed the lines almost like a script. Oh, and BTW, that was a positive close for the ES.