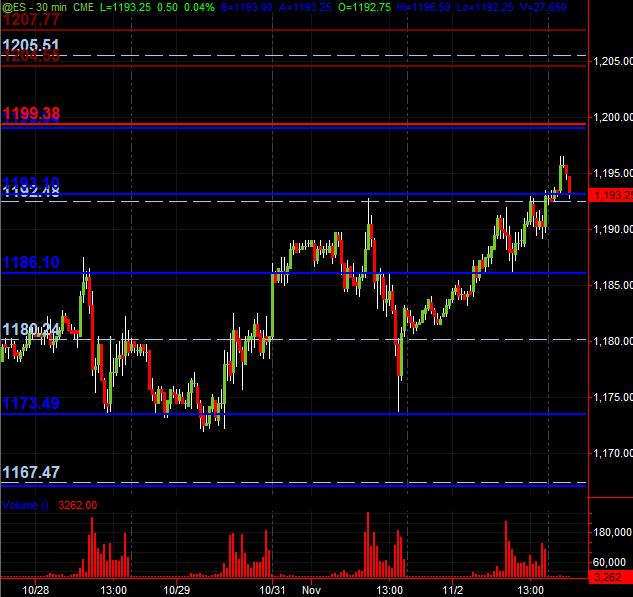
ES S/R Map for 11-3-10
It's closing in on 8pm central time with the elections coming in and a bunch of stuff/reports in the morning ... especially the FOMC gig.
But here's what I've got as potential Support and Resistance price "zones." The Blue lines are derrived from my eyeballing of prior price action across multiple time frames. The Light Blue (whitish) dashed lines are the Wkly Pvts. The Red line is some confluence of fib "exhaustion" projections at the 1199-1200 zone which coincides with potential price action resistance and also showing 1198 as Daily R2 (not to mention the "round number" effect of 1200).
The Maroon lines near the top are simply a ZONE from the RTH high and Overnight high from April 26: 1204.50-1207-75 (continuous contract)with a Wkly Pvt of 1205.50 in that zone.
Below where the ES is currently trading is PASR potential support and Wkly Pvt of 1192-1193 area.
Next stop down as only semi-significant potential support is 1189 while 1186 is more significant, both PASR levels (which, at only 3 points, could be considered a wider "zone."
Just a map for coming into Wednesday's trading. Hope some find this helpful!
Click image for original size
Will not surprise me if the market hits every line on your chart at some point today ...
Agree with that PT. There are leftover triples from yesterday in RTH and they don't stay untouched for long .......usually!
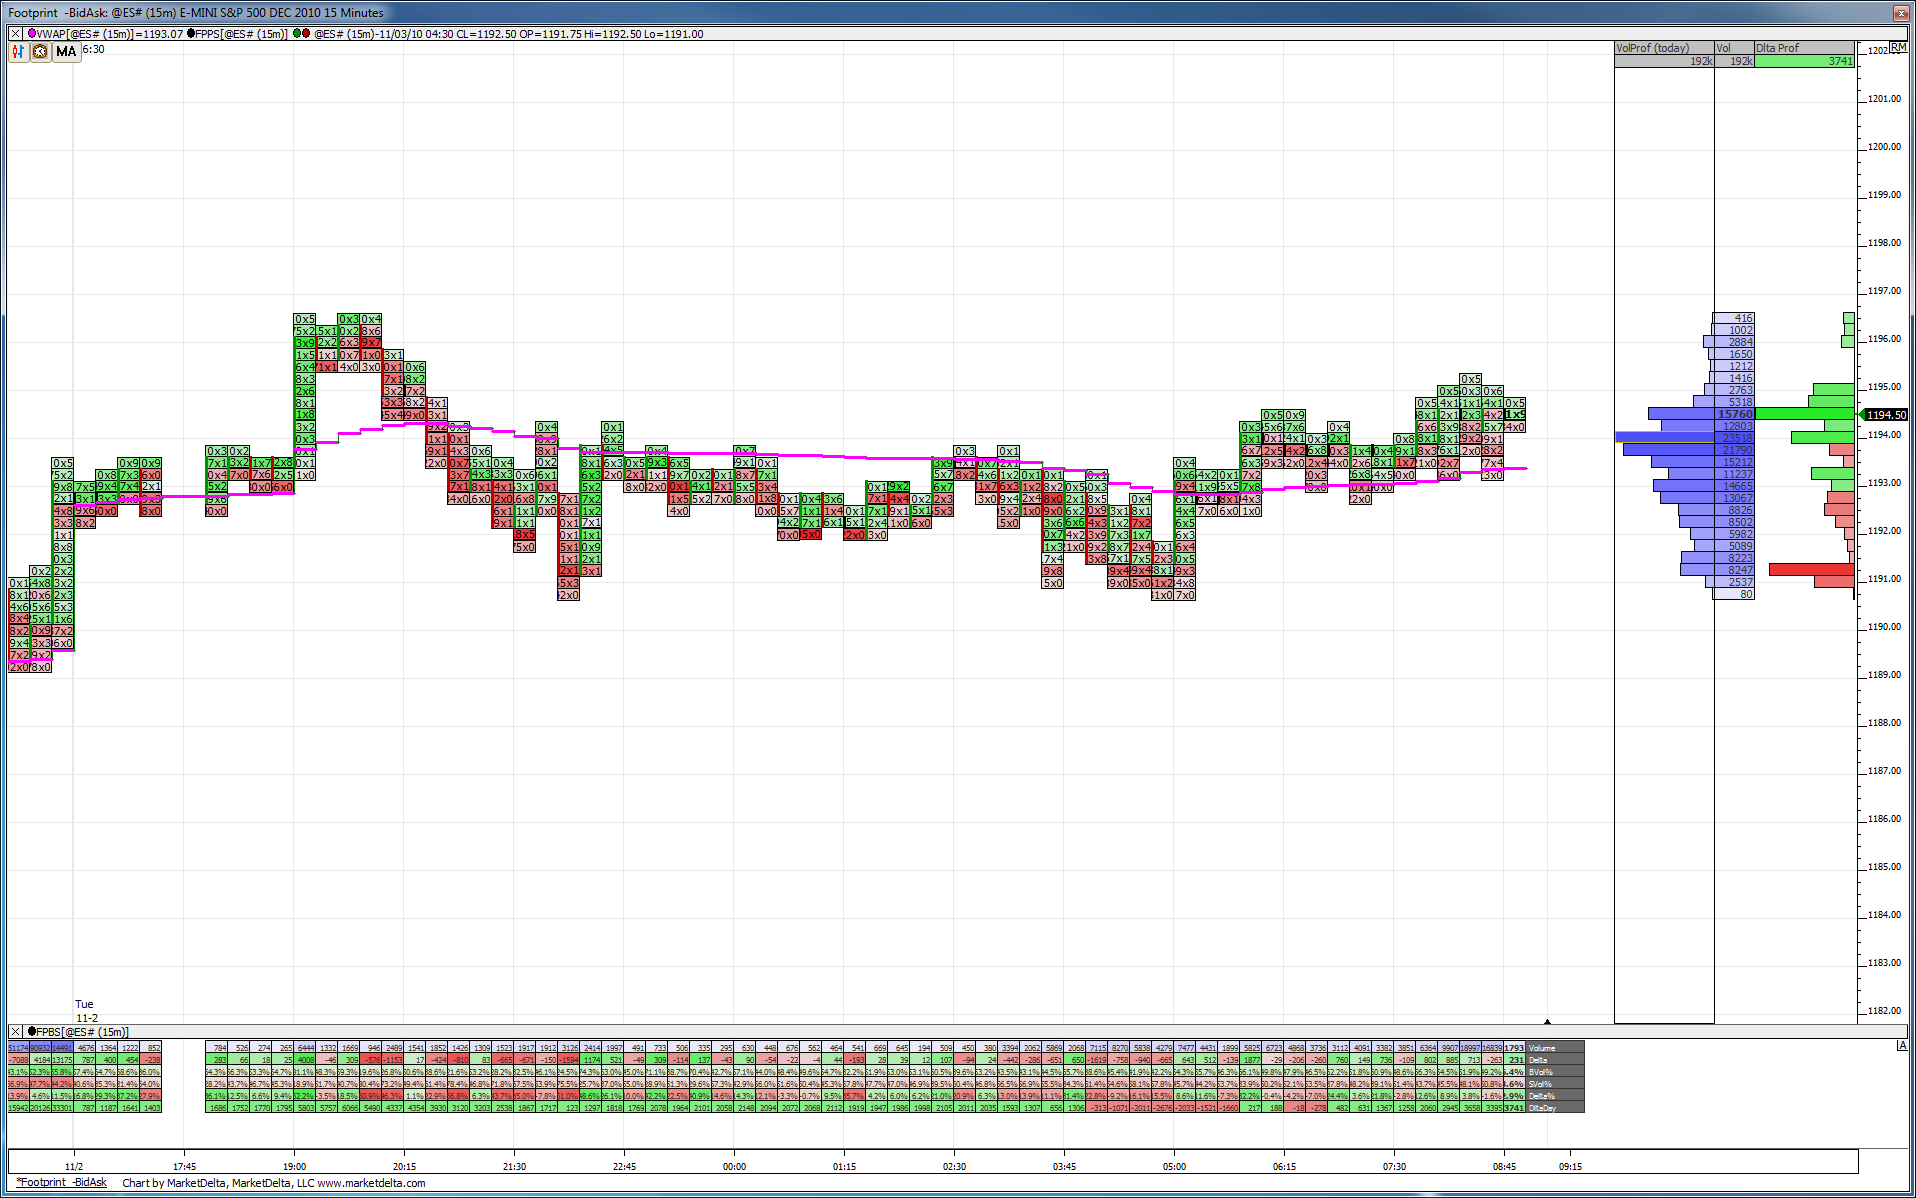
94.50 is top dog from O/N so far as of 8:09 a.m...EST. Not really sure why but volume likes that number so far...I guess because the old 93.75 is nearby
94.50 is top dog from O/N so far as of 8:09 a.m...EST. Not really sure why but volume likes that number so far...I guess because the old 93.75 is nearby
I've tightened the footprint so you can see the entire O/N session. Range bound at its best, above and below VWAP with the volume profile showing the middle of the curve where most of the volume is. My 5-day average read on volume on a per 15 minute basis shows a good 10% below average volume so far. I'm sure by 2:15 today that will change.
Click image for original size
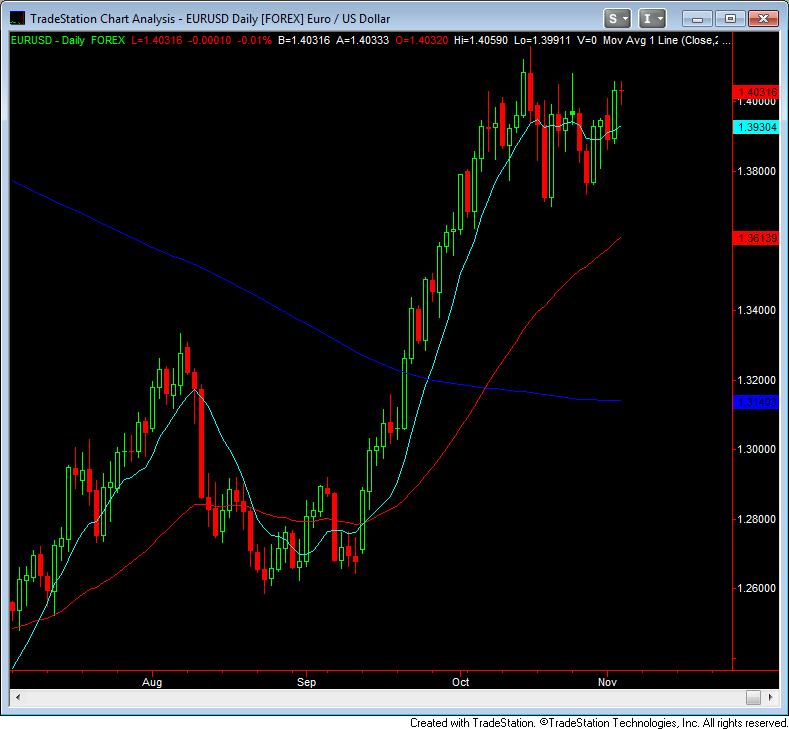
Here is a chart of EURUSD. As part of the larger picture, I really don't think markets will change direction in any meaningful way until this guy changes direction. Maybe they will do it together, maybe one will lead the other. Not sure.
Click image for original size
that's a nice visual Lorn....my plan is to get short if we can get up into the 96 area.....as that symetric distribution you show is a sell the rally/buy the dip visual and use that 94 area as a quick and dirty target/magnet.....we also have the 89 - 90 magnet from YD trade to help pull us back into YD RTH range.
Biggest concern is that sometimes they start making the grind up at the RTH open...so Obviously us faders don't want to get caught up in an updraft that doesn't come back....
Biggest concern is that sometimes they start making the grind up at the RTH open...so Obviously us faders don't want to get caught up in an updraft that doesn't come back....
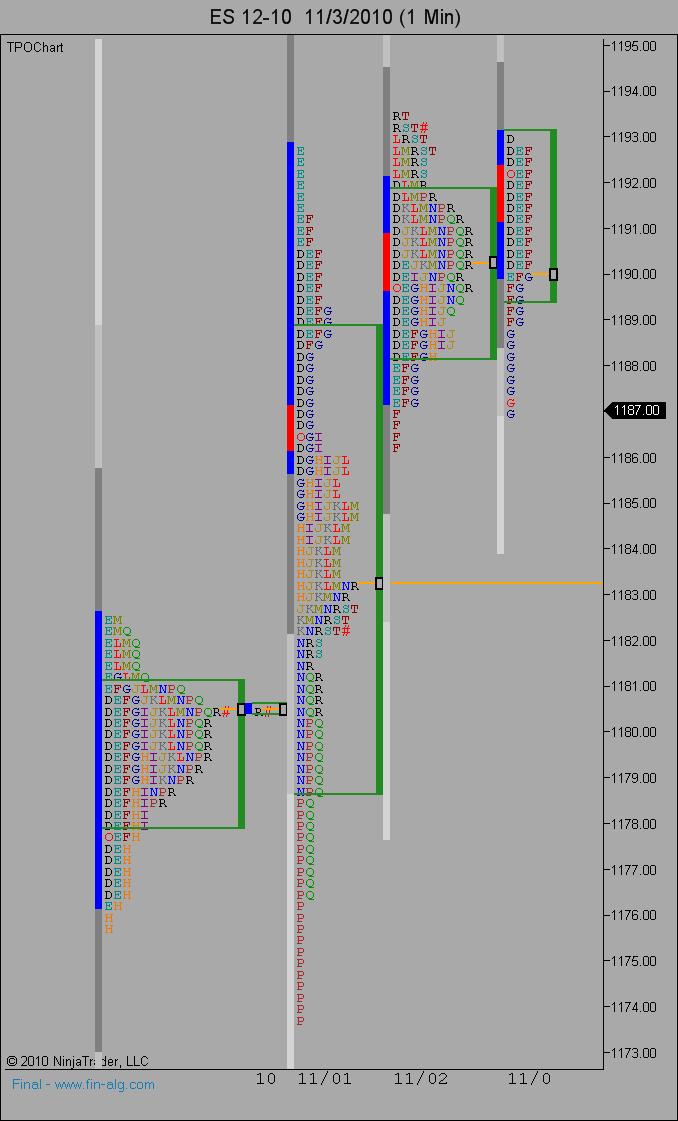
just ran the triples from yday ... have support here near 86 area, but am on sidelines now with it being Fedapalooza day
Grabbed a couple early short trades... MP beginning to feel a little like a trend day... traded easily through yesterdays value area and are now below yesterday's value area low...
Here are some reference points to keep an eye on going into this afternoon...
Here are some reference points to keep an eye on going into this afternoon...
Click image for original size
Originally posted by MonkeyMeat
just ran the triples from yday ... have support here near 86 area, but am on sidelines now with it being Fedapalooza day
for anyone that got long 86 area for some insane reason, there's trips at 90.50 and AIR at 91.25 on my chart ... getting there on Fedapalooza day's another story though
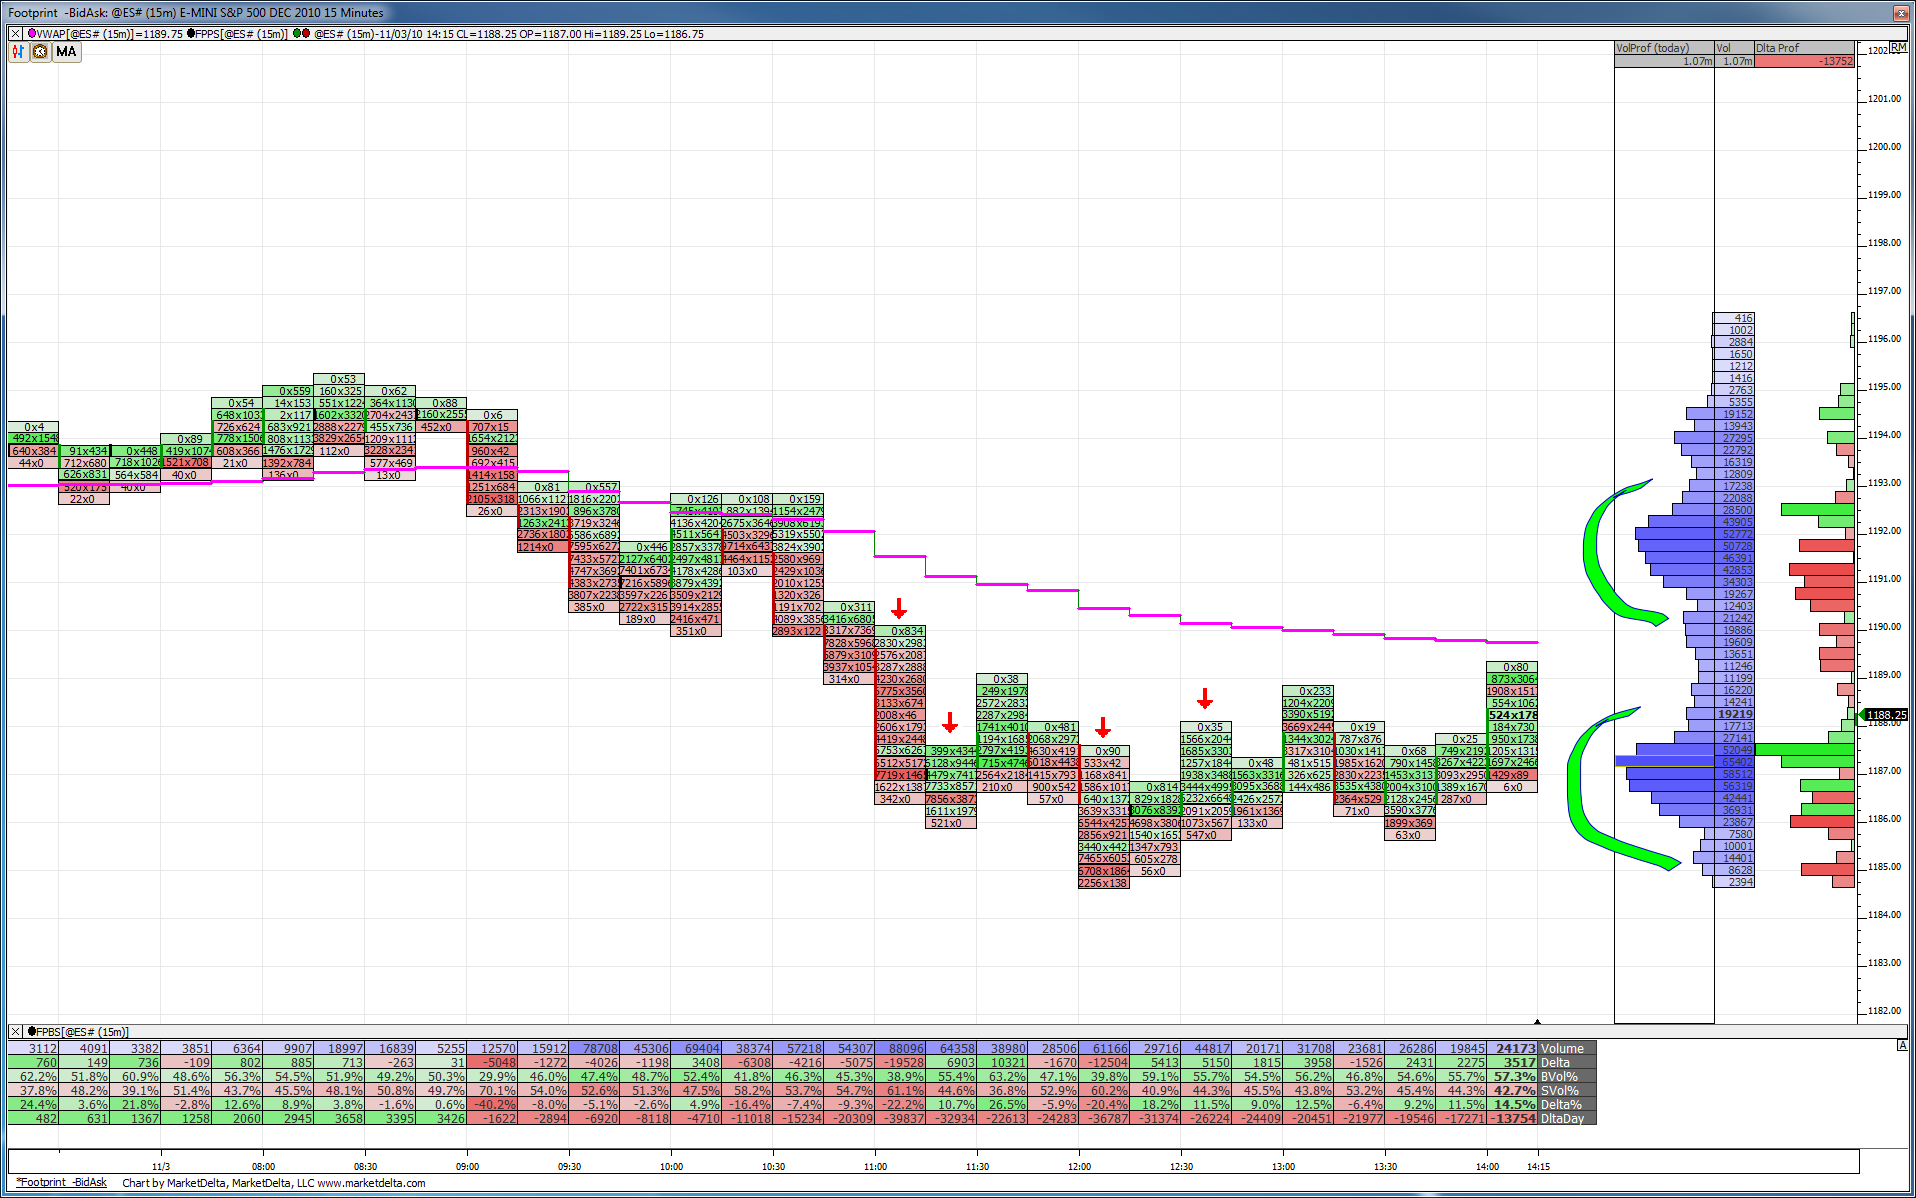
Coming into the announcement here is the footprint chart. I've marked with red down arrows all the bars which have volume above the 5-day average volume. Note how all of them have come underneath VWAP. Something else to take note of is the first half hour of RTH volumes was extremely below 5-day average, which is very abnormal.
I've also marked the volume bulges on the right side of the chart. Note the lack of volume between the bulges. This suggests prices might want to spend some time filling in volume between the bulges.
No real trade ideas here but just notes I like to keep to help me stay focused on the forest and not get lost looking at the trees.
Click image for original size
a common pattern it seems is that they test the area they push it out from....so hopefully they will push it higher first because I am a better seller than buyer....the point is that I will look for fading that first push and try to target the pre-fed area...the price just before the volatility increases...and hopefully they will leave a gap in the data there!!
the high volume node just jumped from 87.50 up to 91.75..... volume is getting attracted at higher prices so that is good for bulls in theory and they tested that low volume in the 89 - 90.50 area...reason I'm sitting out now is I don't like how we traded in equal amounts above and below the 87.50 before it flipped higher ( this was also the average of the range !!!)and we still have low volume in there....so this can still go down to 87.50
"when in doubt, sit it out" - glad that made sense MM...at least I hope it did
"when in doubt, sit it out" - glad that made sense MM...at least I hope it did
Emini Day Trading /
Daily Notes /
Forecast /
Economic Events /
Search /
Terms and Conditions /
Disclaimer /
Books /
Online Books /
Site Map /
Contact /
Privacy Policy /
Links /
About /
Day Trading Forum /
Investment Calculators /
Pivot Point Calculator /
Market Profile Generator /
Fibonacci Calculator /
Mailing List /
Advertise Here /
Articles /
Financial Terms /
Brokers /
Software /
Holidays /
Stock Split Calendar /
Mortgage Calculator /
Donate
Copyright © 2004-2023, MyPivots. All rights reserved.
Copyright © 2004-2023, MyPivots. All rights reserved.