MyPivots
Sign In
JA
jarek
Rep: 94
Posts: 3,474
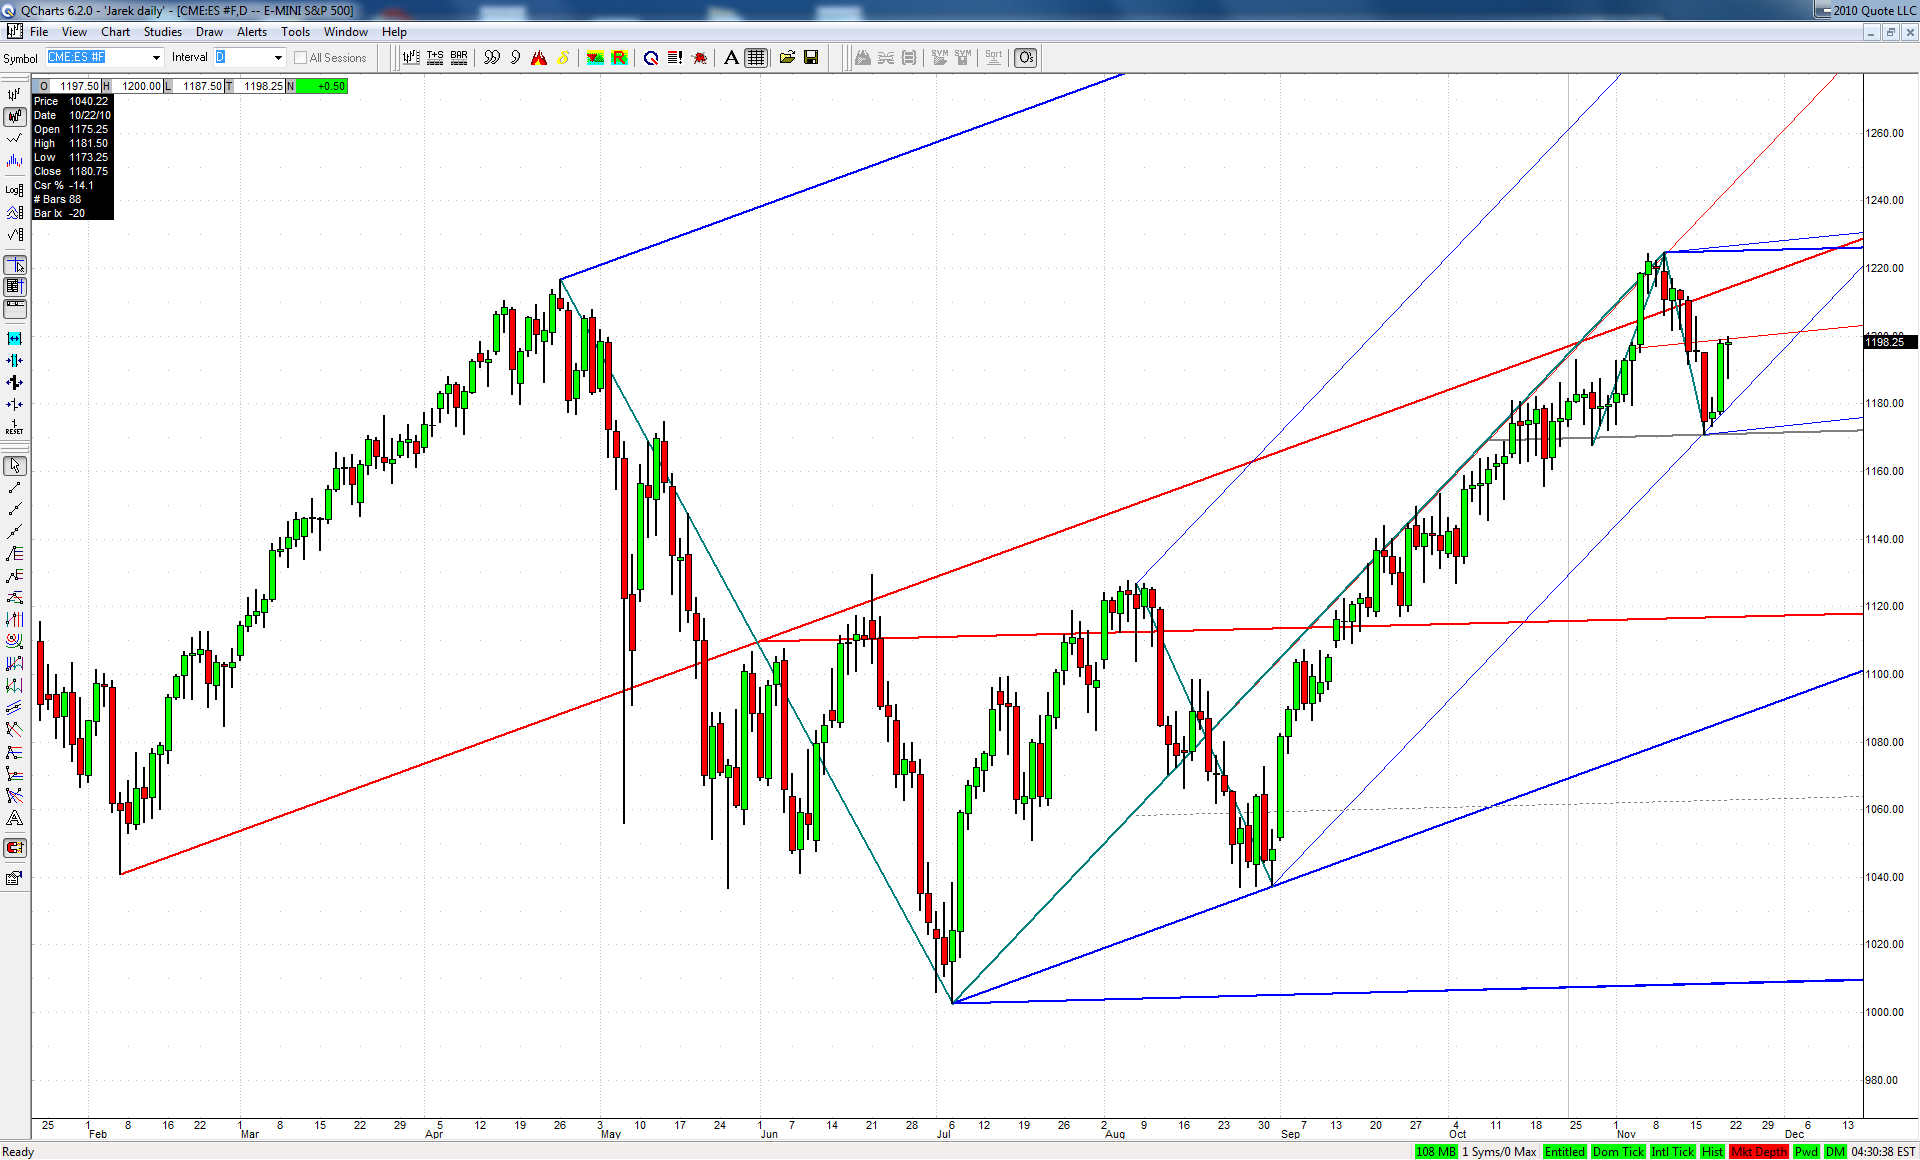
As it turns out the Tuesday low was exactly at longer term geometry - x marks the spot formed by lower ML of our upsloping set and division line of a big Schiff set anchored at Apr-Jul decline and Jul-Nov rise:

Click image for original size


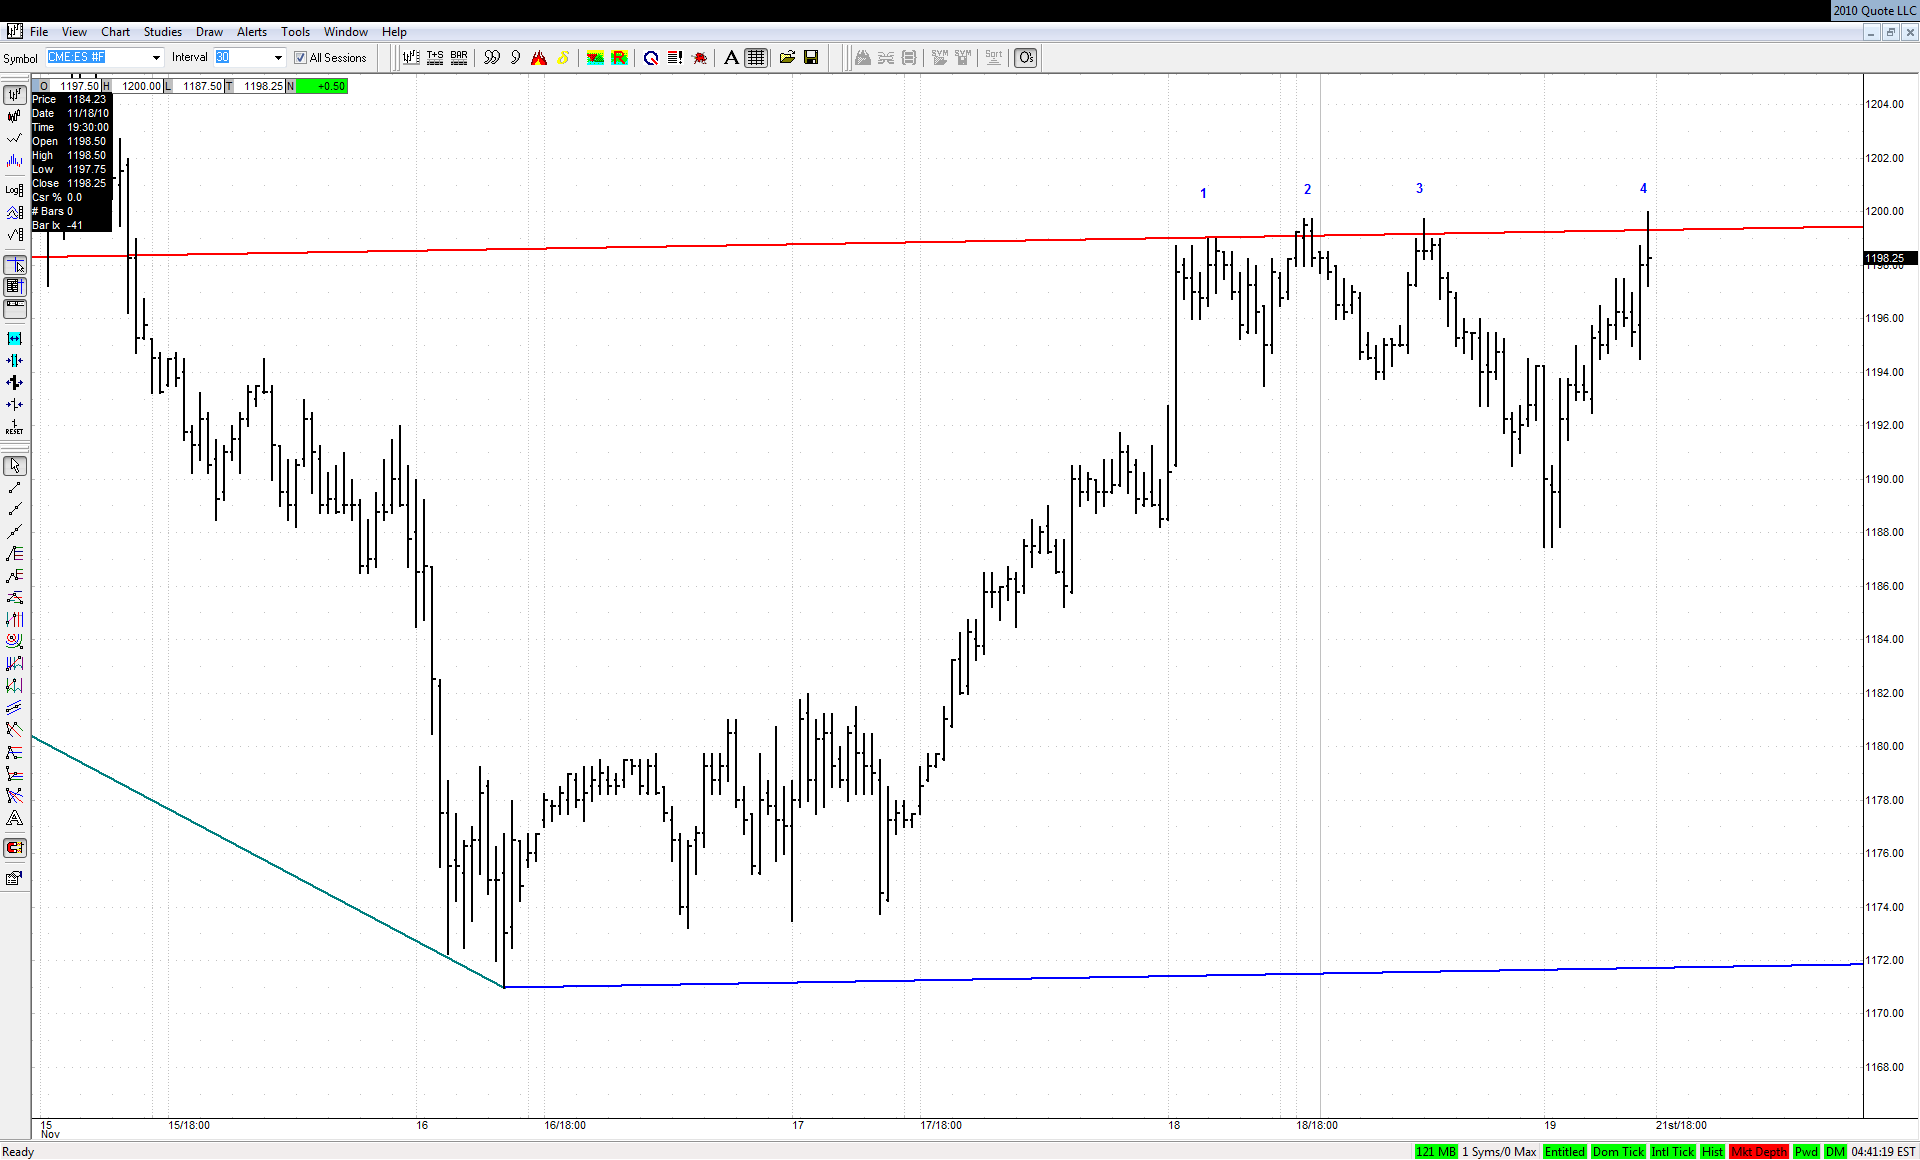
The recent bounce reached exactly the ML of a smaller Schiff set and unsuccessfully challenged it 4 times already:


Click image for original size


If the recent top was an important turning point that line should not give way in my opinion. We could have an answer as soon as the trading resumes in that matter
JI
jimkane
Rep: 3,058
Posts: 33,089
Careful right in here, the way it's acting...

jarek's posts shows why the areas here are dangerous.
JA
jarek
Rep: 94
Posts: 3,474
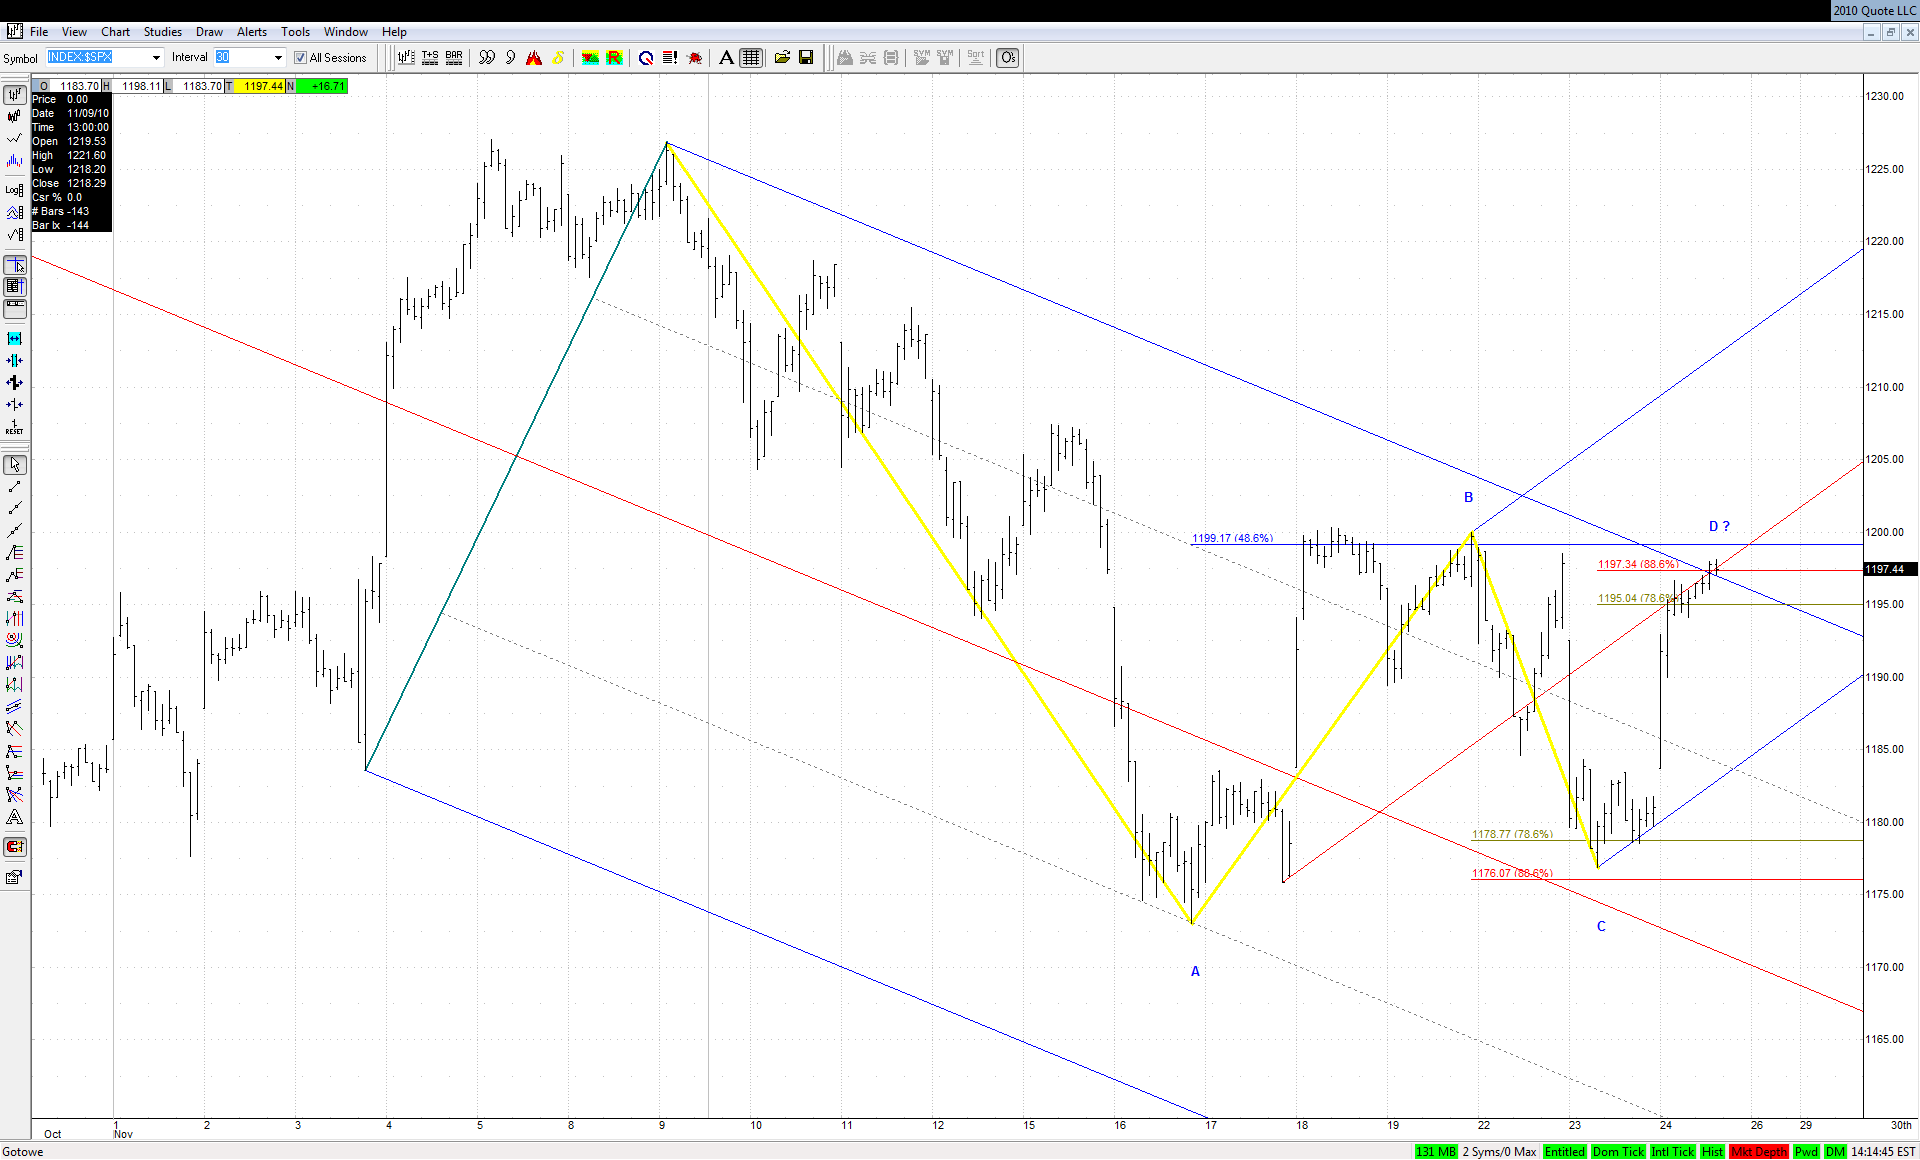
In $SPX that would be a nice 4PT...


Click image for original size
JI
jimkane
Rep: 3,058
Posts: 33,089
The problem is, we are back to the premise that this is some kind of a bearish 'W2' in here, and the top is in (or a bigger ABCD is forming below that this is the BC leg for). Although this looks great when it happens and you see it ahead of time, unless you can really technically support the top being in, it becomes a very low probablility setup, most likely being a 'W3' up. Not only does this then stop one out, it also has one missing the upmove that continues as the 'W3' plays out. Just something to think about.

The main issue I see among students is when they finally catch one just perfect, they use that single event to reinforce that this is a good strategy. Like I say, I only trade 'W2's' when I missed the reversal point for a full blown PTA and it gives me a second chance to get in. Is the recent high a full blown short side PTA i.e. the top, based on the methodology, or a high probability top based on some other criteria?
JA
jarek
Rep: 94
Posts: 3,474
I see your point Jim. I'm not arguing here that these necessarily are W2s of the move from the top. I simply noticed concurrent bearish setups on all major indexes that bulls need to overcome on the way up.
JI
jimkane
Rep: 3,058
Posts: 33,089
Oh, I wasn't referring to you specifically, jarek, more just musing out loud the things that go through my head as I consider various premises and potential opportunities. It should also be noted that many, many of these 'countertrend' areas will produce reactions, in my experience, and they frequently may be the basis for intraday trades I may be considering. And lastly, I have been of the opinion that the April top was likely the end of the run up, and with the nominal new high and drop, I was thinking it may have just been a sucker trap, and the top was still in.

Although I talk about the huge upside possibilities because of the quadrillions being printed solely for bank profits and gunning stocks up, I also ponder if we get the great unraveling before that can happen. The unraveling may happen fast, almost literally overnight, and once 'they' lose control, even 'they' can't stop it. It's all these things that make a market, make it difficult to make zillions overnight like the dream merchants say, and make this business the challenge that it is, I feel.
JI
jimkane
Rep: 3,058
Posts: 33,089
Also, jarek, your pointing out the key areas I think is invaluable to the readers (to study your charts and see how you came up with them), because the point, for me, of looking at areas isn't always to find PTA's, it's also equally to make management decisions on existing positions, and to read clues to hopefully give me a better read on possible odds for the PTA's that I do find.
JI
jimkane
Rep: 3,058
Posts: 33,089
1198-1202 is going to tell me a lot with this ES. It's also the 4PT key area. Notice crude still smokin', leading this up. What if the ES at cash close is right in that area??? Another surprise, a cash close at a key area...
JA
jarek
Rep: 94
Posts: 3,474
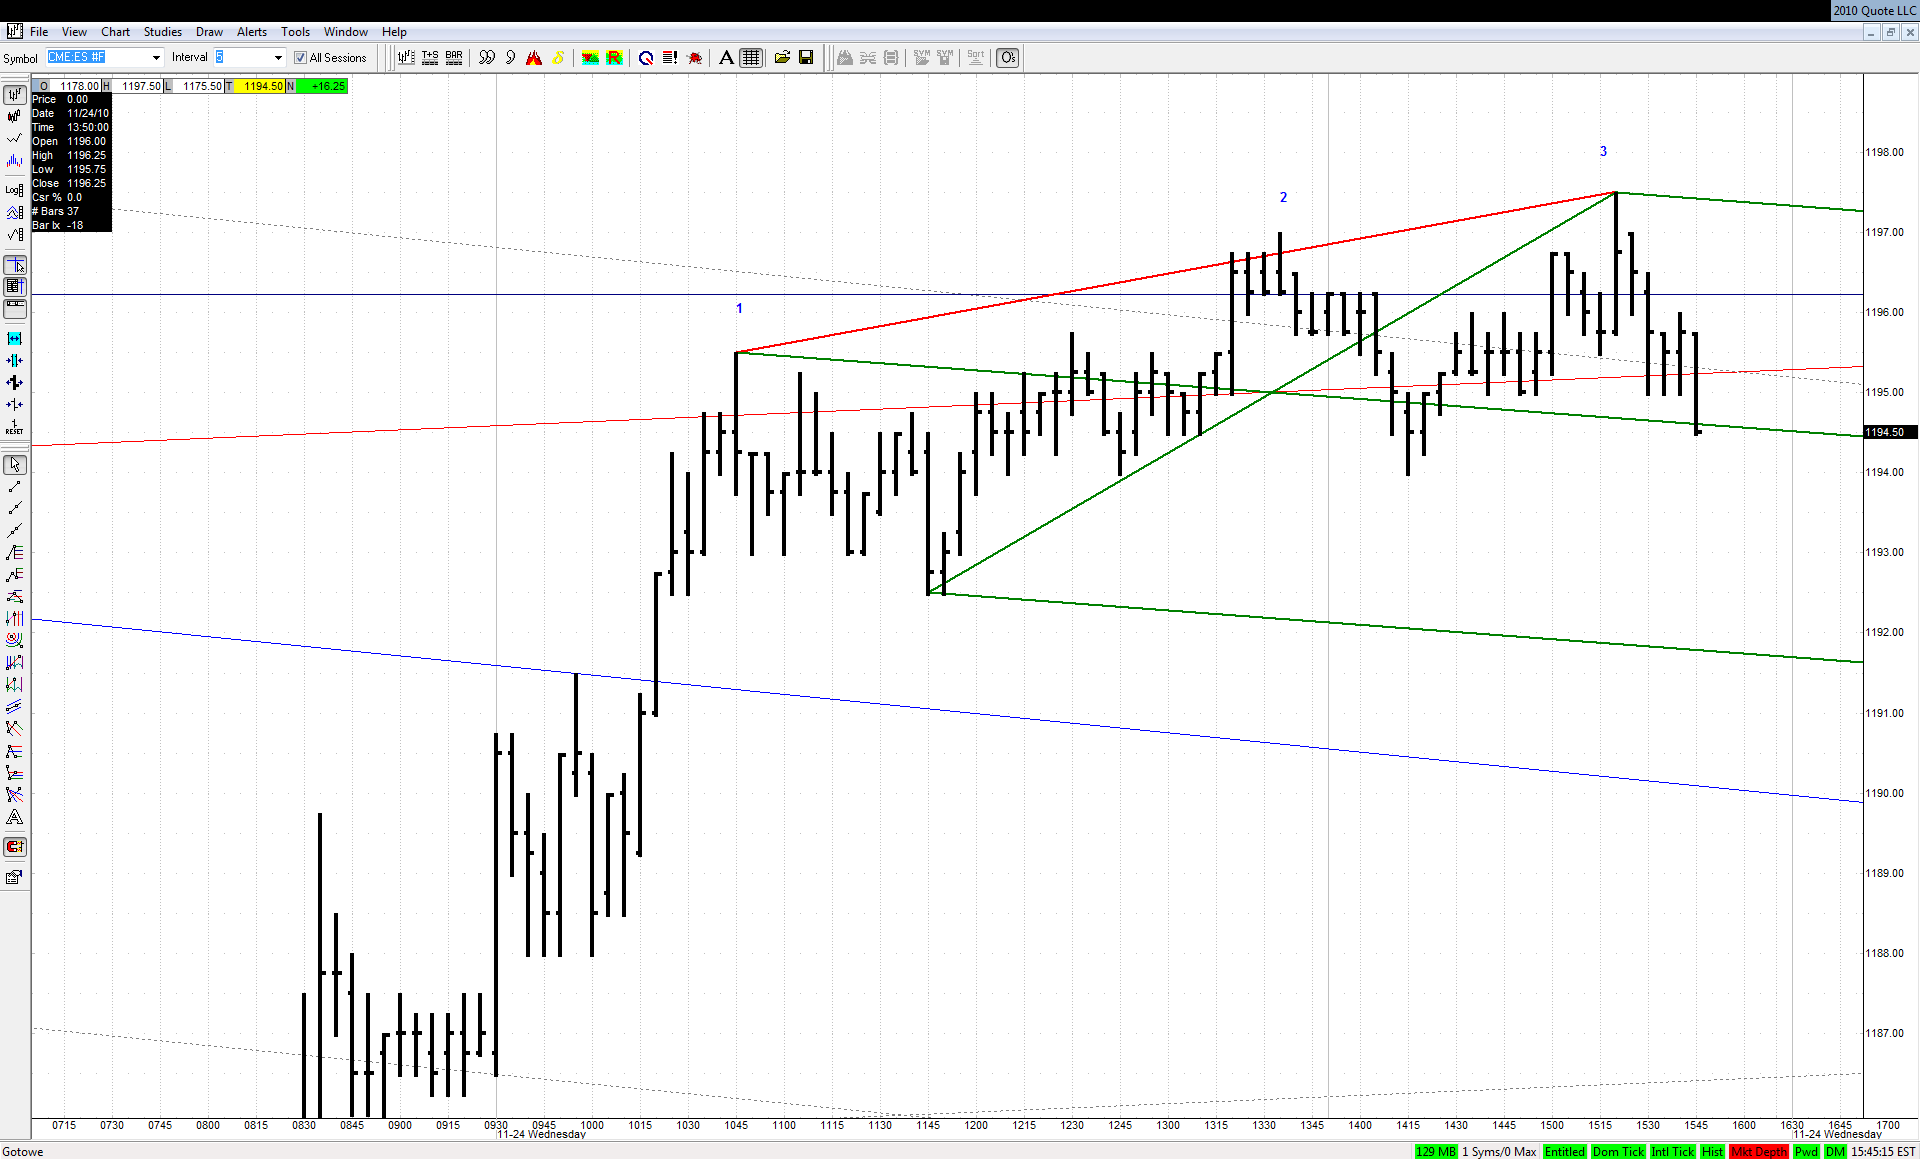
I could probably bet my financial well being on the green set at 3D...


Click image for original size
JI
jimkane
Rep: 3,058
Posts: 33,089
Yes, I have that very SL and set on my chart. And lo and behold it went to the green ML and is reacting.
JI
jimkane
Rep: 3,058
Posts: 33,089
Back to the HOD. Will that 97.50 be as close as we get to the low end 98 I mentioned, or will after cash give it a boost?
JI
jimkane
Rep: 3,058
Posts: 33,089
So, note my comment below "...if it isn't a fake break snap trap, which looks like a 5-wave up to boot...". That was exactly what it was, a final push 'W5' over the obvious TL to draw in a bunch of suckers, and then they dumped it. What is really noteworthy (other than this classic sucker trap snap reversal) is that it went right back to the very same TL's that sent this up on the 16th (retested multiple times on the 17th), the 23rd (retested on the 24th), and the premarket today. After all those times coming off those lines (I have two TL's and a set line almost overlaid on each other), it finishes the day/week right there again. In many cases like this, especially in pre-manipulation Mar 2009 times, this line area would give way.

Notice, also, how the 4PT did send it down after all, but now this may be a 'W2' 4PT to send it back up. Given that it is at a key line area, I'd expect a possible bounce, and then perhaps back to that downsloping TL area. The key aspect to me is that it really already did a bounce, and timewise, on say my 240-min chart, the bounce and drop into the close was very fast, and doesn't indicate the immediate need for another bounce.

Hence, it may drop right down from here, even open on a gap down. But, when do we see a Sunday gap down and drop? And if we did, has it sustained even once in well over a year? Not that I recall. So, the odds favor another bounce here based on the Sunday thing. I want the important point to be clear here, though, and that is that it is coiling ever tighter between two lines here, and a break should be soon, as the apex is getting closer and closer.


Originally posted by jimkane

1200.50 in a nice last minute burst there, right to the heart of the key area, as expected. Can't wait to see what the open brings later today, and the overnight. Because of the time it went sideways, this last move is solidly up and over the obvious TL on the say 120-min all-sessions chart. This implies to me that (if it isn't a fake break snap trap, which looks like a 5-wave up to boot) it plans to run.


Originally posted by jimkane

Okay, I guess 97.50 will be it (pretty darn close to the meat of my key area) until GLOBEX opens later...