MyPivots
Sign In
JA
jarek
Rep: 94
Posts: 3,474
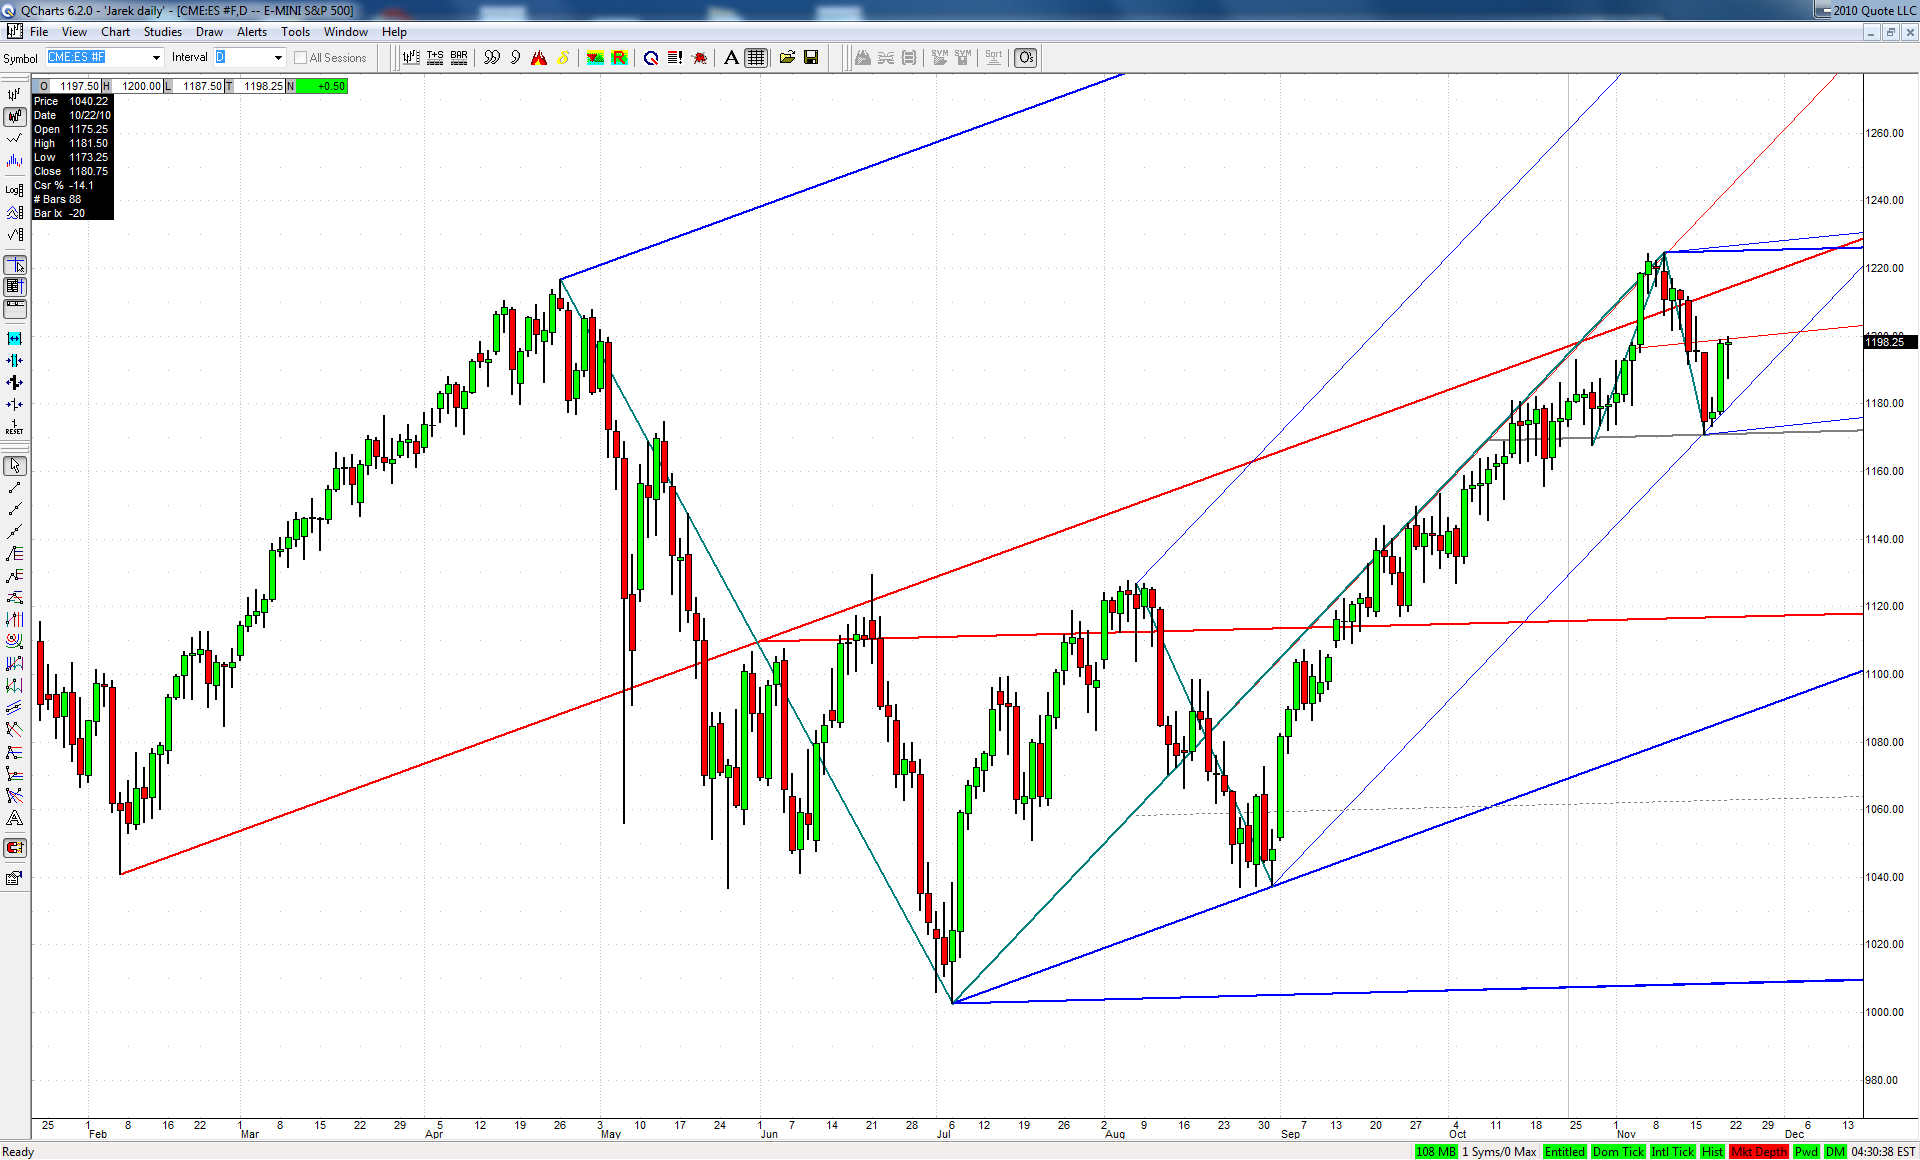
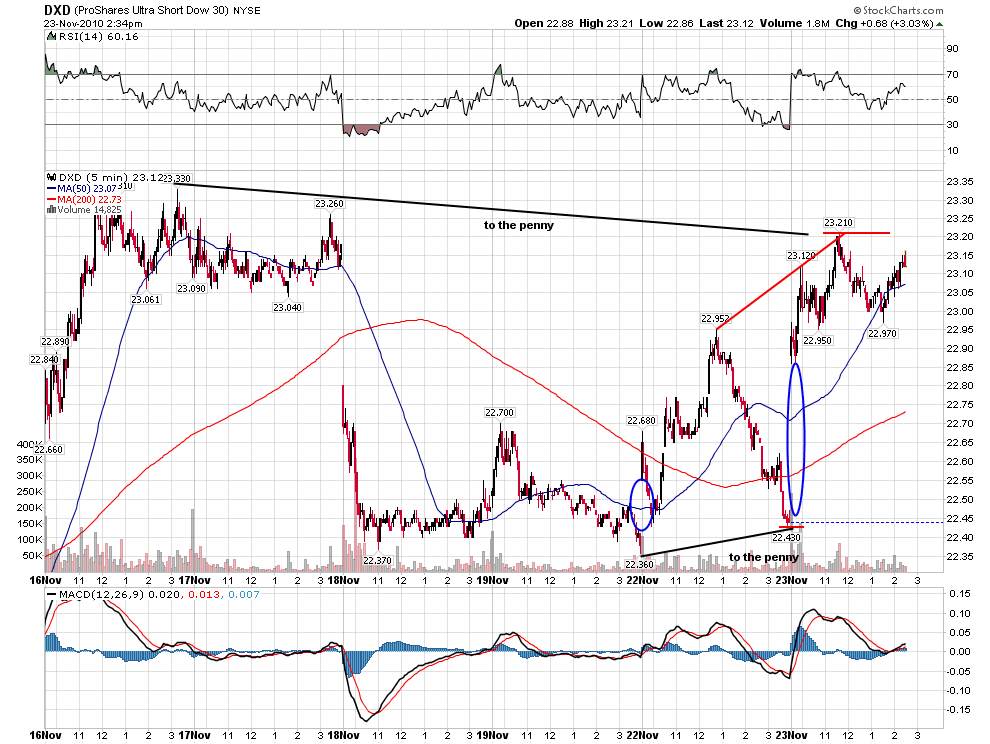
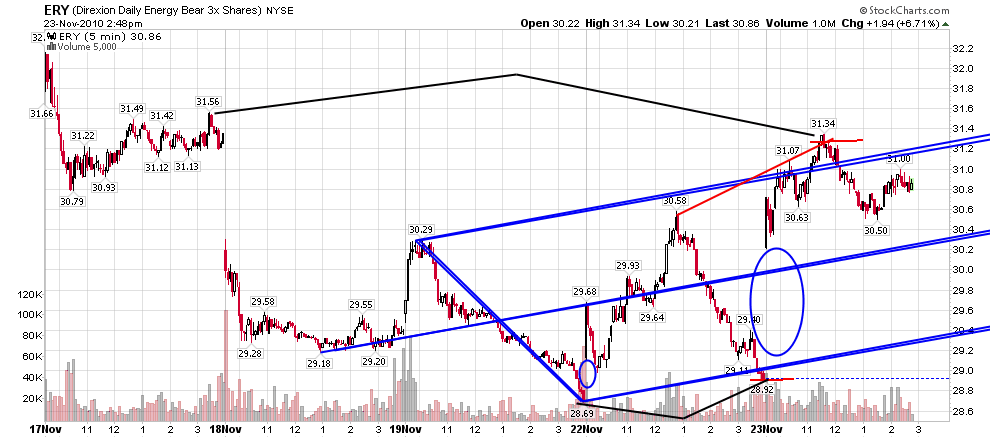
As it turns out the Tuesday low was exactly at longer term geometry - x marks the spot formed by lower ML of our upsloping set and division line of a big Schiff set anchored at Apr-Jul decline and Jul-Nov rise:

Click image for original size


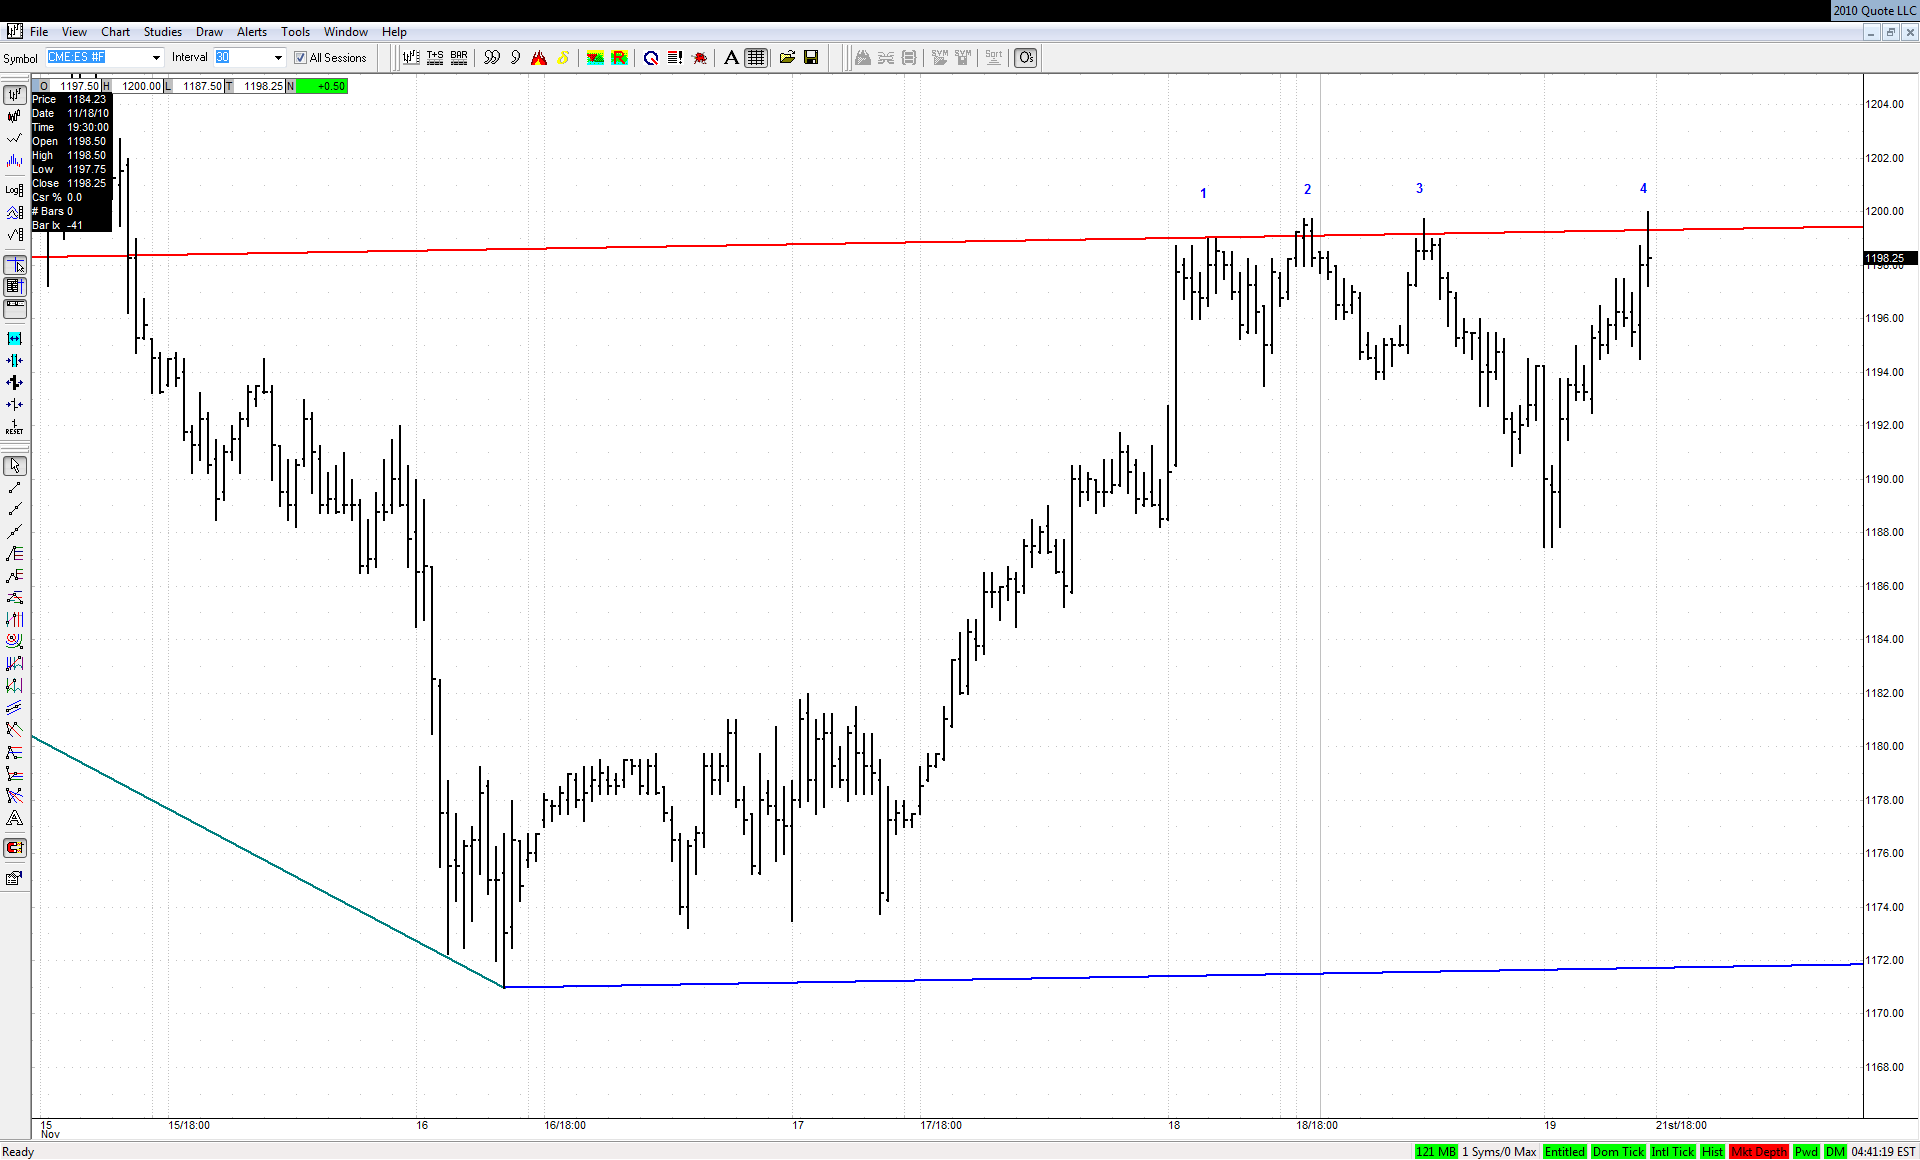
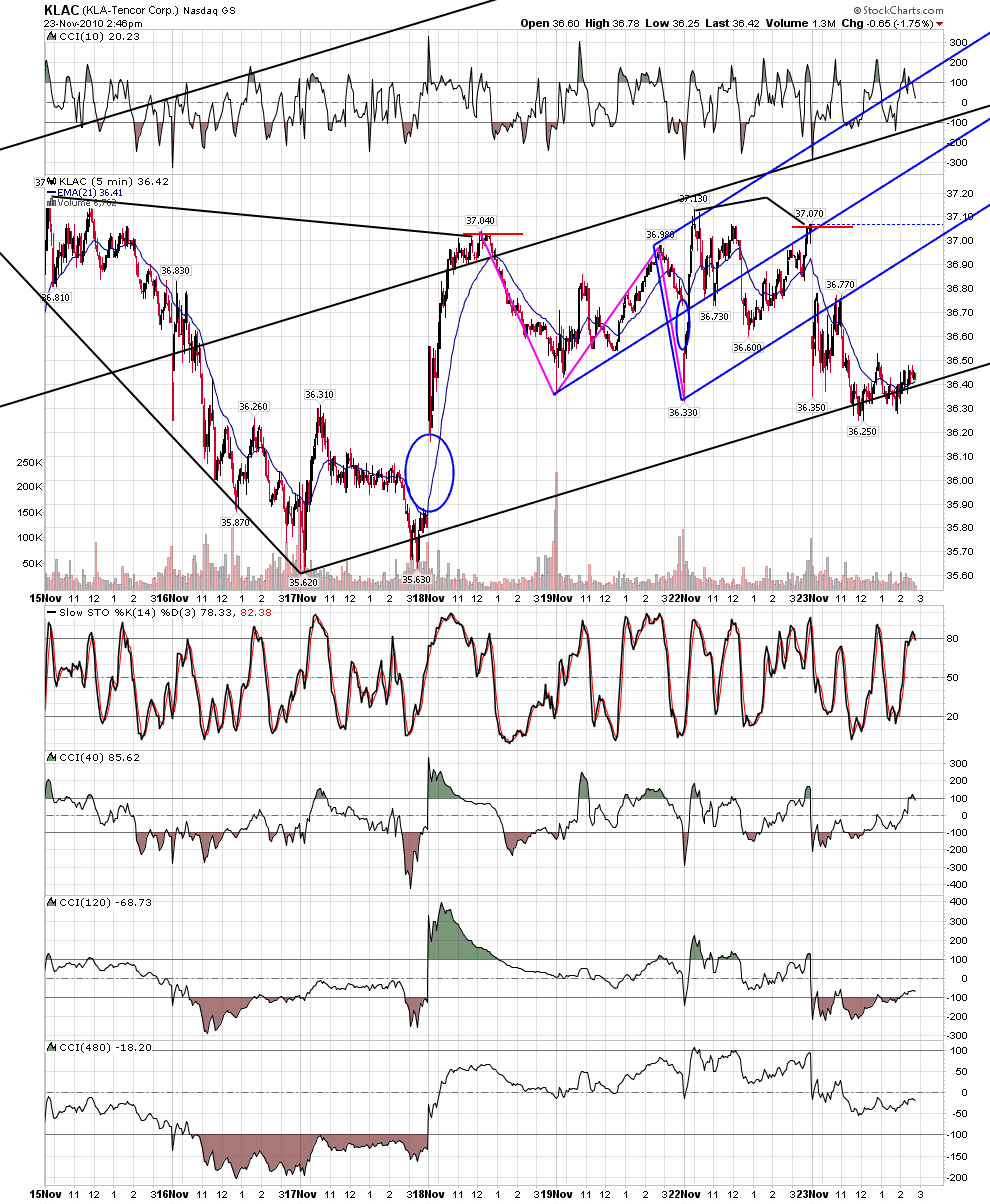
The recent bounce reached exactly the ML of a smaller Schiff set and unsuccessfully challenged it 4 times already:


Click image for original size


If the recent top was an important turning point that line should not give way in my opinion. We could have an answer as soon as the trading resumes in that matter
JI
jimkane
Rep: 3,058
Posts: 33,089
That is pretty freaky...


Originally posted by jarek

Originally posted by jimkane

Nice charts, guys. Hey, jarek, you okay? Haven't seen a post from you for awhile (awhile for you), so I'm 'checking up' on you...


Our posts were just 7 sec apart. Is this telepathy or what?!?
RO
roofer
Rep: 3,689
Posts: 3,574
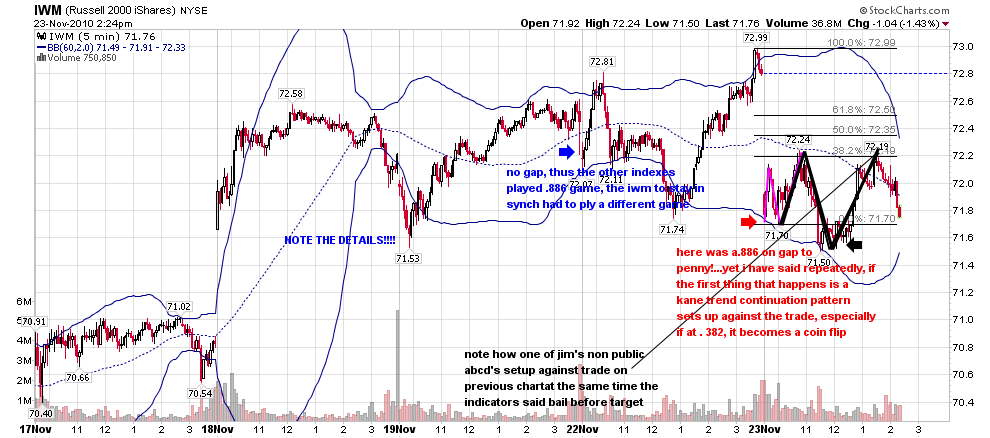
recent action in IWM has been classic based on blt, dbs, the trade .,odds on abcd at .382....the indicator setup at black line is seen often when the computers want to turn price before target is hit... let us see what happens...
Click image for original size
JI
jimkane
Rep: 3,058
Posts: 33,089
Great chart, roofer, very cool. Very cool.

Bullish 3-min EXP here, or will it dump? Fed minutes in 5.
JI
jimkane
Rep: 3,058
Posts: 33,089
Sitting right on a key area and pattern, right as a big report is about to be released. Interesting.
JI
jimkane
Rep: 3,058
Posts: 33,089
So, to stay with the short setup one would have had to ride out the report, and the wicked shakes around that smaller setup area. Now it sits right on the next key area, which also happens to be the Game Zone. It's acting like it doesn't want to go down anymore, or they want to play games with it first. Let's see. From a practical standpoint, if I took the short I'm just looking to let it breathe and see if it pays me off, or not.
RO
roofer
Rep: 3,689
Posts: 3,574
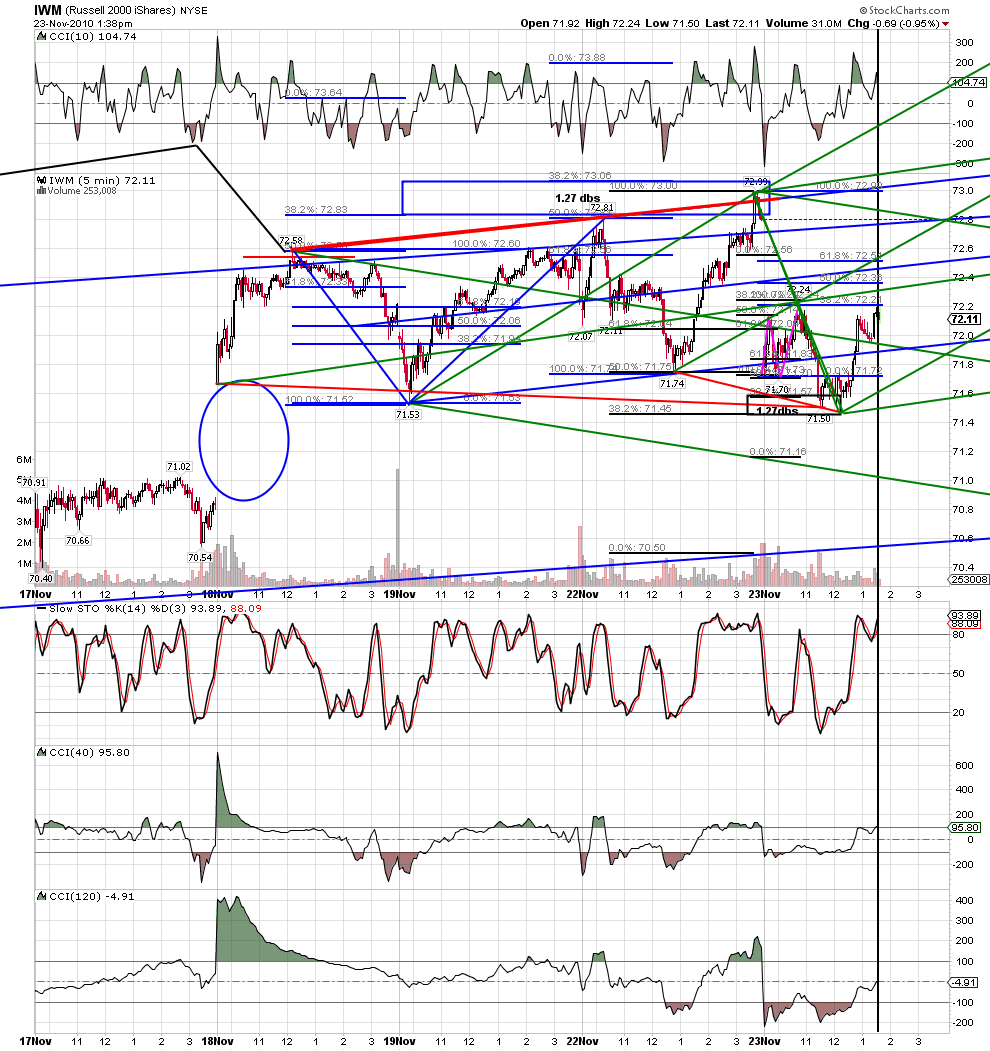
more... can you see how every action is based on predefined work?
Click image for original size
RO
roofer
Rep: 3,689
Posts: 3,574
the computers are keeping me on my toes...!!!!!
Click image for original size
JI
jimkane
Rep: 3,058
Posts: 33,089
Great stuff, roofer. Love the IWM chart.
JI
jimkane
Rep: 3,058
Posts: 33,089
Zzzzzzzzzzzzzzzzzzzzzzzzzzzz. Just dozing at the screen, waiting to see if that short side will 'pay off' or not.
RO
roofer
Rep: 3,689
Posts: 3,574
Click image for original size

Click image for original size
JI
jimkane
Rep: 3,058
Posts: 33,089
So, note my comment below "...if it isn't a fake break snap trap, which looks like a 5-wave up to boot...". That was exactly what it was, a final push 'W5' over the obvious TL to draw in a bunch of suckers, and then they dumped it. What is really noteworthy (other than this classic sucker trap snap reversal) is that it went right back to the very same TL's that sent this up on the 16th (retested multiple times on the 17th), the 23rd (retested on the 24th), and the premarket today. After all those times coming off those lines (I have two TL's and a set line almost overlaid on each other), it finishes the day/week right there again. In many cases like this, especially in pre-manipulation Mar 2009 times, this line area would give way.

Notice, also, how the 4PT did send it down after all, but now this may be a 'W2' 4PT to send it back up. Given that it is at a key line area, I'd expect a possible bounce, and then perhaps back to that downsloping TL area. The key aspect to me is that it really already did a bounce, and timewise, on say my 240-min chart, the bounce and drop into the close was very fast, and doesn't indicate the immediate need for another bounce.

Hence, it may drop right down from here, even open on a gap down. But, when do we see a Sunday gap down and drop? And if we did, has it sustained even once in well over a year? Not that I recall. So, the odds favor another bounce here based on the Sunday thing. I want the important point to be clear here, though, and that is that it is coiling ever tighter between two lines here, and a break should be soon, as the apex is getting closer and closer.


Originally posted by jimkane

1200.50 in a nice last minute burst there, right to the heart of the key area, as expected. Can't wait to see what the open brings later today, and the overnight. Because of the time it went sideways, this last move is solidly up and over the obvious TL on the say 120-min all-sessions chart. This implies to me that (if it isn't a fake break snap trap, which looks like a 5-wave up to boot) it plans to run.


Originally posted by jimkane

Okay, I guess 97.50 will be it (pretty darn close to the meat of my key area) until GLOBEX opens later...