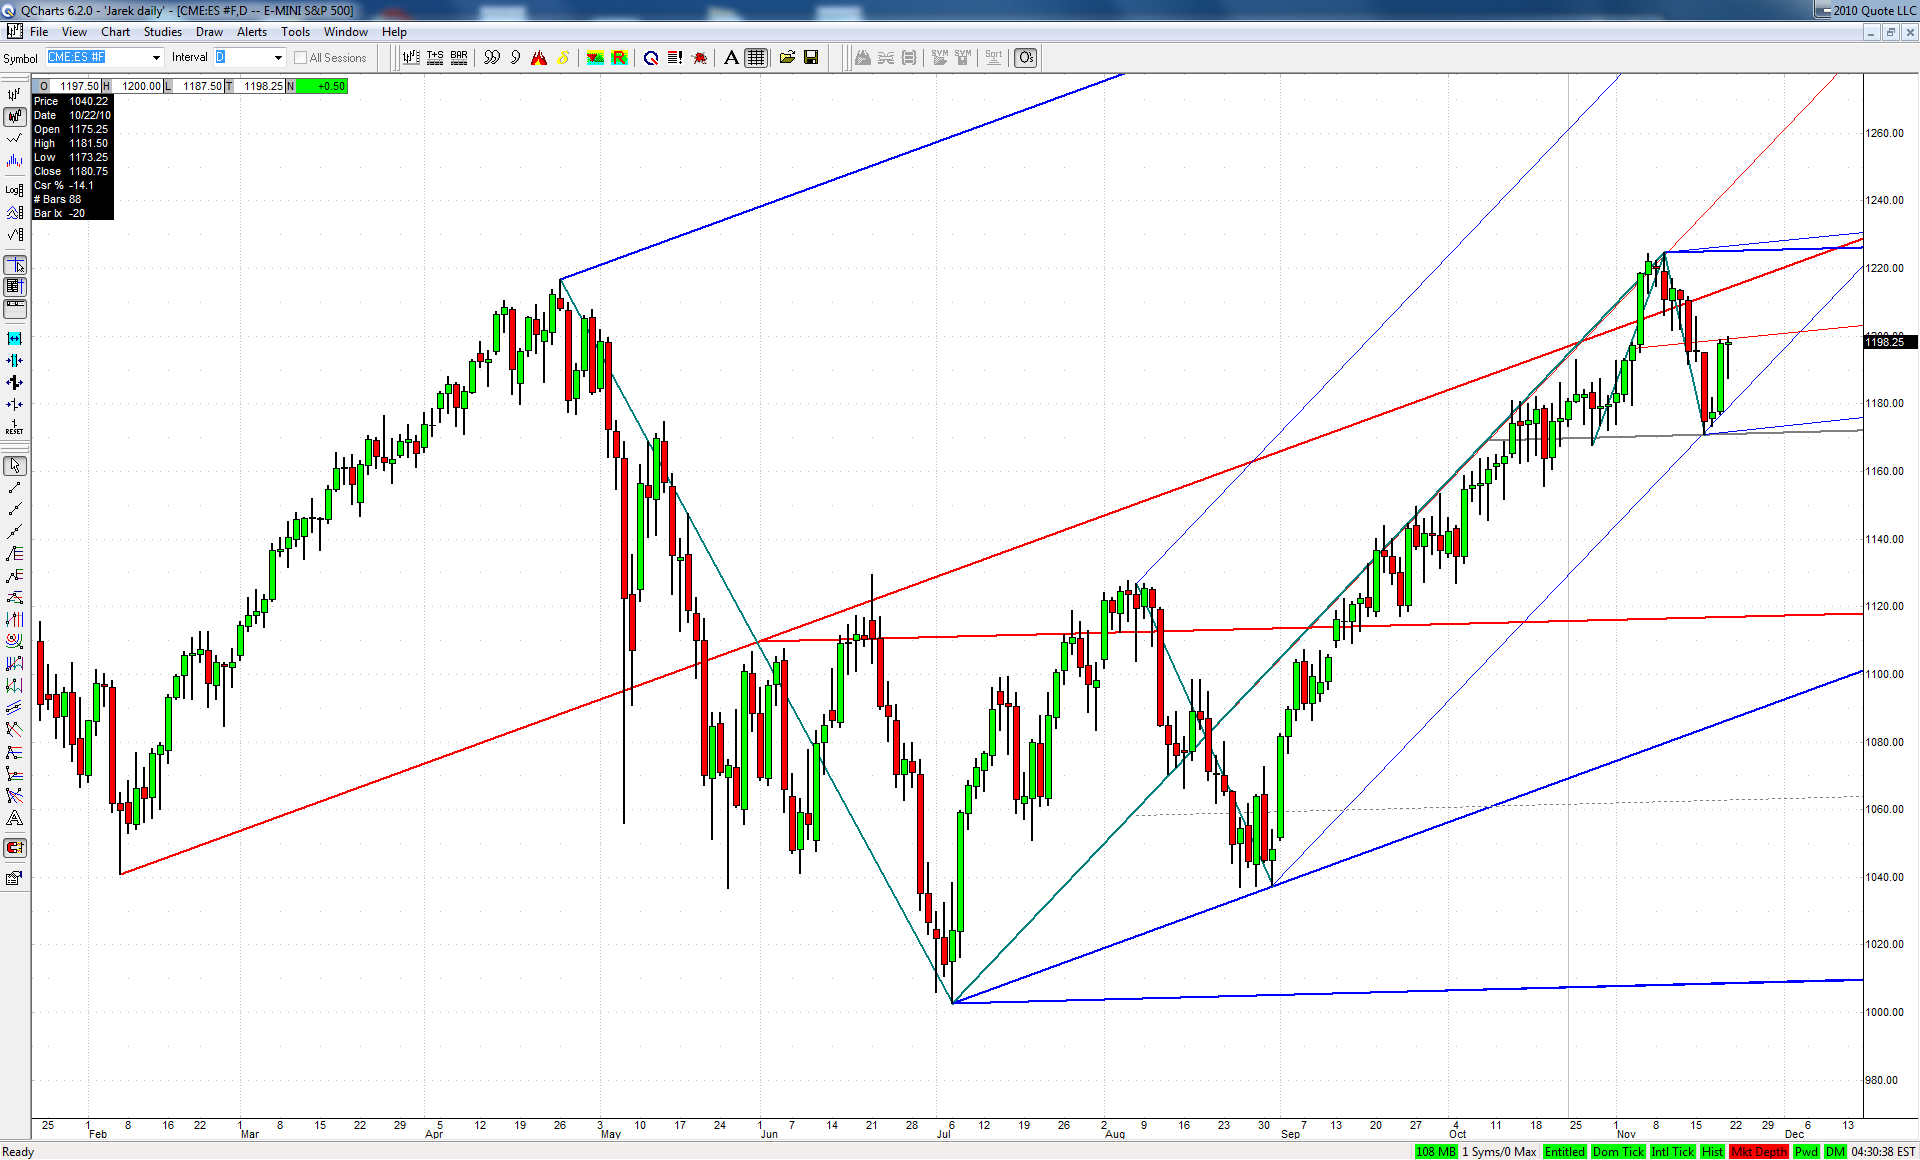
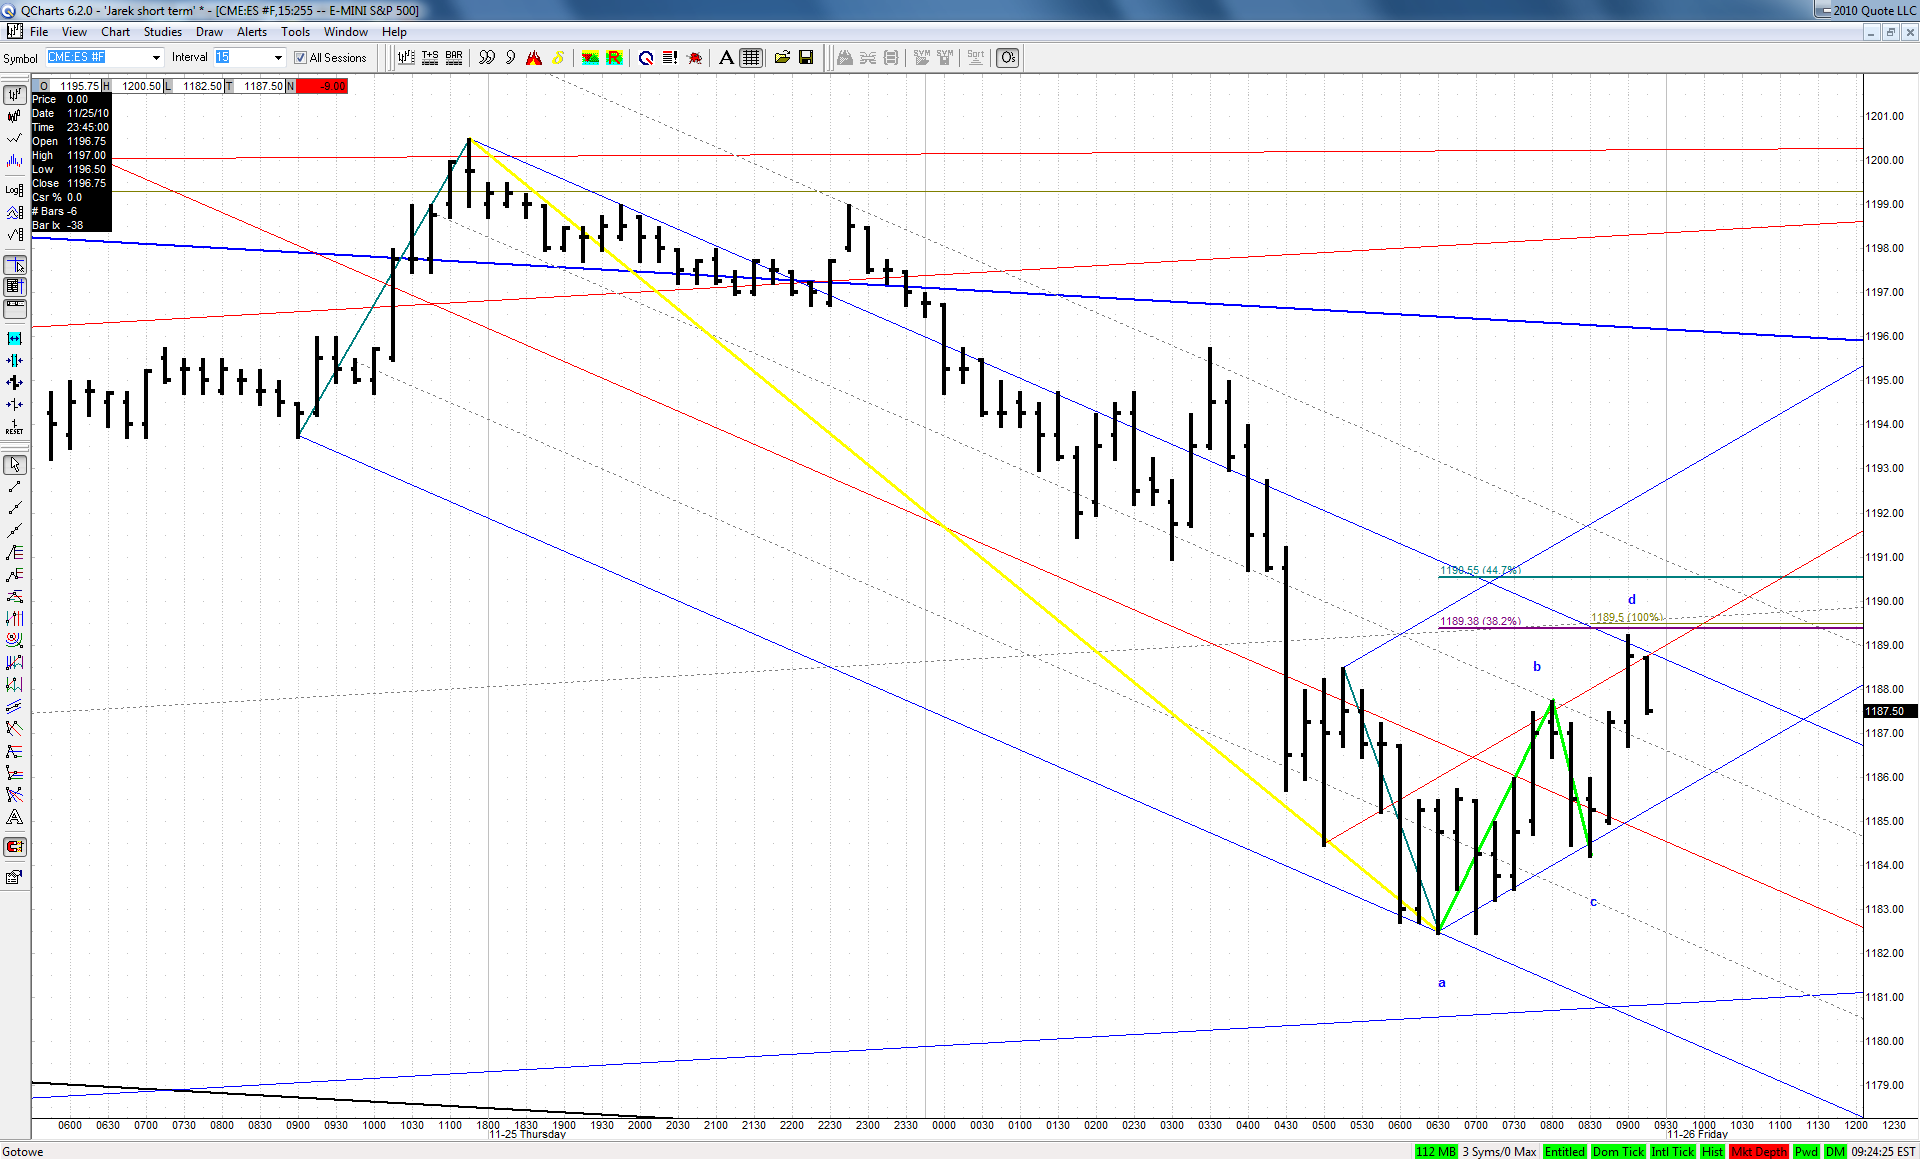
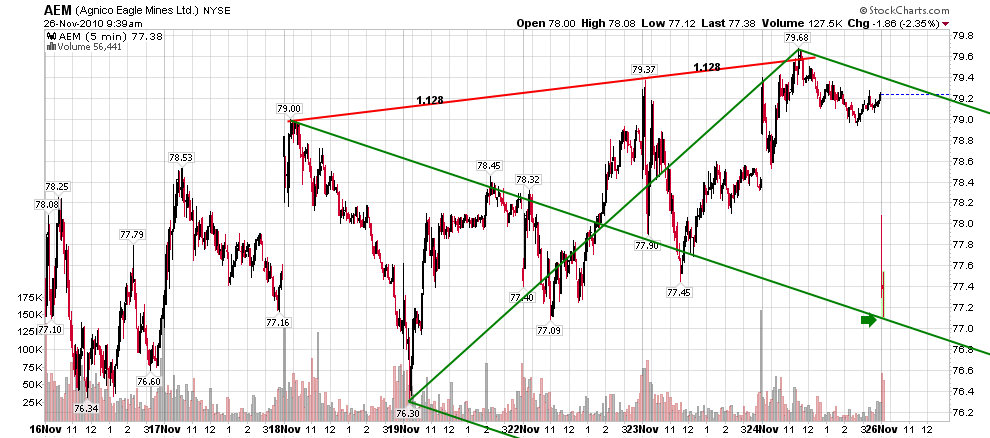
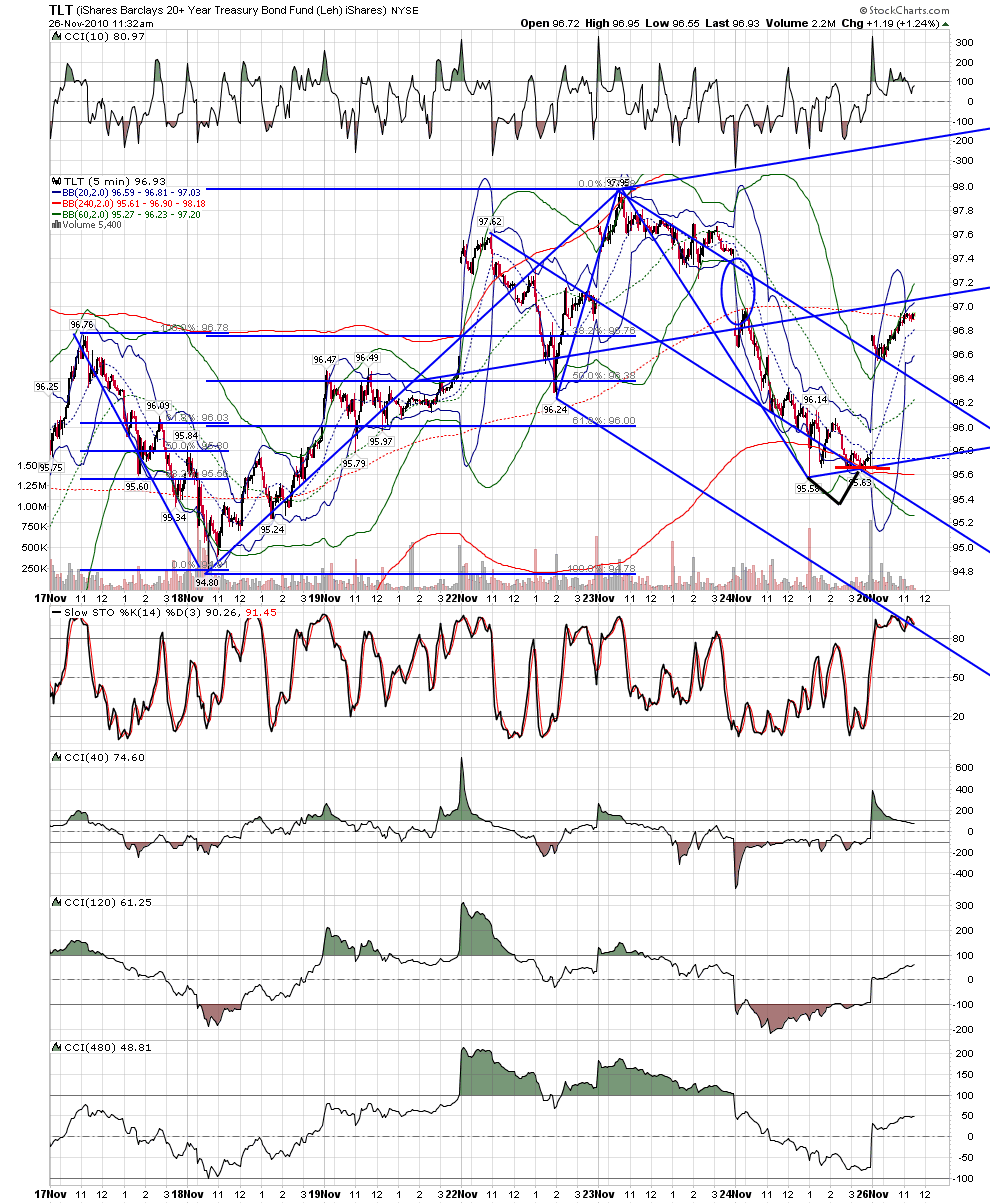
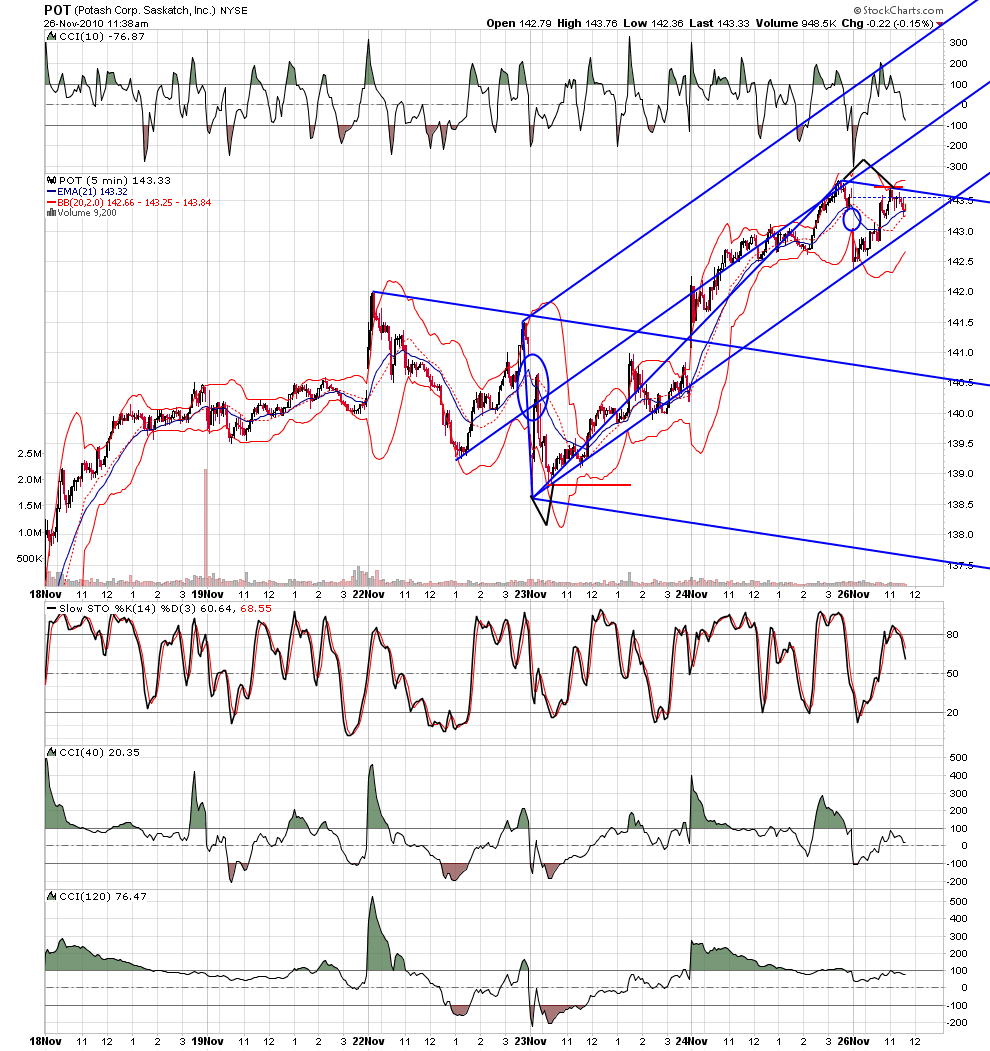
As it turns out the Tuesday low was exactly at longer term geometry - x marks the spot formed by lower ML of our upsloping set and division line of a big Schiff set anchored at Apr-Jul decline and Jul-Nov rise:
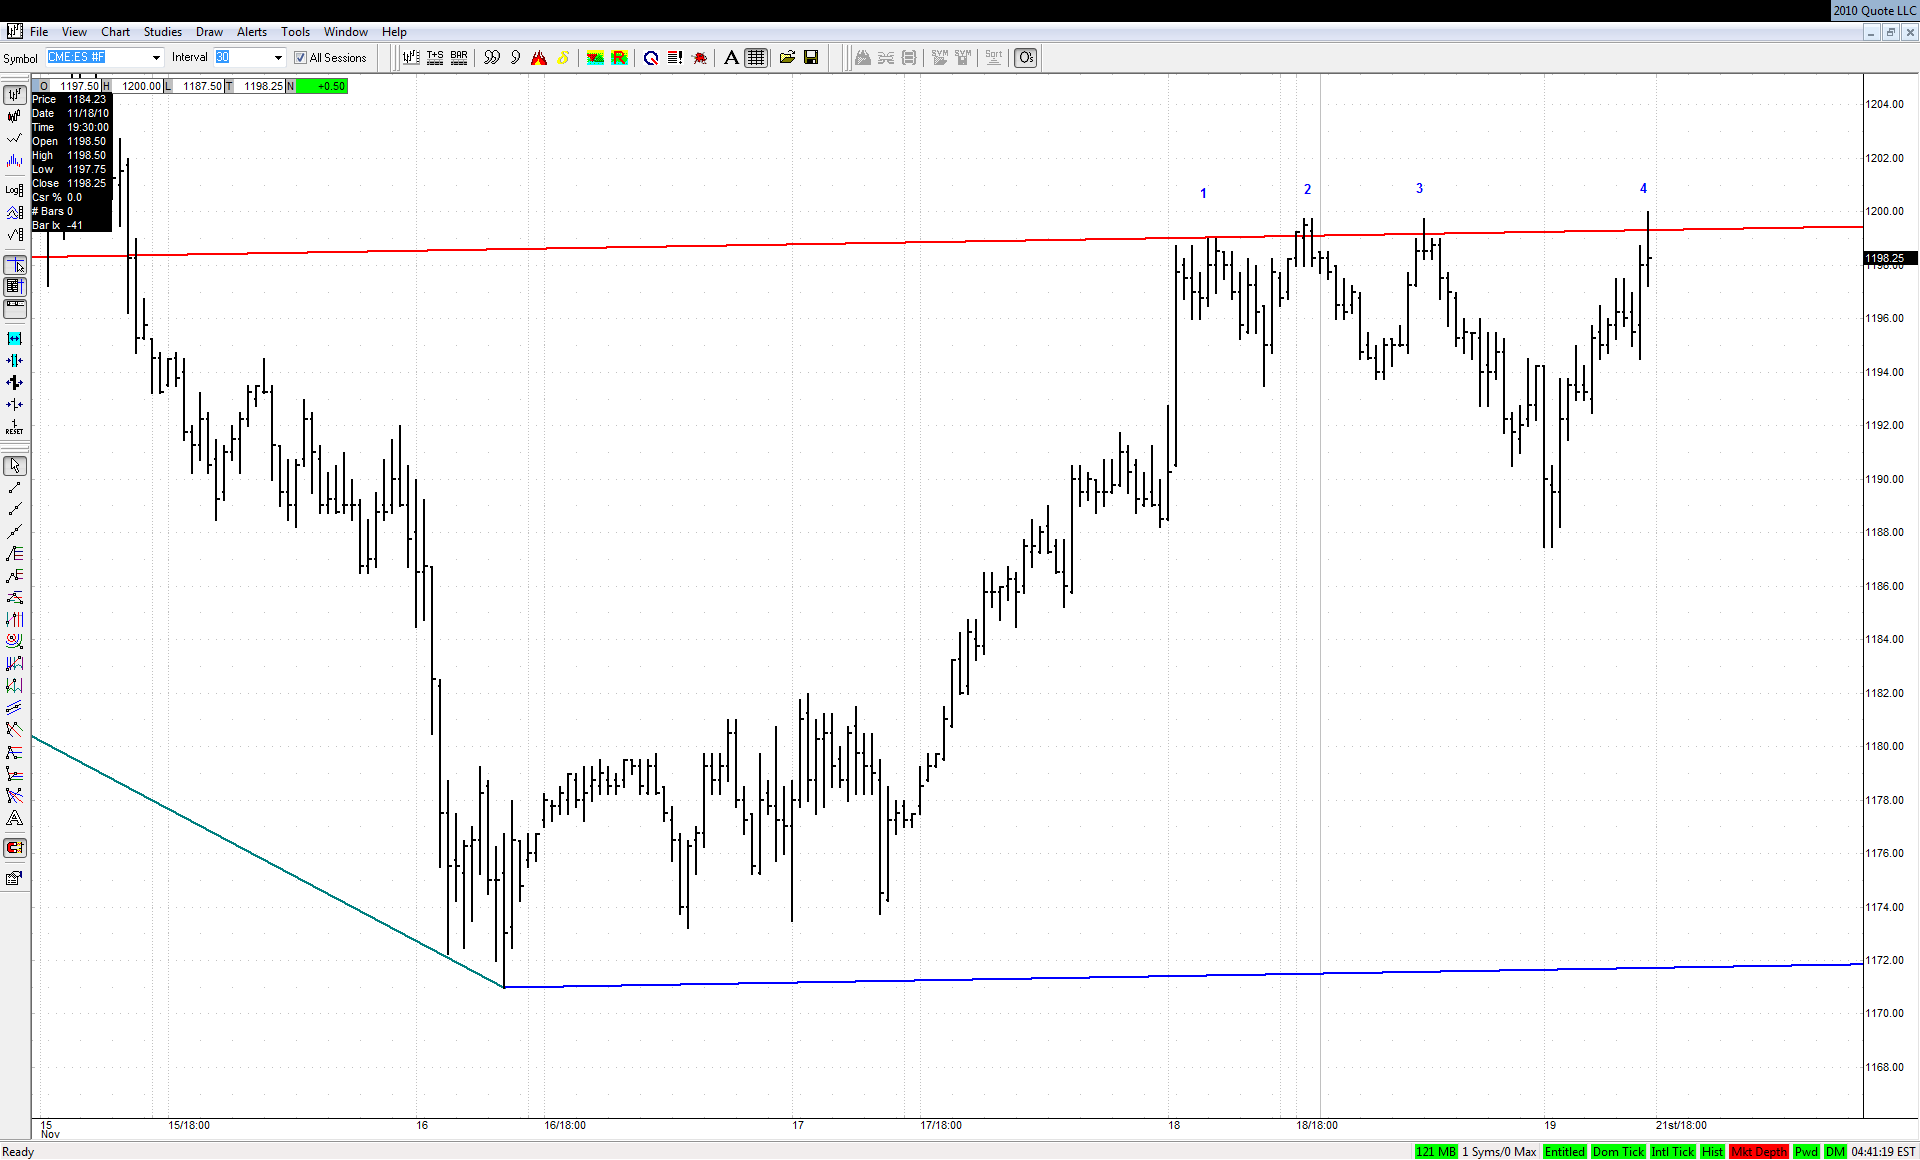
The recent bounce reached exactly the ML of a smaller Schiff set and unsuccessfully challenged it 4 times already:
If the recent top was an important turning point that line should not give way in my opinion. We could have an answer as soon as the trading resumes in that matter
TO
tomo
Rep: 110
Posts: 238
Thanks roofer for this comment. Yes anyone can charge as much as they want. I have no problem with it. My comment was only my own opinion about the cost :)
Hopefully Tim and others will go back to sharing the best stuff.
Originally posted by roofer
re market geometry-
joed called me last night as he drove out into the desert. we talked at length.we spoke again about the period of time when tim morge was trading at home in chicago and writing a 6-10 page post almost every day about his trading.we both remember being in awe and stunned into silence by the power and clarity of the writing.in all our lives,there are stretches of time when we are at the height of our powers in a certain field. this has been true in my life multiple times.. i grateful that i stumbled upon the work in that time.. how i think about medianlines is from that time ..in recent years, the work that has been shown publicly at marketgeometry has not been what was shown publicly at earlier time.
everyone has the right to charge what ever they want for their work and to present it as they see fit. i just want it clear that when i say the 3 most influential traders in my work are joedd, tim morge and jim kane that the influence from tim was from that earlier time period and that i have incorporated nothing from the recent work that has been shown...
RO
roofer
Rep: 3,689
Posts: 3,574
tomo- i was not thinking about your post; rather i was thinking about some who have paid the fee then walked away shaking their heads...
RO
roofer
Rep: 3,689
Posts: 3,574
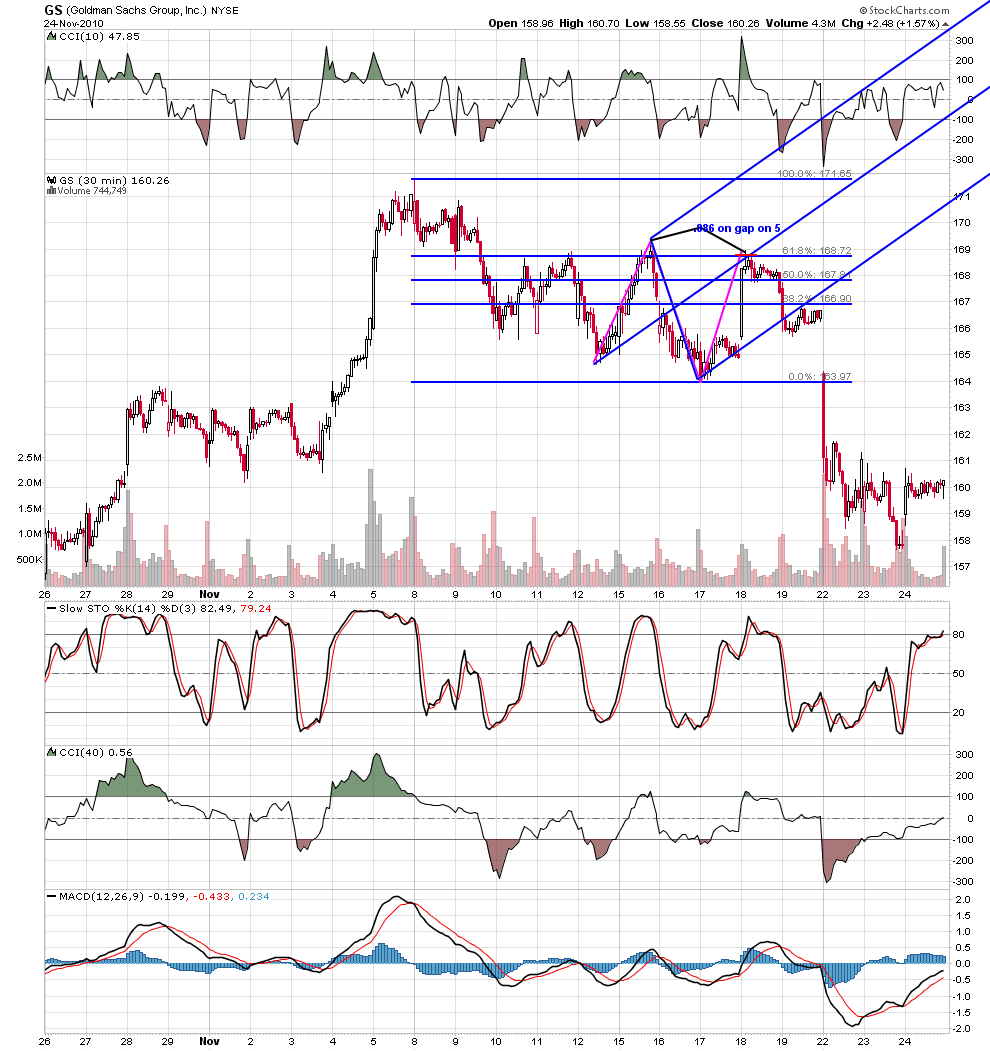
if i speak of the value of an earlier time then it behooves me to show what i mean. the work i value and use considered gaps very important and crucial to trading.. once you go to 24 hour tick charts the gaps are gone and so too is the geometry i value.my method at its best is to find the predefined trade setups at the geometry...note how clear the .886 on gap on 5 becomes when the importance of gap sets is honored.
RO
roofer
Rep: 3,689
Posts: 3,574
i enjoy reading the free area of stockbee.blogspot.com...if you read the post''why setup selection is key to reducing cognitive load'''you will see the best explanation of what i have done with the .886 on gap on 5.
JI
jimkane
Rep: 3,058
Posts: 33,089
So, note my comment below "...if it isn't a fake break snap trap, which looks like a 5-wave up to boot...". That was exactly what it was, a final push 'W5' over the obvious TL to draw in a bunch of suckers, and then they dumped it. What is really noteworthy (other than this classic sucker trap snap reversal) is that it went right back to the very same TL's that sent this up on the 16th (retested multiple times on the 17th), the 23rd (retested on the 24th), and the premarket today. After all those times coming off those lines (I have two TL's and a set line almost overlaid on each other), it finishes the day/week right there again. In many cases like this, especially in pre-manipulation Mar 2009 times, this line area would give way.
Notice, also, how the 4PT did send it down after all, but now this may be a 'W2' 4PT to send it back up. Given that it is at a key line area, I'd expect a possible bounce, and then perhaps back to that downsloping TL area. The key aspect to me is that it really already did a bounce, and timewise, on say my 240-min chart, the bounce and drop into the close was very fast, and doesn't indicate the immediate need for another bounce.
Hence, it may drop right down from here, even open on a gap down. But, when do we see a Sunday gap down and drop? And if we did, has it sustained even once in well over a year? Not that I recall. So, the odds favor another bounce here based on the Sunday thing. I want the important point to be clear here, though, and that is that it is coiling ever tighter between two lines here, and a break should be soon, as the apex is getting closer and closer.
Originally posted by jimkane
1200.50 in a nice last minute burst there, right to the heart of the key area, as expected. Can't wait to see what the open brings later today, and the overnight. Because of the time it went sideways, this last move is solidly up and over the obvious TL on the say 120-min all-sessions chart. This implies to me that (if it isn't a fake break snap trap, which looks like a 5-wave up to boot) it plans to run.
Originally posted by jimkane
Okay, I guess 97.50 will be it (pretty darn close to the meat of my key area) until GLOBEX opens later...