ES short term trading 1-19-11
Without question the key zone to watch is 90.50 - 92 that includes pivot numbers, the breakout from yesterday late in the day, MP numbers, the close clusters, O/N low and last weeks highs
above that is 96 - 98 area...yd highs and R1 area...
what I'm leaning towards is selling try and target all those left over triples from yesterday ultimately but making sure we start taking something off in front of that key zone....so basically sells above 92 ...will watch volume and $tick as usual
I still feel good about the 1282 support but was a little early in my entry ... i will be exiting around break even (1283.75-1284.00), hoping to get in at a better price (1282.50 or below) (ps: if wrong i still have next good support around 1277.50)
still in my long from 1284.00.. tried to exit 1283.75 but they never filled me! ugh! Using the usual stop (3 handles) and very close to being stopped out....
Click image for original size
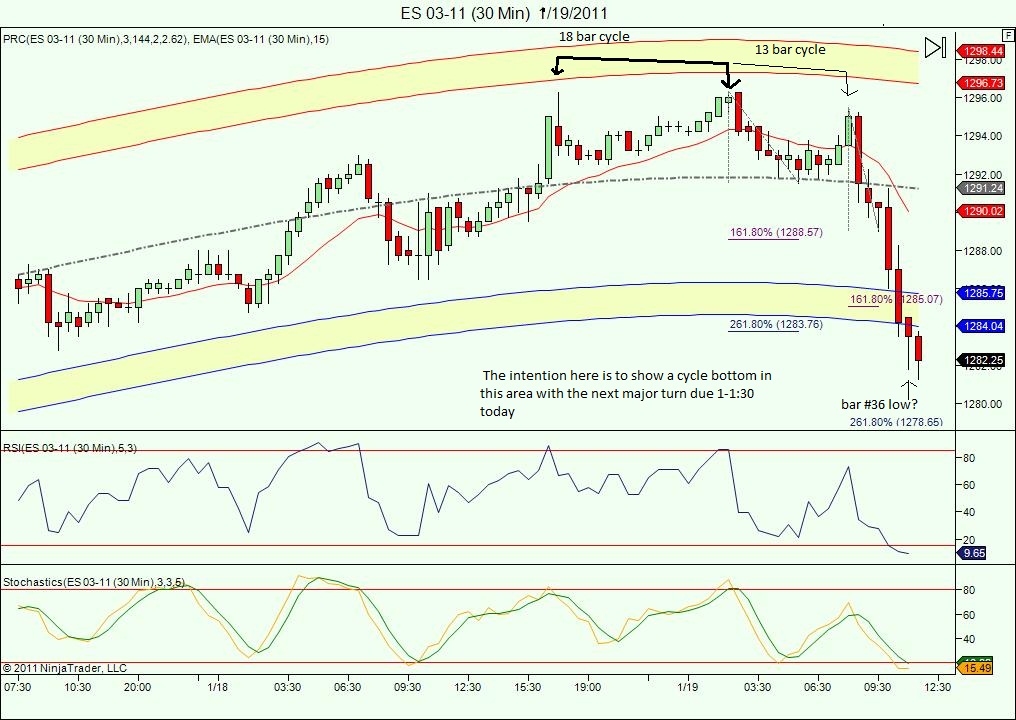
Originally posted by WSES is trying to find support here near yesterday's low. I like for it to move down and test the recent low 1281.25, or at list move down near it. If finding support in this area I will go long over 1282.75 (yesterday's low) and the objective will be the PP.
Notice that ES is zig-zagging as usual at a important support area, as it is yesterday's low.
If the ES was to move above 1285,75, then the PvP will be the objective.
Below, the failure point for the test as support (zig-zags room to oscillate) will be 1279.75 and will target 1274/1275 area.
ES trading 1283.50 @ 10:58
The stp will be at 1280.75.
ES trading @ 1282.575 11:44
Will see, in due time the market will show me the way.
Still long.. Anybody who got long below 1282.50, i personally would hold. You got a decent risk reward there and can use a tighter stop!... good luck all!
Finally, filled at 1283.75 loss of two ticks.. trying for re-entry below 1282.50!
Ok, long again from 1282.50.. here we go again!
Originally posted by einsteinHaven't traded crude lately .. as far as risk reward... it is not intentional believe me! First i almost always use an initial 3 point stop whwn i initiate a trade, . this is simply to protect against an unforseen event ,while i take 2 or 3 min to study the initial move developing in order to get a better handle on an objective for exit . the above trade, btw, if it had turned at 1284 as originally hoped, i would have been taking one off sround 1285 something and holding the other for much higher! (and would have instantly raised my stop to just below 1284!) . In the long i just took for instance, my 3 point stop is already raised to 1281.00 giving a risk of 1.5 handles , looking to take at least one off at around 1285... Great question btw!
Hi Kool. Been lurking here and there-just trading very partime. When you have time I was interested in knowing the following:
1) are you still trading crude oil?
2) your risk/reward ratio seems to be the opposite of what everyone else teaches. For example you often use a 3 point stop and exit at 1.75or 2 handles. On the other hand you seem to be succesful overall. Just wondering how you can be profitable in the long run with that type of risk/reward? Good trading!
I know its crazy, Einstein, but even tho it only takes a few min to do my initial study after entering a trade, i always imagine the Pres. gettin shot or something equally horrible and the market tanking 20 handles in a few seconds! So ,in summary, i want SOME stop in place at ALL TIMES! There is a story behind why i chose 3 handles i'll share at some later date if your curious!
Ugh!.. stopped at 1281.00 loss of 3 handles total!...watching for 1277.50-1278.50
Originally posted by toaksiethey're called polynomial regression cycle bands. I'd be happy to send it to you but it only works on ninjatrader.
How do you get the arching bands on your charts kool?
Emini Day Trading /
Daily Notes /
Forecast /
Economic Events /
Search /
Terms and Conditions /
Disclaimer /
Books /
Online Books /
Site Map /
Contact /
Privacy Policy /
Links /
About /
Day Trading Forum /
Investment Calculators /
Pivot Point Calculator /
Market Profile Generator /
Fibonacci Calculator /
Mailing List /
Advertise Here /
Articles /
Financial Terms /
Brokers /
Software /
Holidays /
Stock Split Calendar /
Mortgage Calculator /
Donate
Copyright © 2004-2023, MyPivots. All rights reserved.
Copyright © 2004-2023, MyPivots. All rights reserved.