ES Short Term Trading 2-11-11
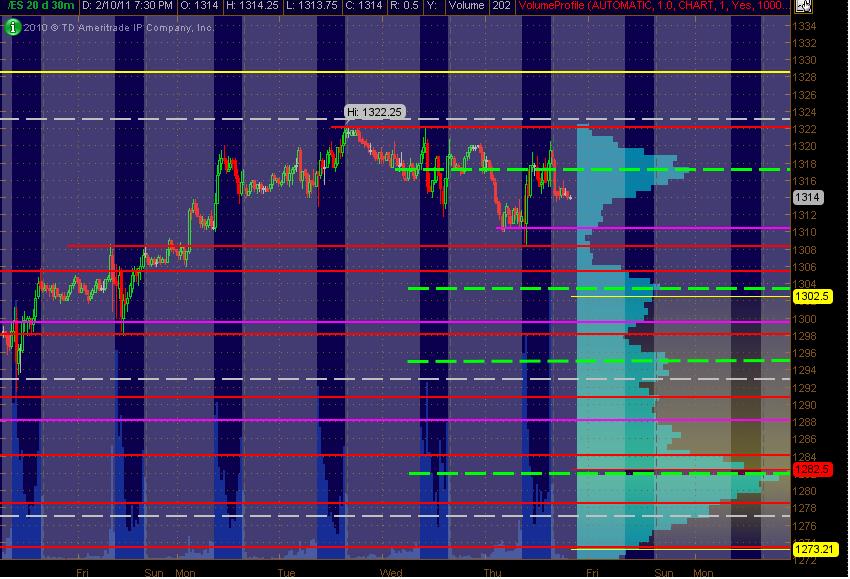
Here's my ES 30min chart with 20 days of Volume Profile vertically displayed on the right side of the chart. The Green Dashed lines are simply the HVN prices. The PASR levels are the Red lines as potentially significant with the Magenta lines as potentially semi-significant. The Yellow line above price is a multi-fib cluster area fwiw. [the grey areas are the "overnight" session, not RTH] This is simply a MAP for going into Friday's trading. Hope it's helpful!
MM
Click image for original size
MM
OOPS ... forgot to mention that the White Dashed lines are merely the Weekly Pivots from DT's mypivots site -- good stuff!
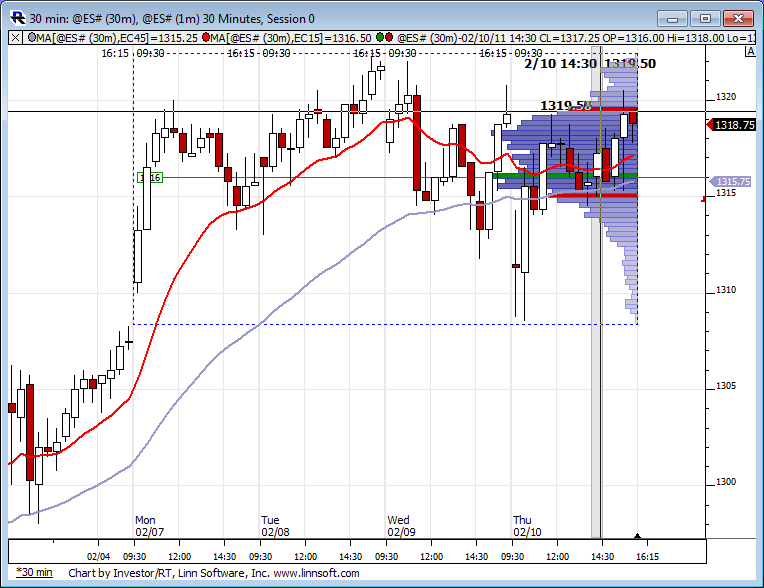
Well, well. This is the theme for the week. Bell curve volume profile. At some point this range will be left behind, the question is which direction?
Click image for original size
Click image for original size
One off at 1313.50, plus 1.75 there, holding the runner for 1312.25 exit(expecting 1311.75)
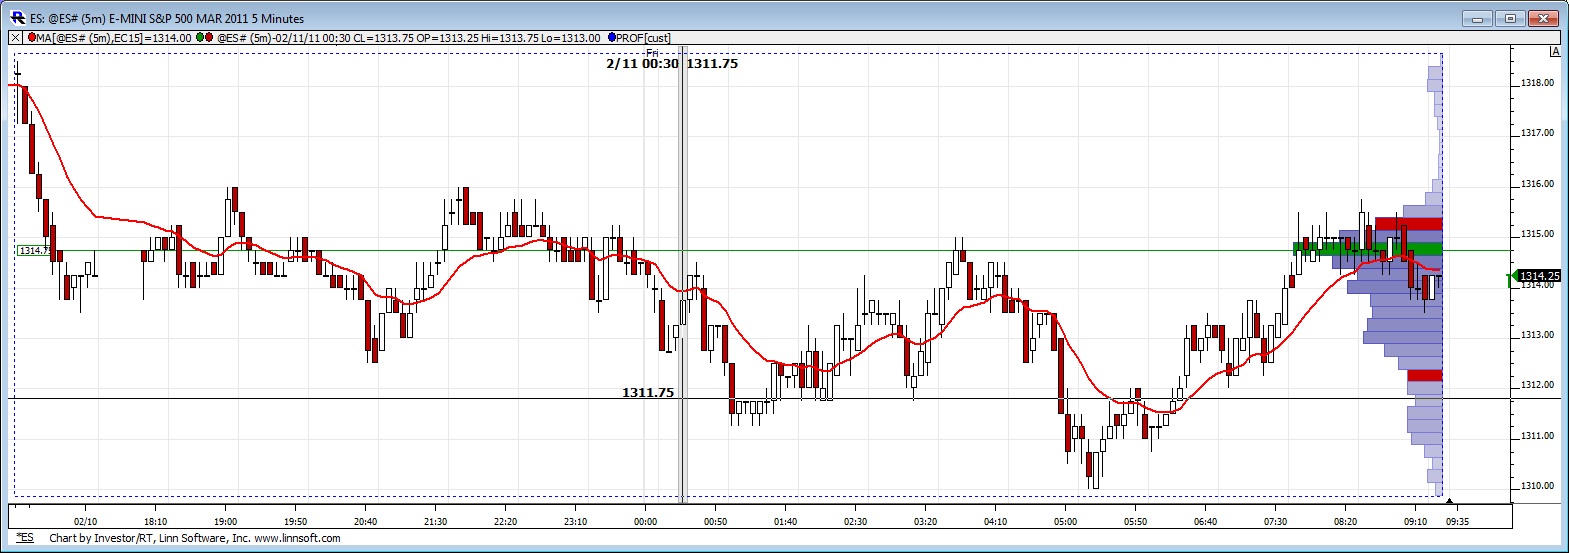
Normally, i hate carrying a position into the rth open, but ive lowered my stop on the runner to breakeven (1315.25) so i have no risk here..
the two highest volume bars from YD are at 1309 and 1318....they like to test those. they match up with some of your numbers
LOL...They must have heard me.. stopped on the runner,up 1.75 on the day..watching (have to run momma to work in about 15 min as always on Friday, but i'll be back later in the morning.)
Originally posted by BruceMI noticed that,Bruce... i tend to think 18 would be a decent short as i still think 1306 is possible ( Kools calendar has a conventional cycle low due Mon)
the two highest volume bars from YD are at 1309 and 1318....they like to test those. they match up with some of your numbers
Originally posted by koolblueIt should be noted 1318.50 is the on high and daily notes page shows yesterdays range was 12 handles, and 5 day avg around 11.25! That means to me , if today is a normal day, and the 1318.50 high holds as i suspect, 1318.50-12= bingo!! 1306.50
Originally posted by BruceMInoticed that,Bruce... i tend to think 18 would be a decent short as i still think 1306 is possible ( Kools calendar has a conventional cycle low due Mon)
the two highest volume bars from YD are at 1309 and 1318....they like to test those. they match up with some of your numbers
yes Lorn but the context of the day isn't there to take the fade
Emini Day Trading /
Daily Notes /
Forecast /
Economic Events /
Search /
Terms and Conditions /
Disclaimer /
Books /
Online Books /
Site Map /
Contact /
Privacy Policy /
Links /
About /
Day Trading Forum /
Investment Calculators /
Pivot Point Calculator /
Market Profile Generator /
Fibonacci Calculator /
Mailing List /
Advertise Here /
Articles /
Financial Terms /
Brokers /
Software /
Holidays /
Stock Split Calendar /
Mortgage Calculator /
Donate
Copyright © 2004-2023, MyPivots. All rights reserved.
Copyright © 2004-2023, MyPivots. All rights reserved.