ES Short Term Trading 2-11-11
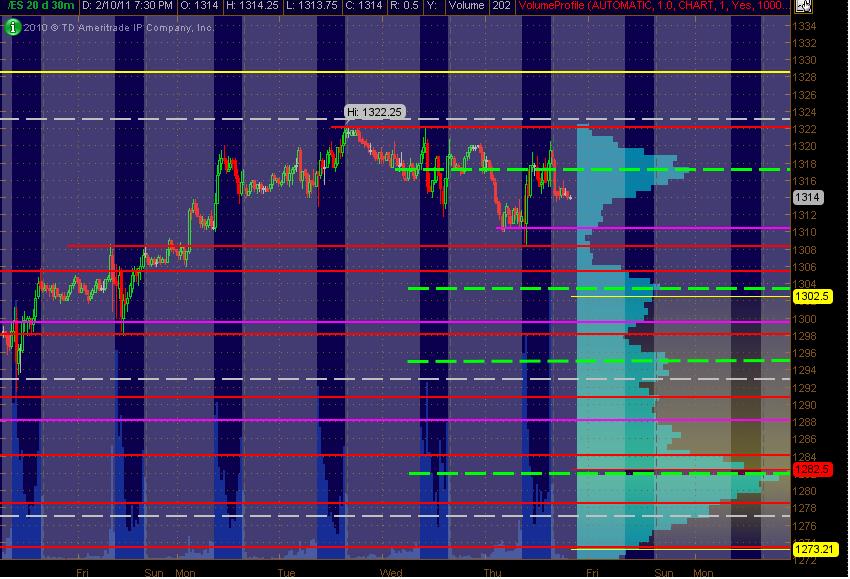
Here's my ES 30min chart with 20 days of Volume Profile vertically displayed on the right side of the chart. The Green Dashed lines are simply the HVN prices. The PASR levels are the Red lines as potentially significant with the Magenta lines as potentially semi-significant. The Yellow line above price is a multi-fib cluster area fwiw. [the grey areas are the "overnight" session, not RTH] This is simply a MAP for going into Friday's trading. Hope it's helpful!
MM
Click image for original size
MM
no surprise Mike but most see that without trading it....it's always easy to see a move AFTER it happens......you've posted after the fact stuff before which is fine by me but it would be more impressive if you told us what you were thinking of doing BEFORE it happens...
You could have mentioned that point 2 or 3 hours BEFORE the retrace.....as a heads up to others...just to be nice....
I hear ya though...we don't need to overcomplicate things
You could have mentioned that point 2 or 3 hours BEFORE the retrace.....as a heads up to others...just to be nice....
I hear ya though...we don't need to overcomplicate things
You are right Bruce, I faded 1319.75 for 1.5 loss and wasn't happy. At that point the only trade (for me) was to play 1320.50 as support. You guys do such a great job laying the day out, I will try to be more timely.
Good trading, all.
Good trading, all.
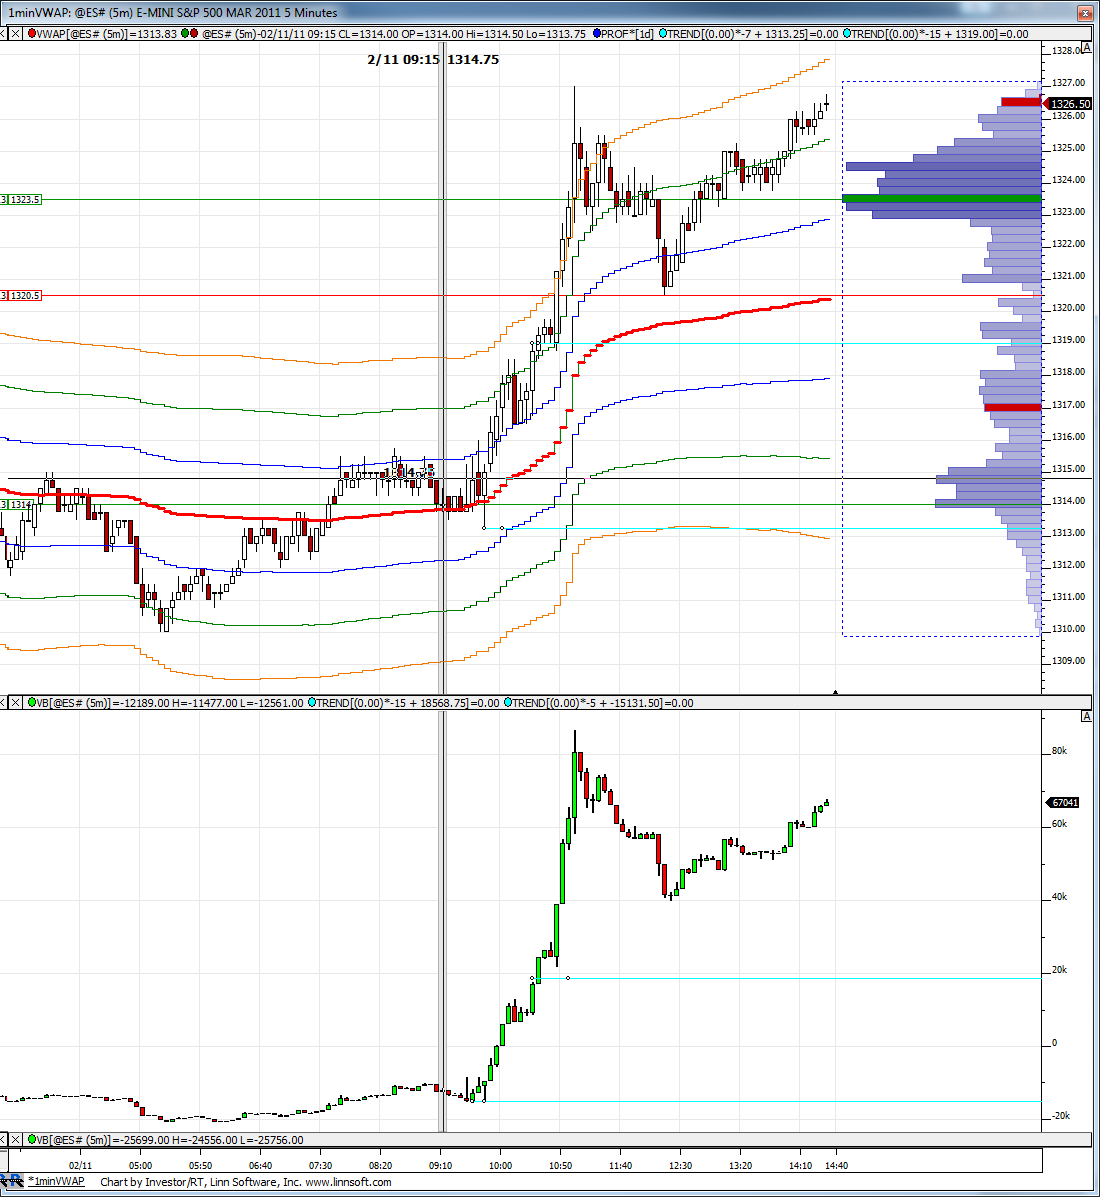
Here is a look at the current divergence in price to CD. You can see overall its an extremely bullish bias today with +75k contracts. Can they keep buying it up?
Click image for original size
I see two sets of trips on the board Bruce...
yes Lorn but the context of the day isn't there to take the fade
Emini Day Trading /
Daily Notes /
Forecast /
Economic Events /
Search /
Terms and Conditions /
Disclaimer /
Books /
Online Books /
Site Map /
Contact /
Privacy Policy /
Links /
About /
Day Trading Forum /
Investment Calculators /
Pivot Point Calculator /
Market Profile Generator /
Fibonacci Calculator /
Mailing List /
Advertise Here /
Articles /
Financial Terms /
Brokers /
Software /
Holidays /
Stock Split Calendar /
Mortgage Calculator /
Donate
Copyright © 2004-2023, MyPivots. All rights reserved.
Copyright © 2004-2023, MyPivots. All rights reserved.