ES Short Term Trading 2-11-11
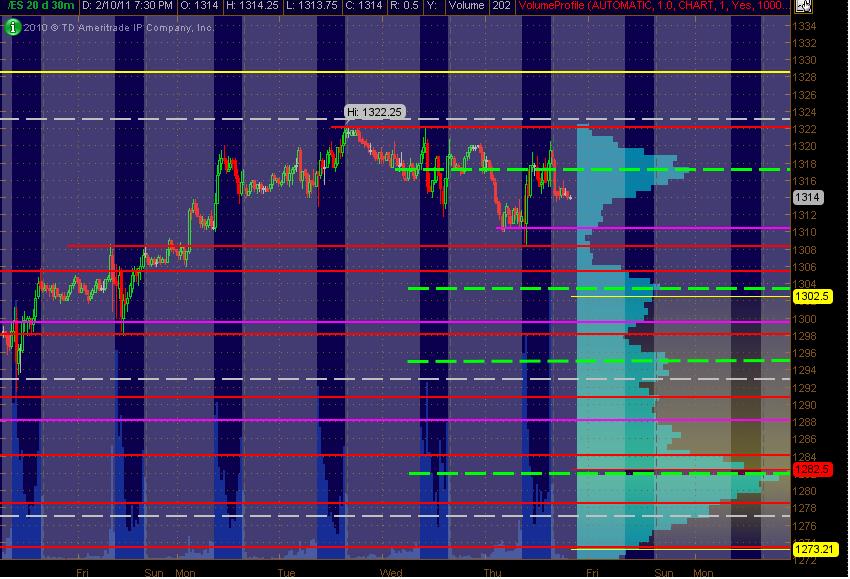
Here's my ES 30min chart with 20 days of Volume Profile vertically displayed on the right side of the chart. The Green Dashed lines are simply the HVN prices. The PASR levels are the Red lines as potentially significant with the Magenta lines as potentially semi-significant. The Yellow line above price is a multi-fib cluster area fwiw. [the grey areas are the "overnight" session, not RTH] This is simply a MAP for going into Friday's trading. Hope it's helpful!
MM
Click image for original size
MM
flat at 23.25....I added on the way back down at the 25 RAT. Will try again on a new pop up above 25 if it comes
Originally posted by BruceMdown 2.25 on the day, but i smell a good short up here ..i gree with your sell around 25 pal.. i'll be there too!!
flat at 23.25....I added on the way back down at the 25 RAT. Will try again on a new pop up above 25 if it comes
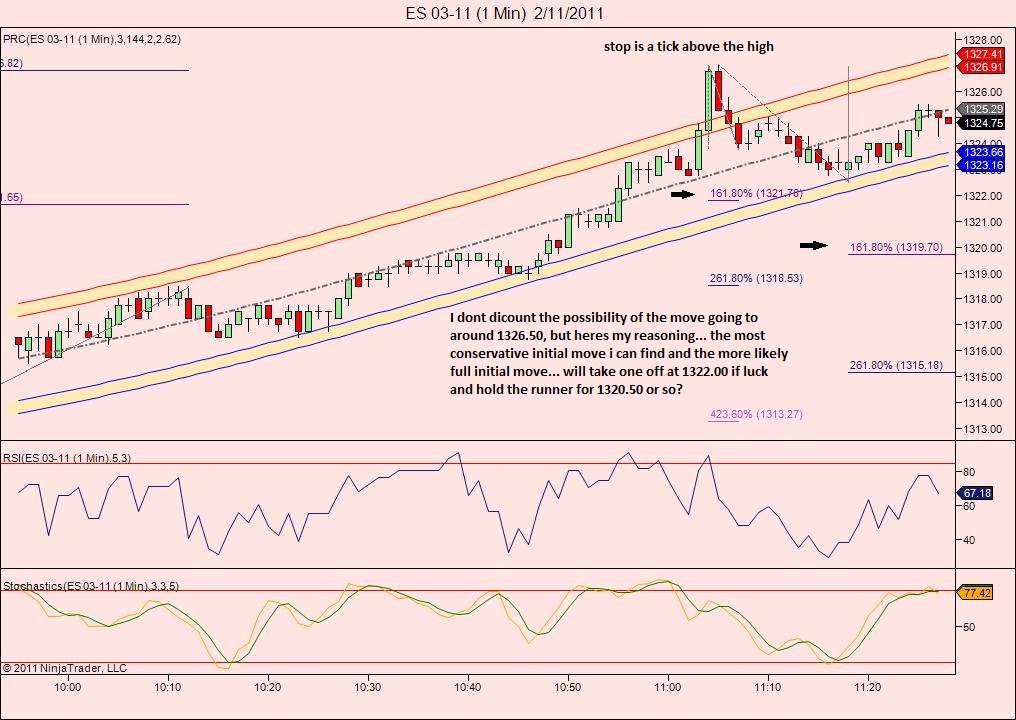
the initial one min move (1322.50to 1324.00) gives 1325.00 and 1326.50.. pick yer spots gentlemen (of course any touch of 1322.50 negates it)
short at 1325.25, looking and praying for a retrace to around 1319.75!
I'm with ya Kool but am prepared to add above at new highs....we need to get a retest of a previous low still...so going lighter in case the new highs come
2 sets of single prints now ...will they do a third?
2 sets of single prints now ...will they do a third?
Click image for original size
previous 30 minute low is at 22.50 so that has to be target...have 3 on...so will take all off IF it prints...I have a feeling we may still run up one more bar...hope I'm wrong but they like to test volume extremes!!
$ticks showing no selling at all now.......be careful
All i know is these exteme news driven moves,whether up or down ,dont last long and are often followed by a decent reveral move... i hope!...lol
red avg on the 5 min (always a magnet ) is at 1322.16
yes Lorn but the context of the day isn't there to take the fade
Emini Day Trading /
Daily Notes /
Forecast /
Economic Events /
Search /
Terms and Conditions /
Disclaimer /
Books /
Online Books /
Site Map /
Contact /
Privacy Policy /
Links /
About /
Day Trading Forum /
Investment Calculators /
Pivot Point Calculator /
Market Profile Generator /
Fibonacci Calculator /
Mailing List /
Advertise Here /
Articles /
Financial Terms /
Brokers /
Software /
Holidays /
Stock Split Calendar /
Mortgage Calculator /
Donate
Copyright © 2004-2023, MyPivots. All rights reserved.
Copyright © 2004-2023, MyPivots. All rights reserved.