ES Short Term Trading 2-11-11
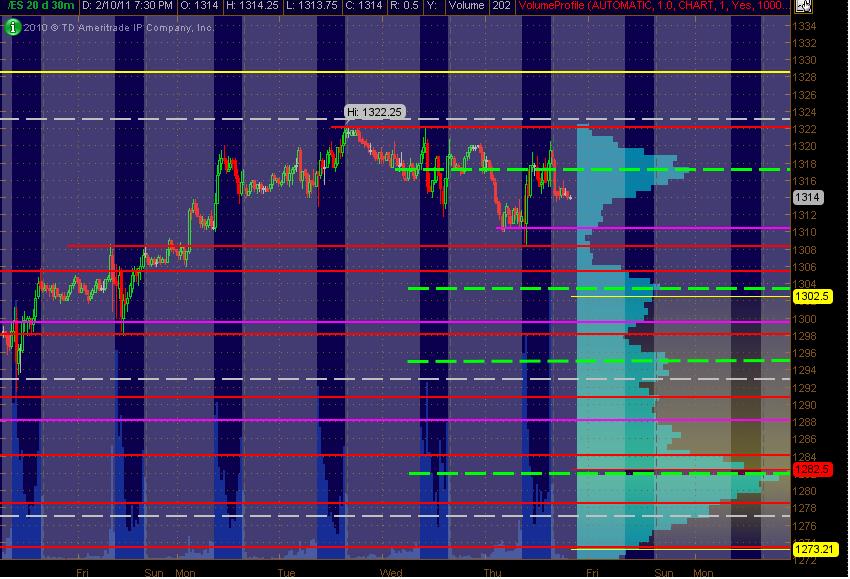
Here's my ES 30min chart with 20 days of Volume Profile vertically displayed on the right side of the chart. The Green Dashed lines are simply the HVN prices. The PASR levels are the Red lines as potentially significant with the Magenta lines as potentially semi-significant. The Yellow line above price is a multi-fib cluster area fwiw. [the grey areas are the "overnight" session, not RTH] This is simply a MAP for going into Friday's trading. Hope it's helpful!
MM
Click image for original size
MM
Originally posted by koolblueKools projection up is 1318.50-75 and c=a at 1319.00! ..gotta run..good luck!
Originally posted by koolblueIt should be noted 1318.50 is the on high and daily notes page shows yesterdays range was 12 handles, and 5 day avg around 11.25! That means to me , if today is a normal day, and the 1318.50 high holds as i suspect, 1318.50-12= bingo!! 1306.50
Originally posted by BruceMInoticed that,Bruce... i tend to think 18 would be a decent short as i still think 1306 is possible ( Kools calendar has a conventional cycle low due Mon)
the two highest volume bars from YD are at 1309 and 1318....they like to test those. they match up with some of your numbers
Wow!,just got back. This went further than i had imagined!..selling 1321.50
got my short at 1322.00 ,
it seems to go higher. i'm selling now at 23 (my sell pivot at 24) and add near 27(R2)
short 23.50....gonna be tricky ..llok at those closes
Full Kools Tools projection from 1310 GLBX low to 1315.75 = 1325.0
Mubarak has waived right to presidency
i see that.. stopped at 1324.00 loss of 2 handles(on two es)..ugh will re try at 1326.50
Click image for original size
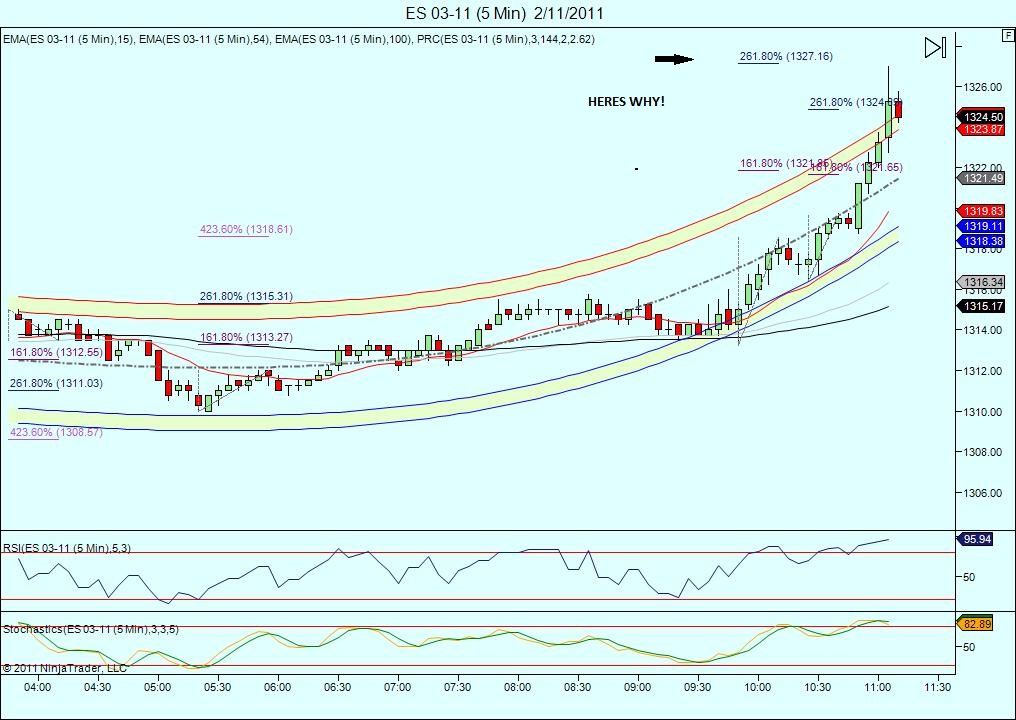
Well i guess i can take some solace in the fact that 1318.50 was a good scalp, but id be lying if i didnt say i never saw this much strength coming! Still think it'll be short lived tho!
yes Lorn but the context of the day isn't there to take the fade
Emini Day Trading /
Daily Notes /
Forecast /
Economic Events /
Search /
Terms and Conditions /
Disclaimer /
Books /
Online Books /
Site Map /
Contact /
Privacy Policy /
Links /
About /
Day Trading Forum /
Investment Calculators /
Pivot Point Calculator /
Market Profile Generator /
Fibonacci Calculator /
Mailing List /
Advertise Here /
Articles /
Financial Terms /
Brokers /
Software /
Holidays /
Stock Split Calendar /
Mortgage Calculator /
Donate
Copyright © 2004-2023, MyPivots. All rights reserved.
Copyright © 2004-2023, MyPivots. All rights reserved.