MyPivots
Sign In
JA
jarek
Rep: 94
Posts: 3,474
Welcome back everybody! Good to see so much activity and some new faces here


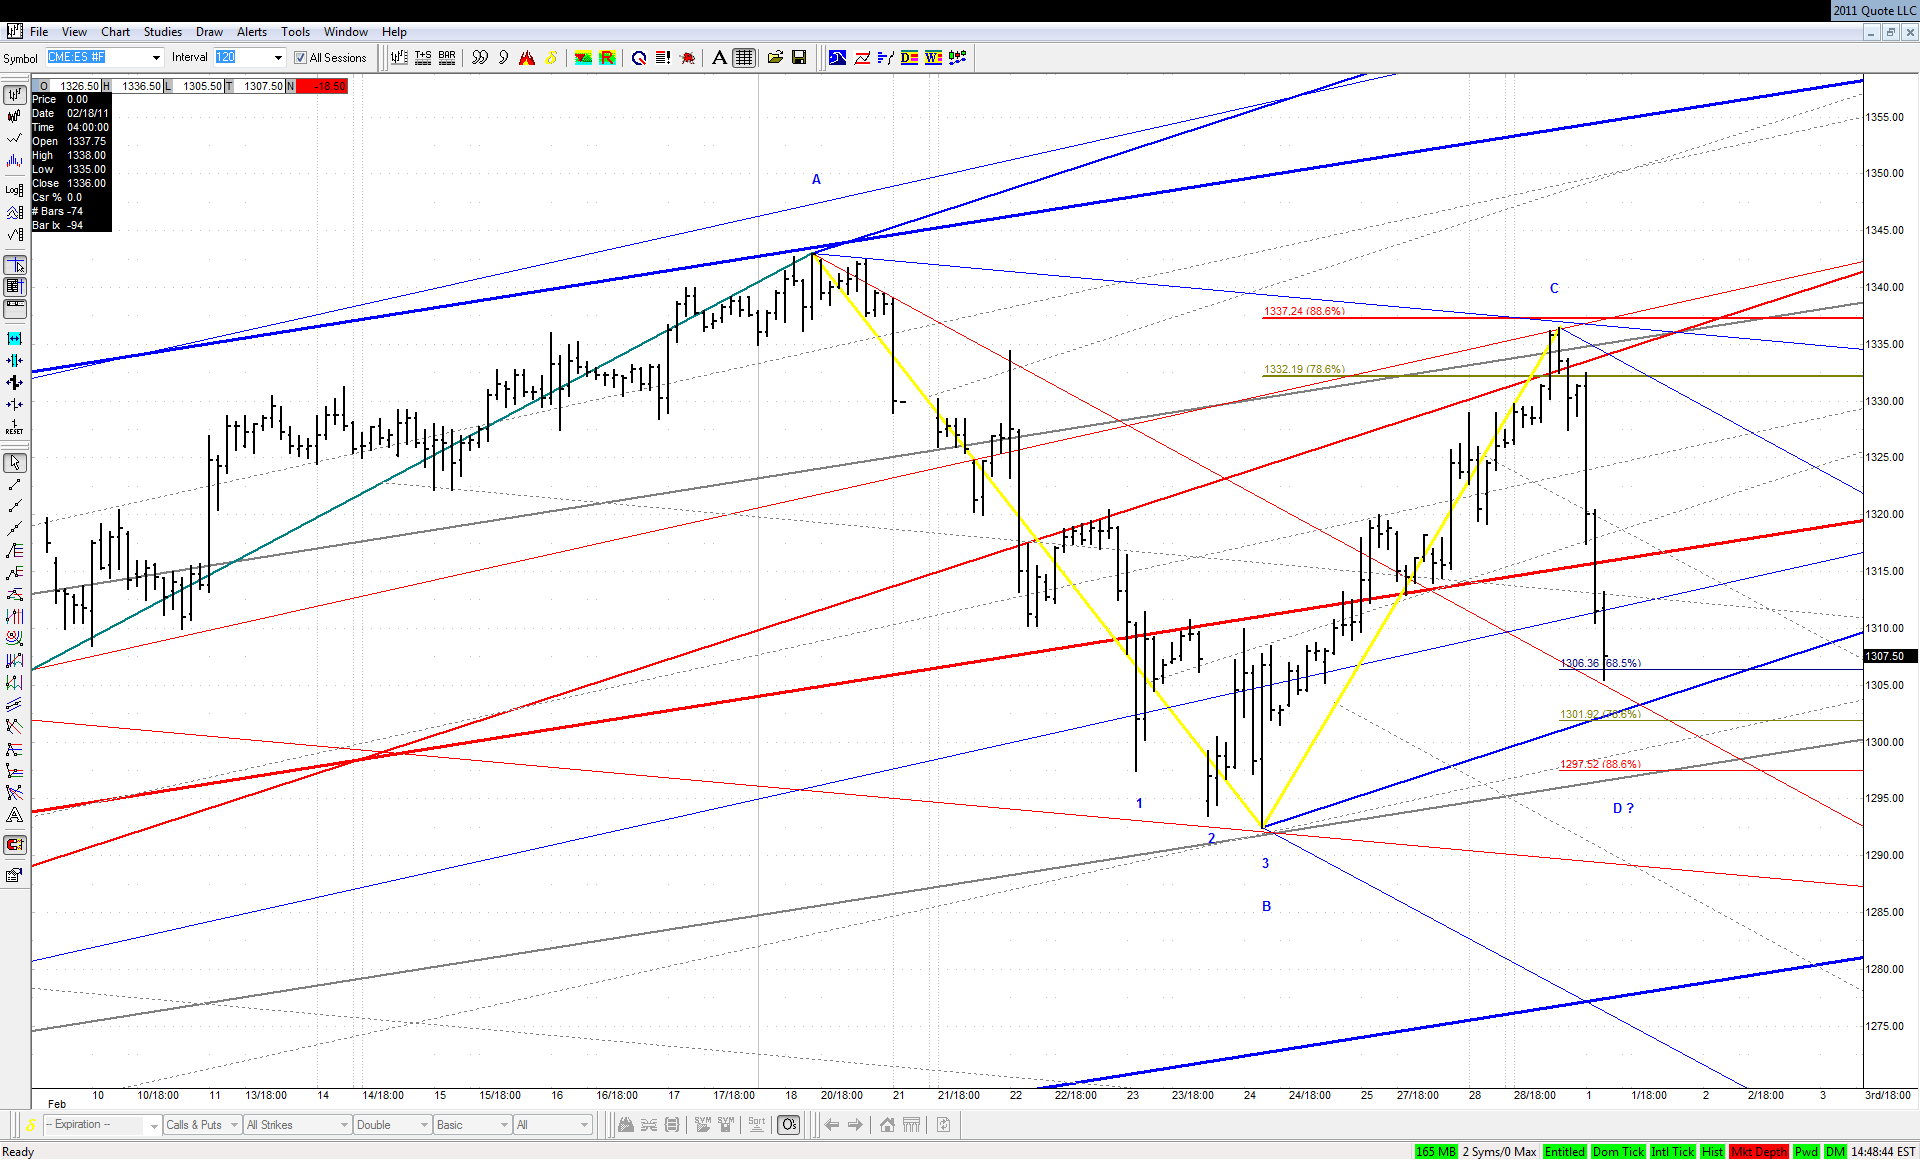
There was also a lot of action in the market while I was away. The basic question is, as Jim pointed out already, whether Thursday's 3D ended in a meaningful PTA or not. The best lines I could find for this area are following:

Click image for original size
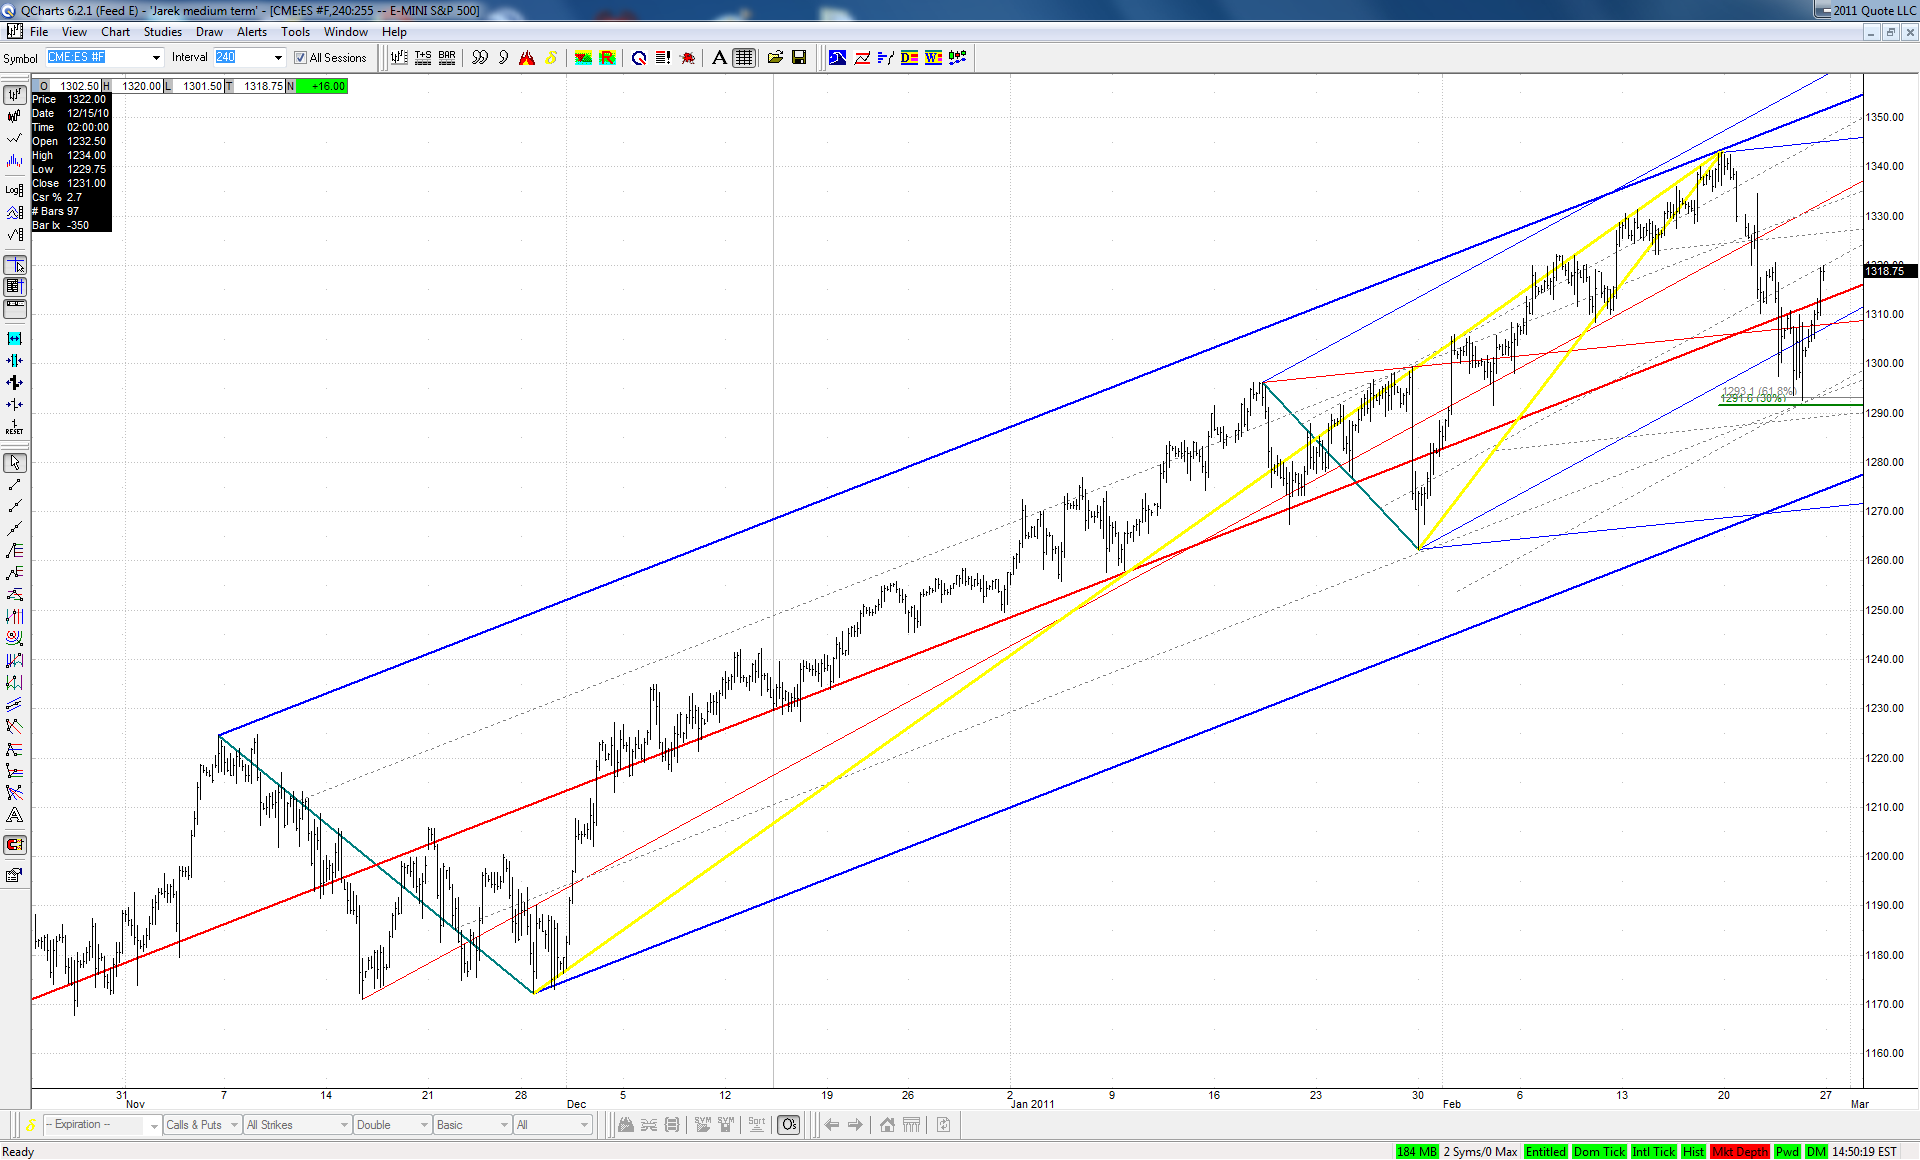

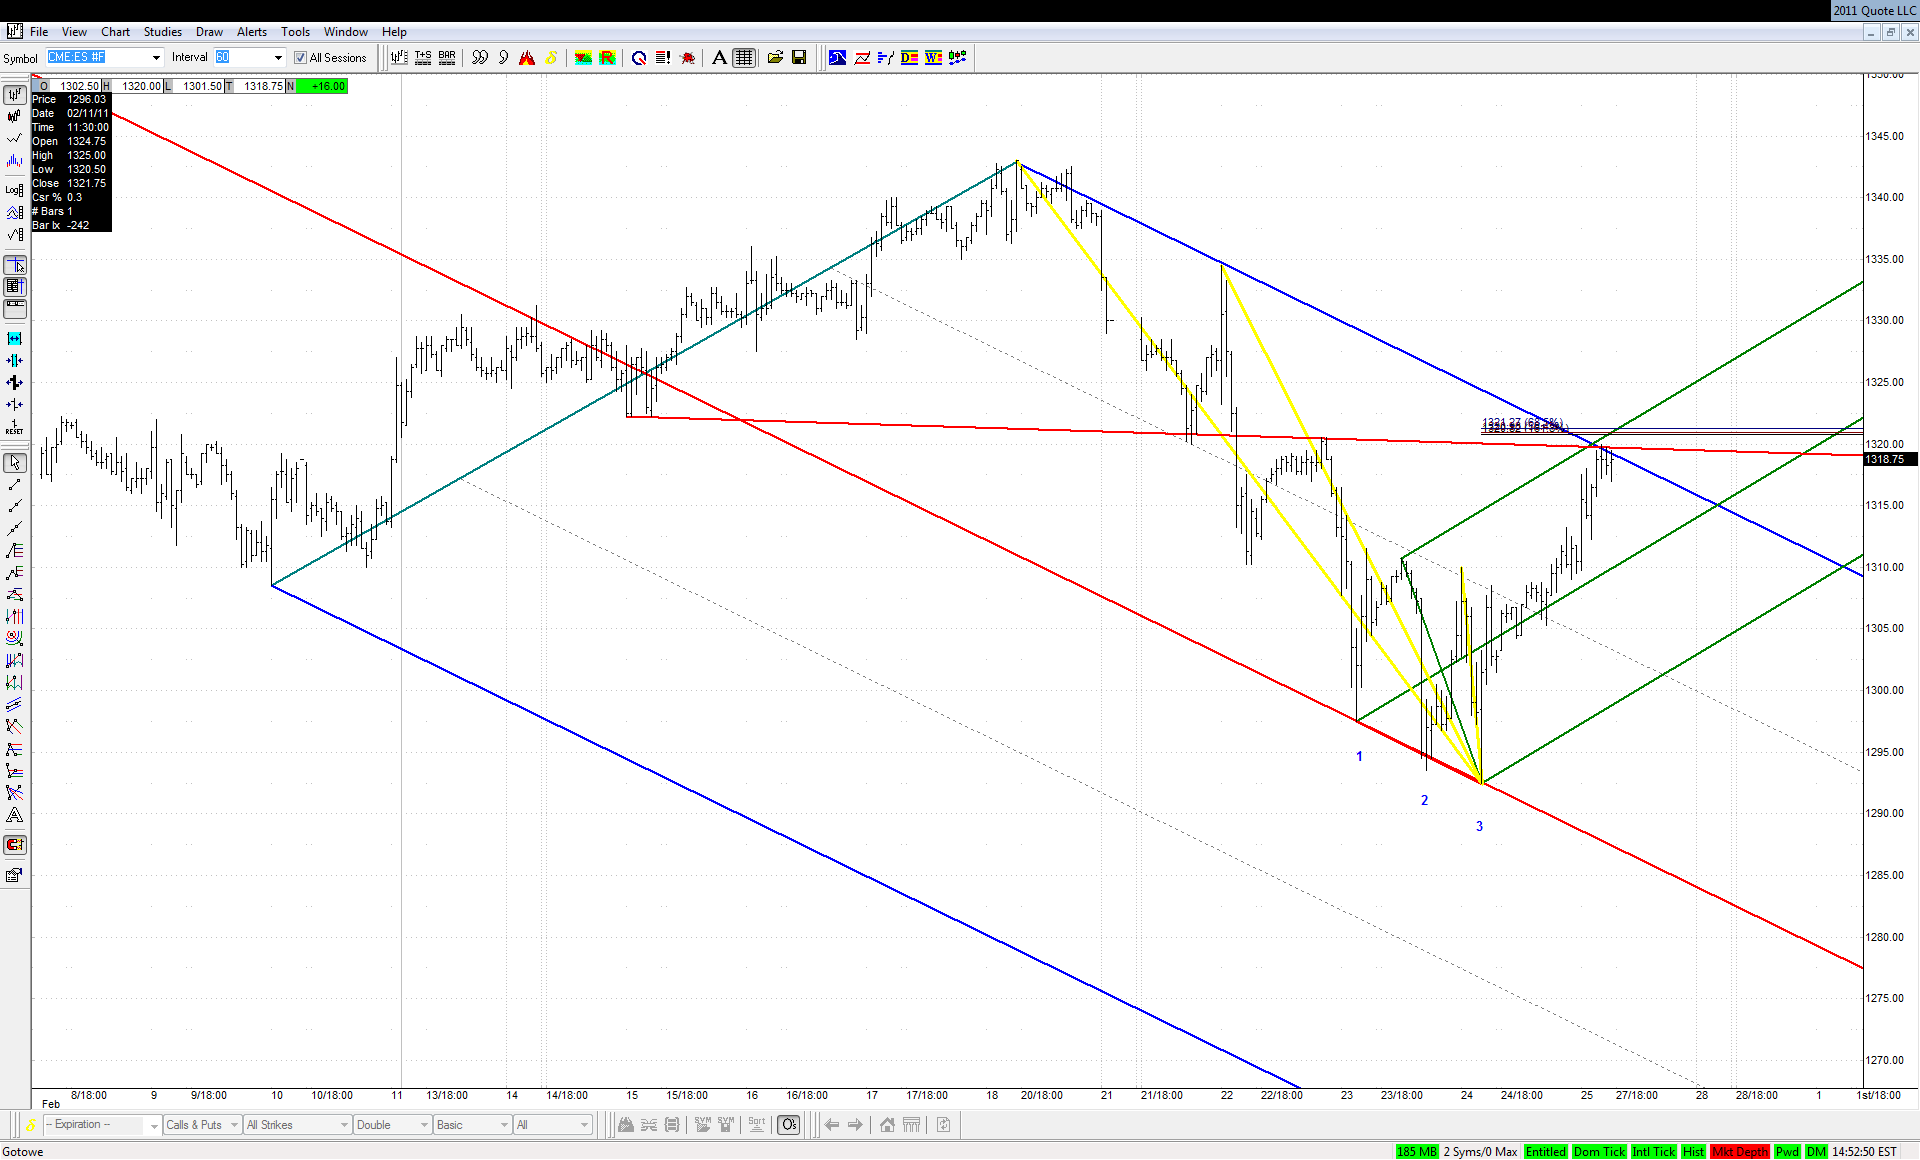
They don't look very convincing and there is no pattern, so the reaction at the current area should be very important:

Click image for original size
JI
jimkane
Rep: 3,058
Posts: 33,089
And crude just keeps rising. Saudi CDS at previous crisis levels... Now, why would that be???
JA
jarek
Rep: 94
Posts: 3,474
Originally posted by jimkane

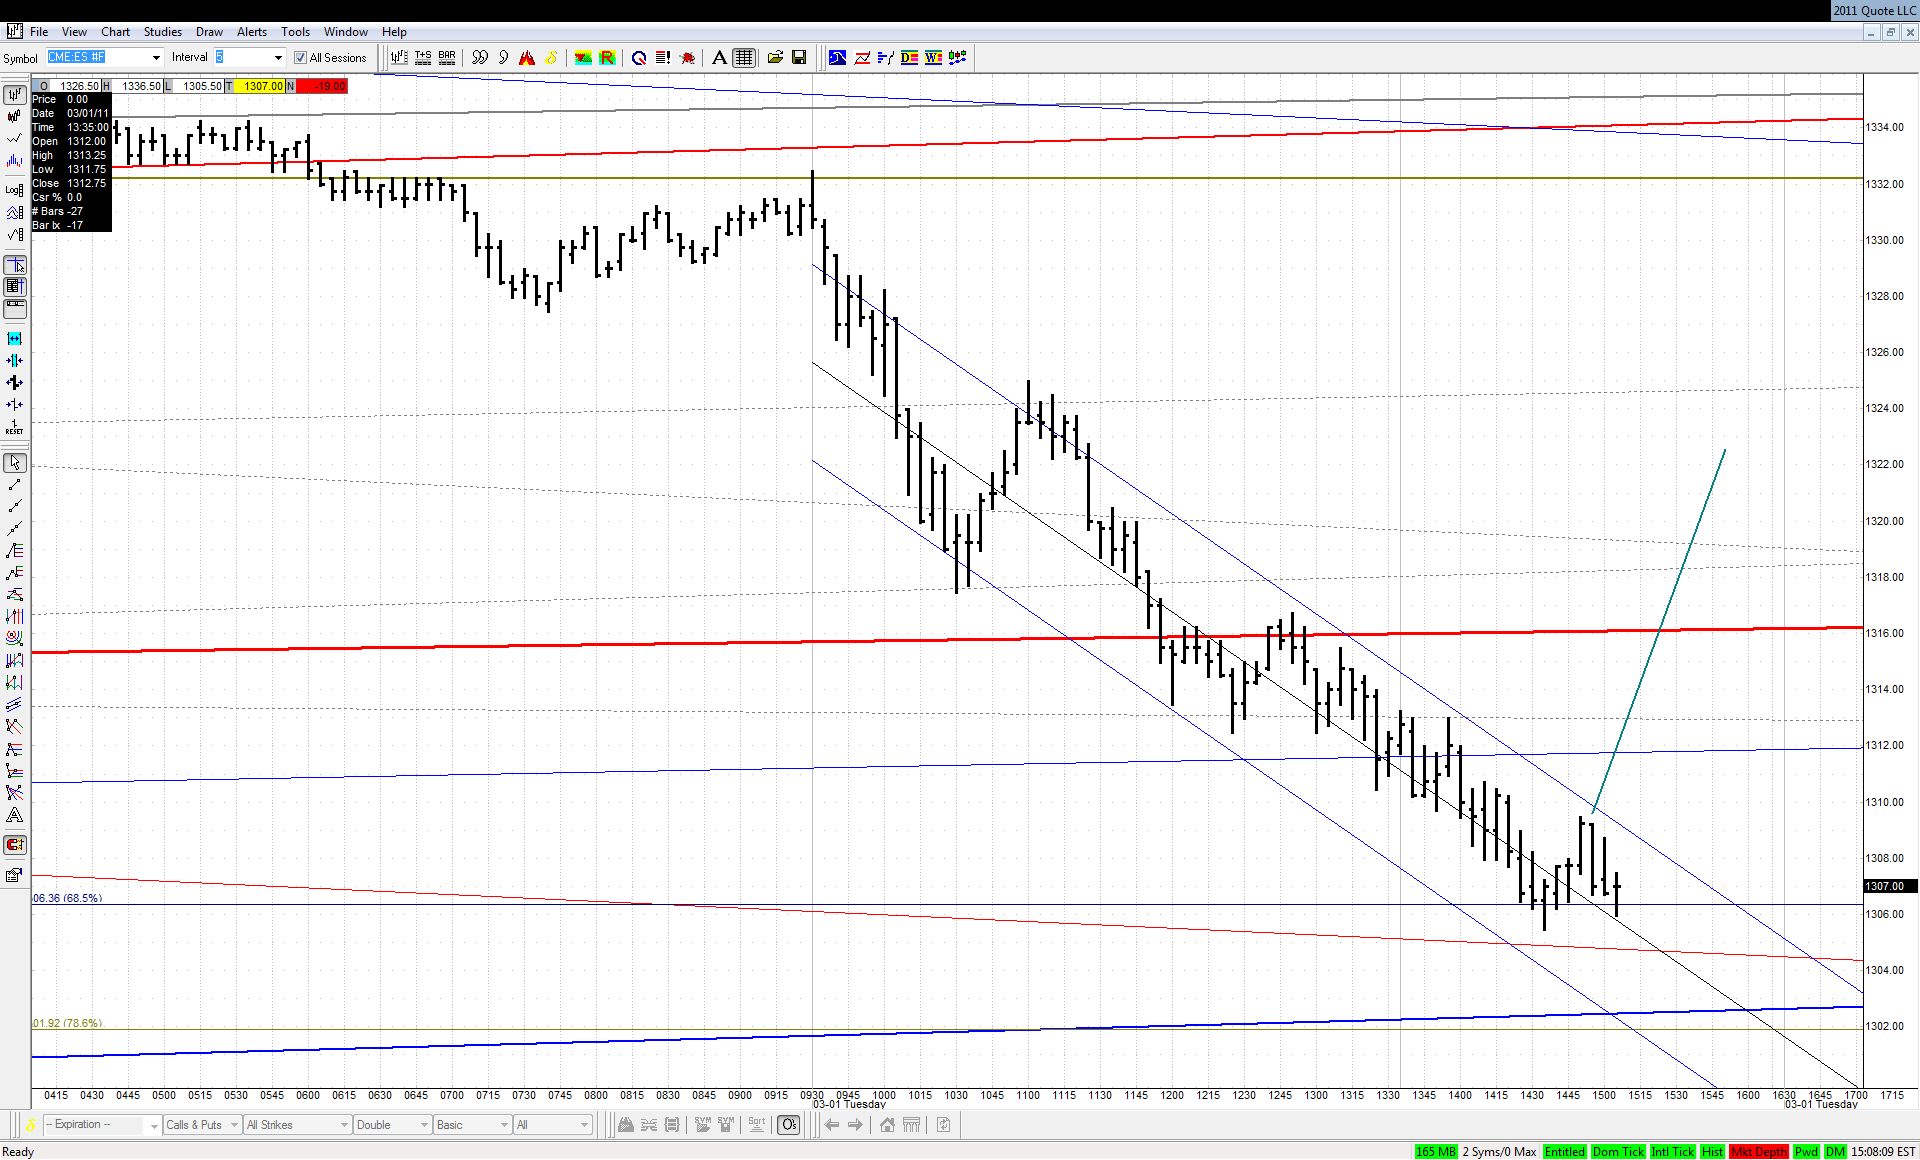
Watch this area in here at the .685. Anywhere from here to the more typical .786/.886 (which is also the Game Zone) could be a 4-point. Just something to watch for a possible reaction. Imagine another one-day wonder, right to a 4-Point.

Do you have more upsloping lines in this area for such a scenario?


Click image for original size
JI
jimkane
Rep: 3,058
Posts: 33,089
Be ready for this to start to rise in here...
JA
jarek
Rep: 94
Posts: 3,474
Originally posted by jimkane

And crude just keeps rising...

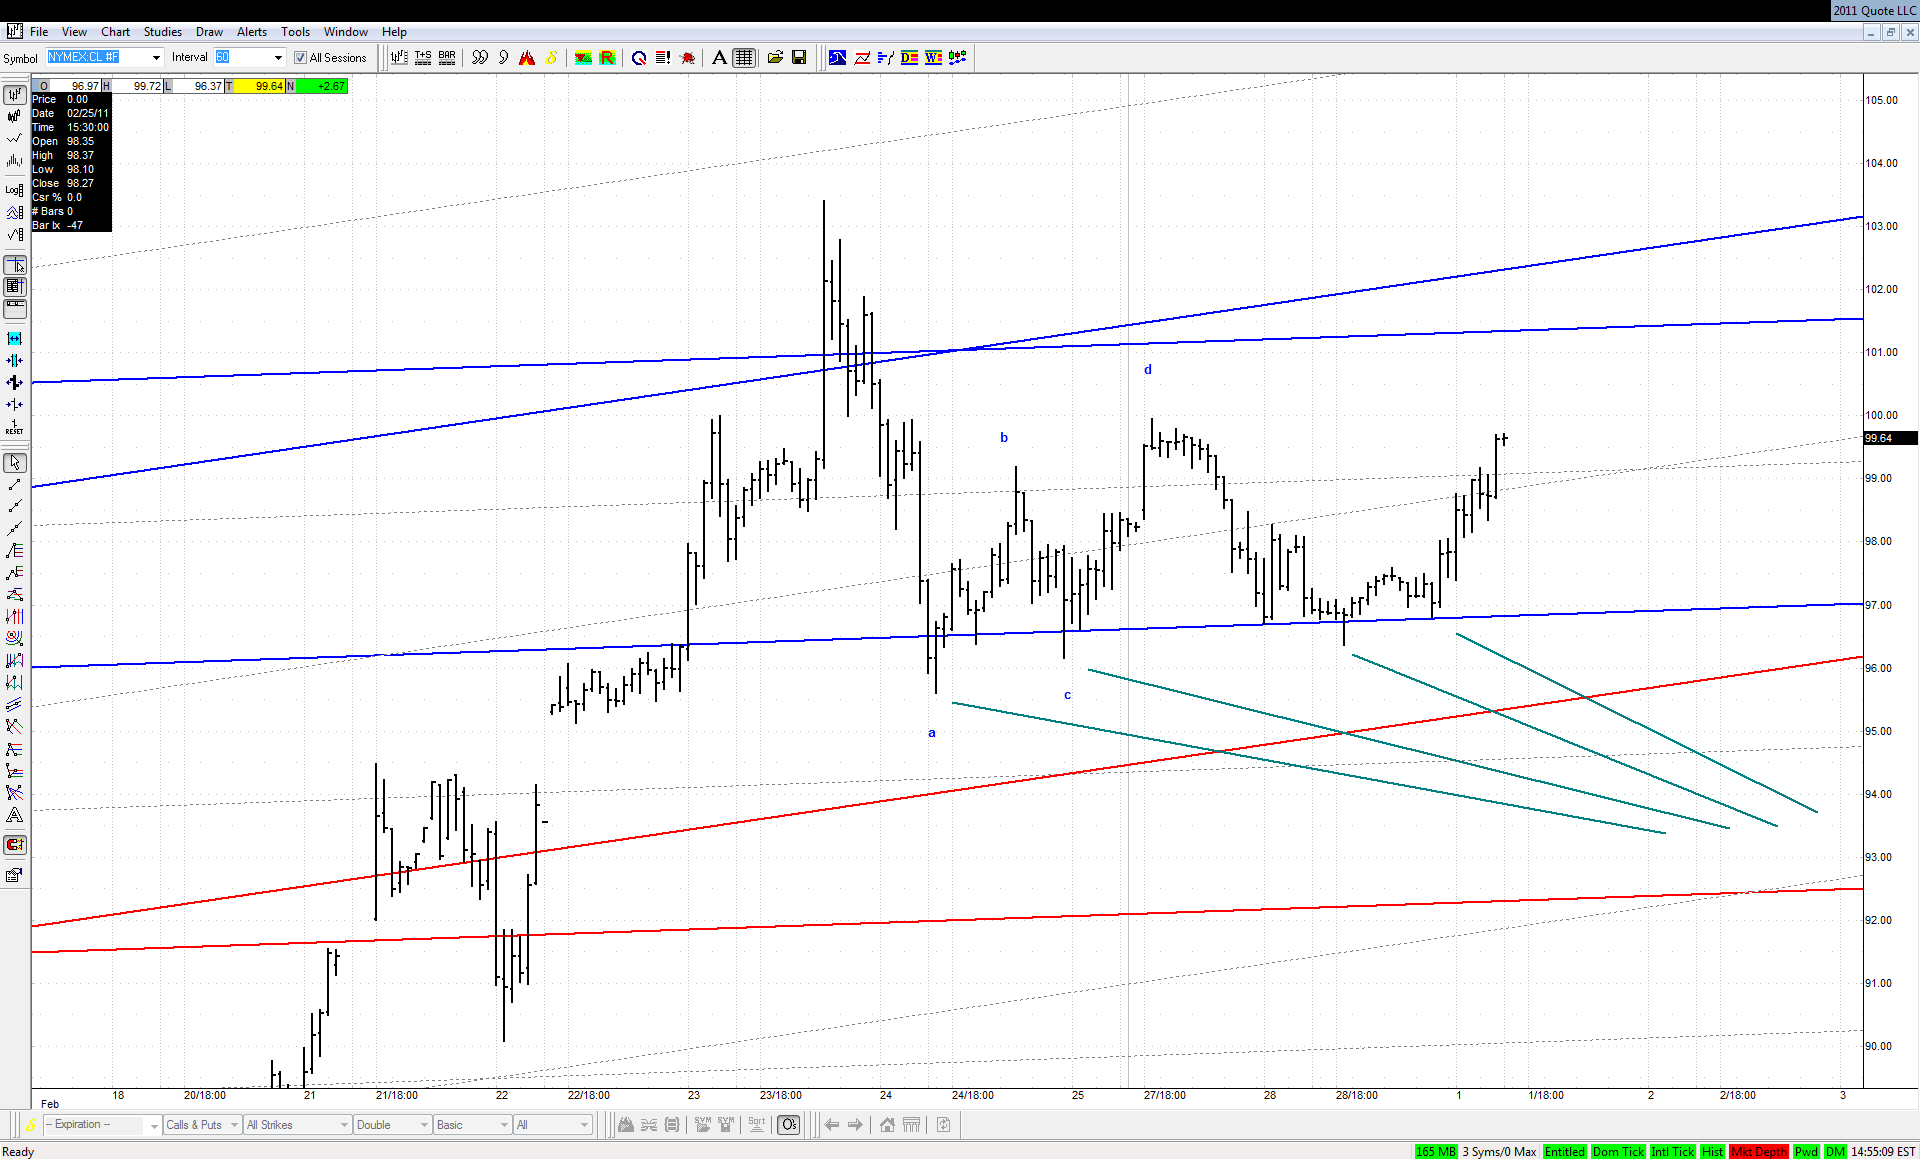
Yep - bearish setups are already gone. It is interesting to note how every next test of this ML was less and less penetrating it:

Click image for original size


Looks like exact opposite to Joed's famous "fade"
JA
jarek
Rep: 94
Posts: 3,474
Originally posted by jimkane

Be ready for this to start to rise in here...


Shall we fasten the seat belts?
JI
jimkane
Rep: 3,058
Posts: 33,089
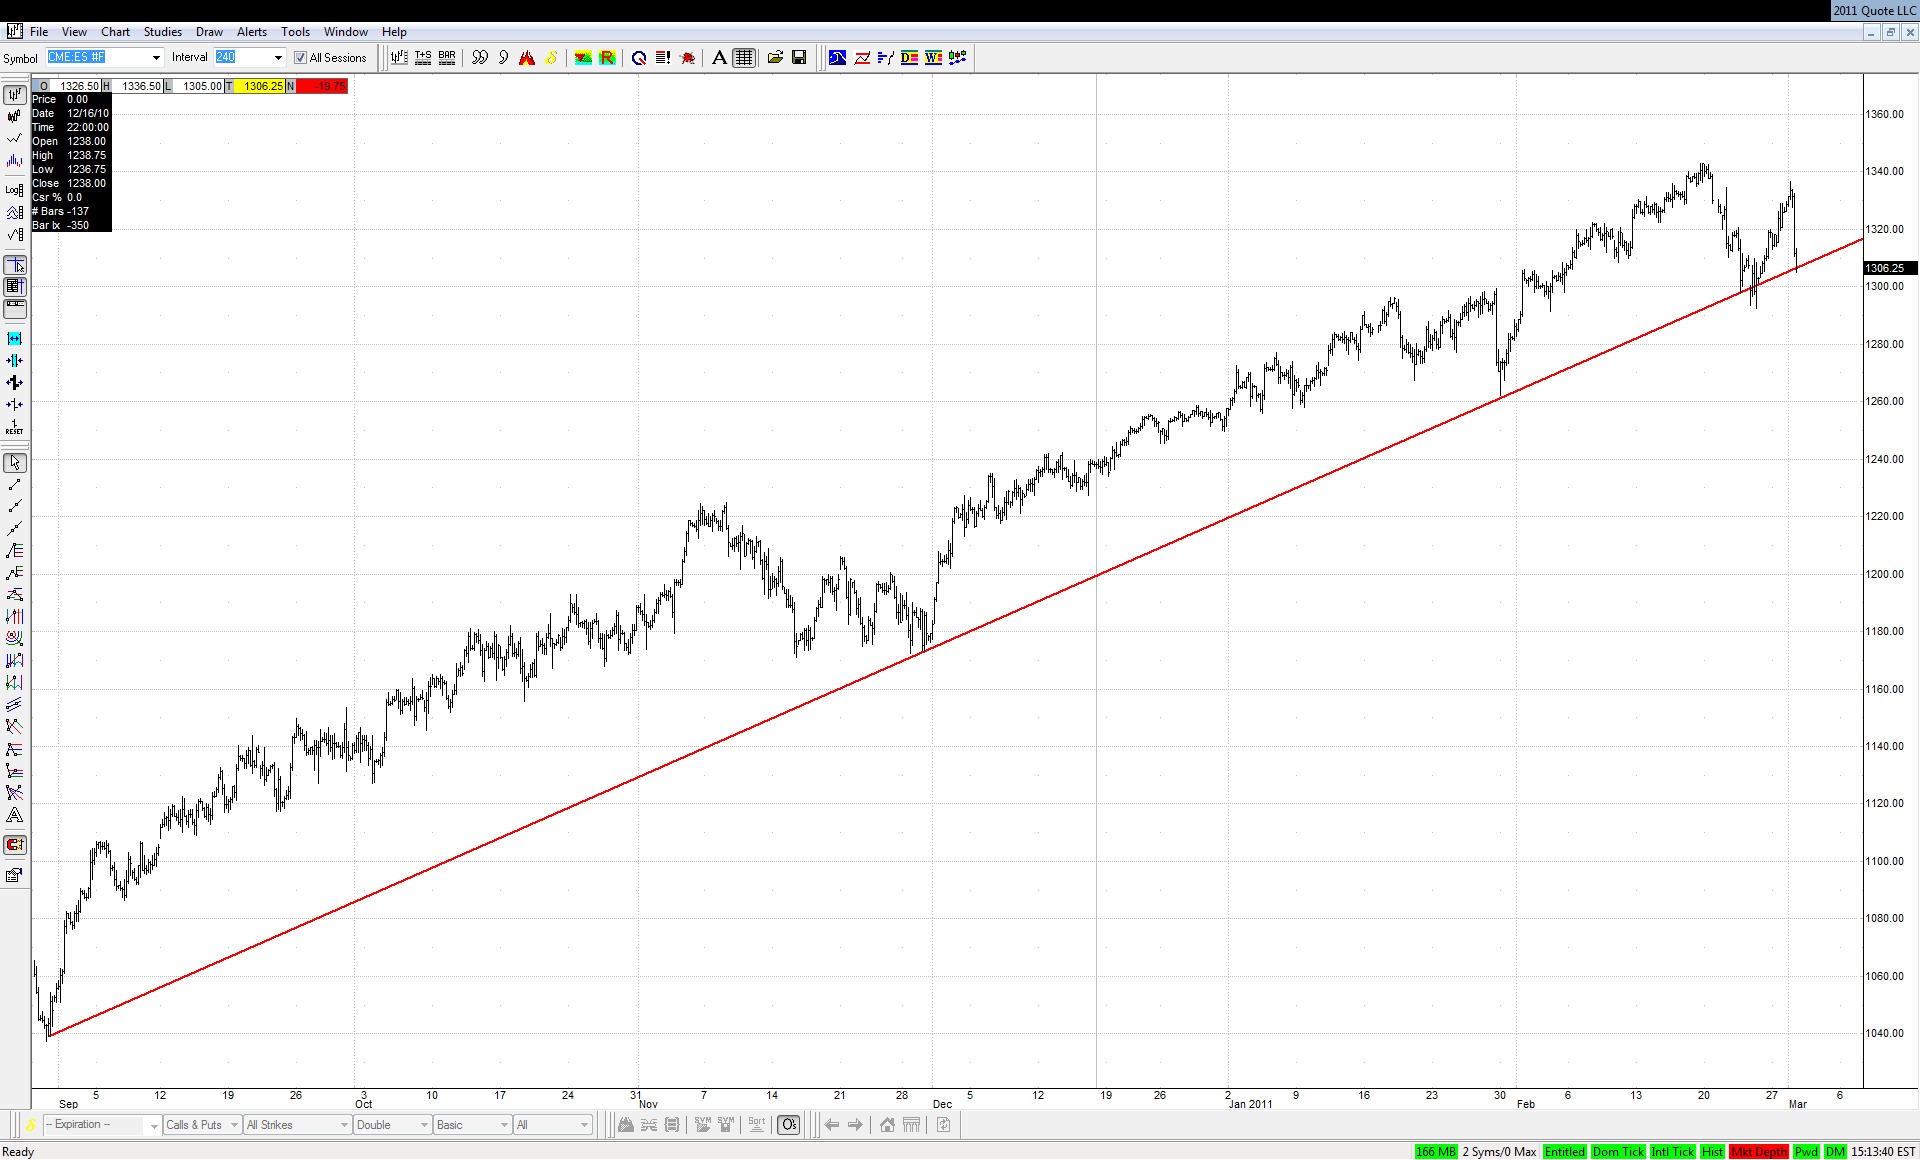
Well, I have a rather curious and what I think is key TL. I'll warn you, though, it's odd, but it's been useful to me so far. Try showing this on a 240-min all-sessions (it may have to be scrunched up a lot for posting...). Start the line on the low from 8/31/10 and put the next contact on the low from 11/30/10. Notice what happened. 1/30/11 low right back to it, 2/23/11 right back to it, then it was spiked through on a double overshoot where the big bounce started from, and it's right back there now, at a .685, and 'seeing' it again. This is not to be ignored, IMO.


Originally posted by jarek

Originally posted by jimkane

Watch this area in here at the .685. Anywhere from here to the more typical .786/.886 (which is also the Game Zone) could be a 4-point. Just something to watch for a possible reaction. Imagine another one-day wonder, right to a 4-Point.

Do you have more upsloping lines in this area for such a scenario?...
JI
jimkane
Rep: 3,058
Posts: 33,089
And keep in mind if this line fails... Also look at a sliding // for the line off those two spike-through lows. That line goes right into the Game Zone usual 4-Point completion area.
JA
jarek
Rep: 94
Posts: 3,474
Originally posted by jimkane

Be ready for this to start to rise in here...

This last shot up was most likely a hood


Click image for original size
JA
jarek
Rep: 94
Posts: 3,474
Originally posted by jimkane

... Try showing this on a 240-min all-sessions (it may have to be scrunched up a lot for posting...). Start the line on the low from 8/31/10 and put the next contact on the low from 11/30/10...

Now I see. It's a good habit to keep old TLs on the chart even if they were slightly broken. But your charts get so much more cluttered then...

Click image for original size
JI
jimkane
Rep: 3,058
Posts: 33,089
Getting ready for the bounce...
RA
rat89
Rep: 0
Posts: 7,015
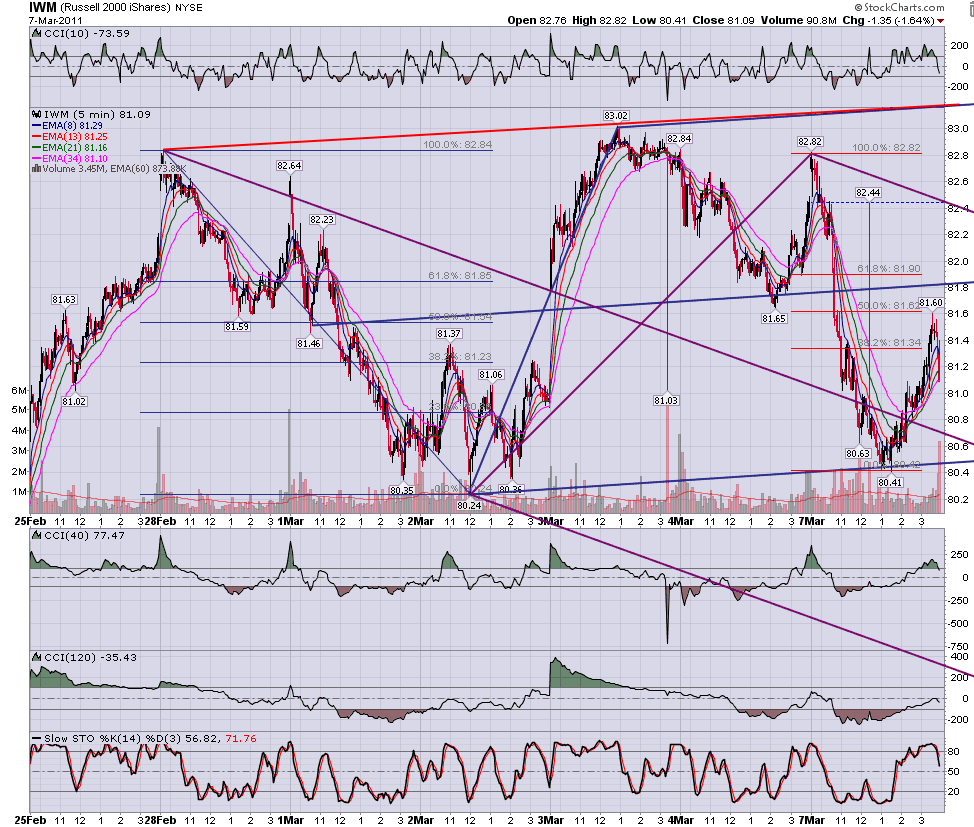
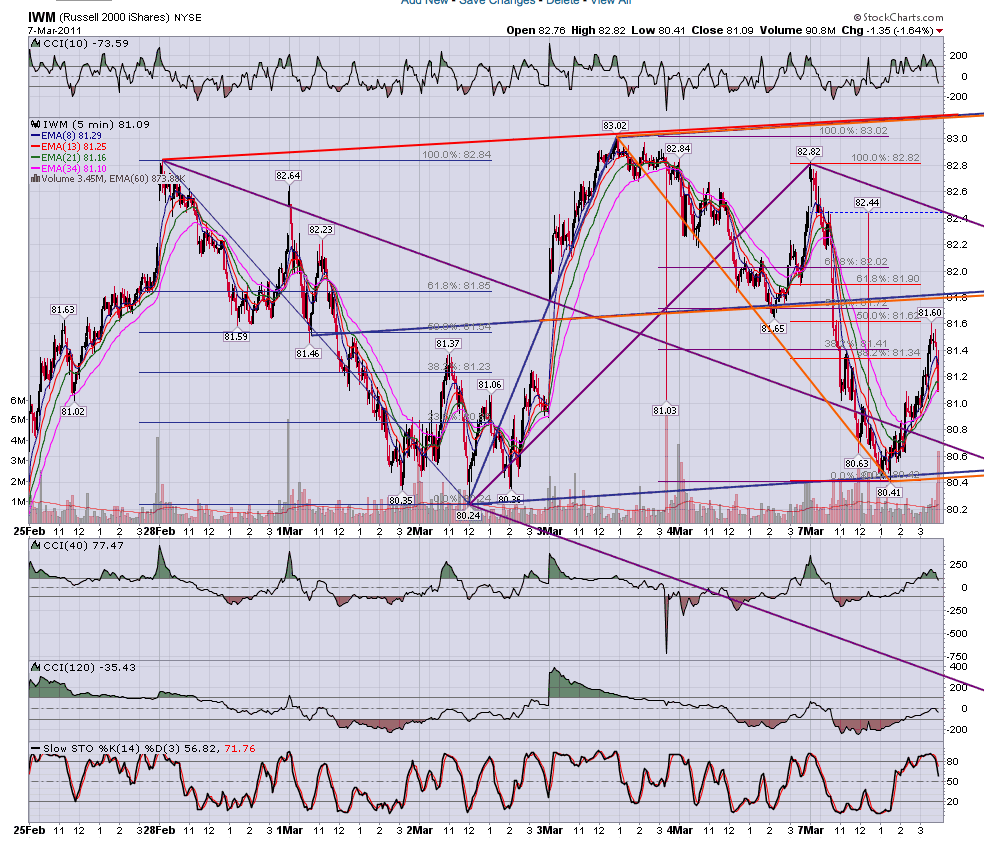
iwm bounced at line, at .941/ .618......how far will the bounce get? interesting how the new schiff set sits right on top of the last one....
Click image for original size

Click image for original size