MyPivots
Sign In
JA
jarek
Rep: 94
Posts: 3,474
Welcome back everybody! Good to see so much activity and some new faces here


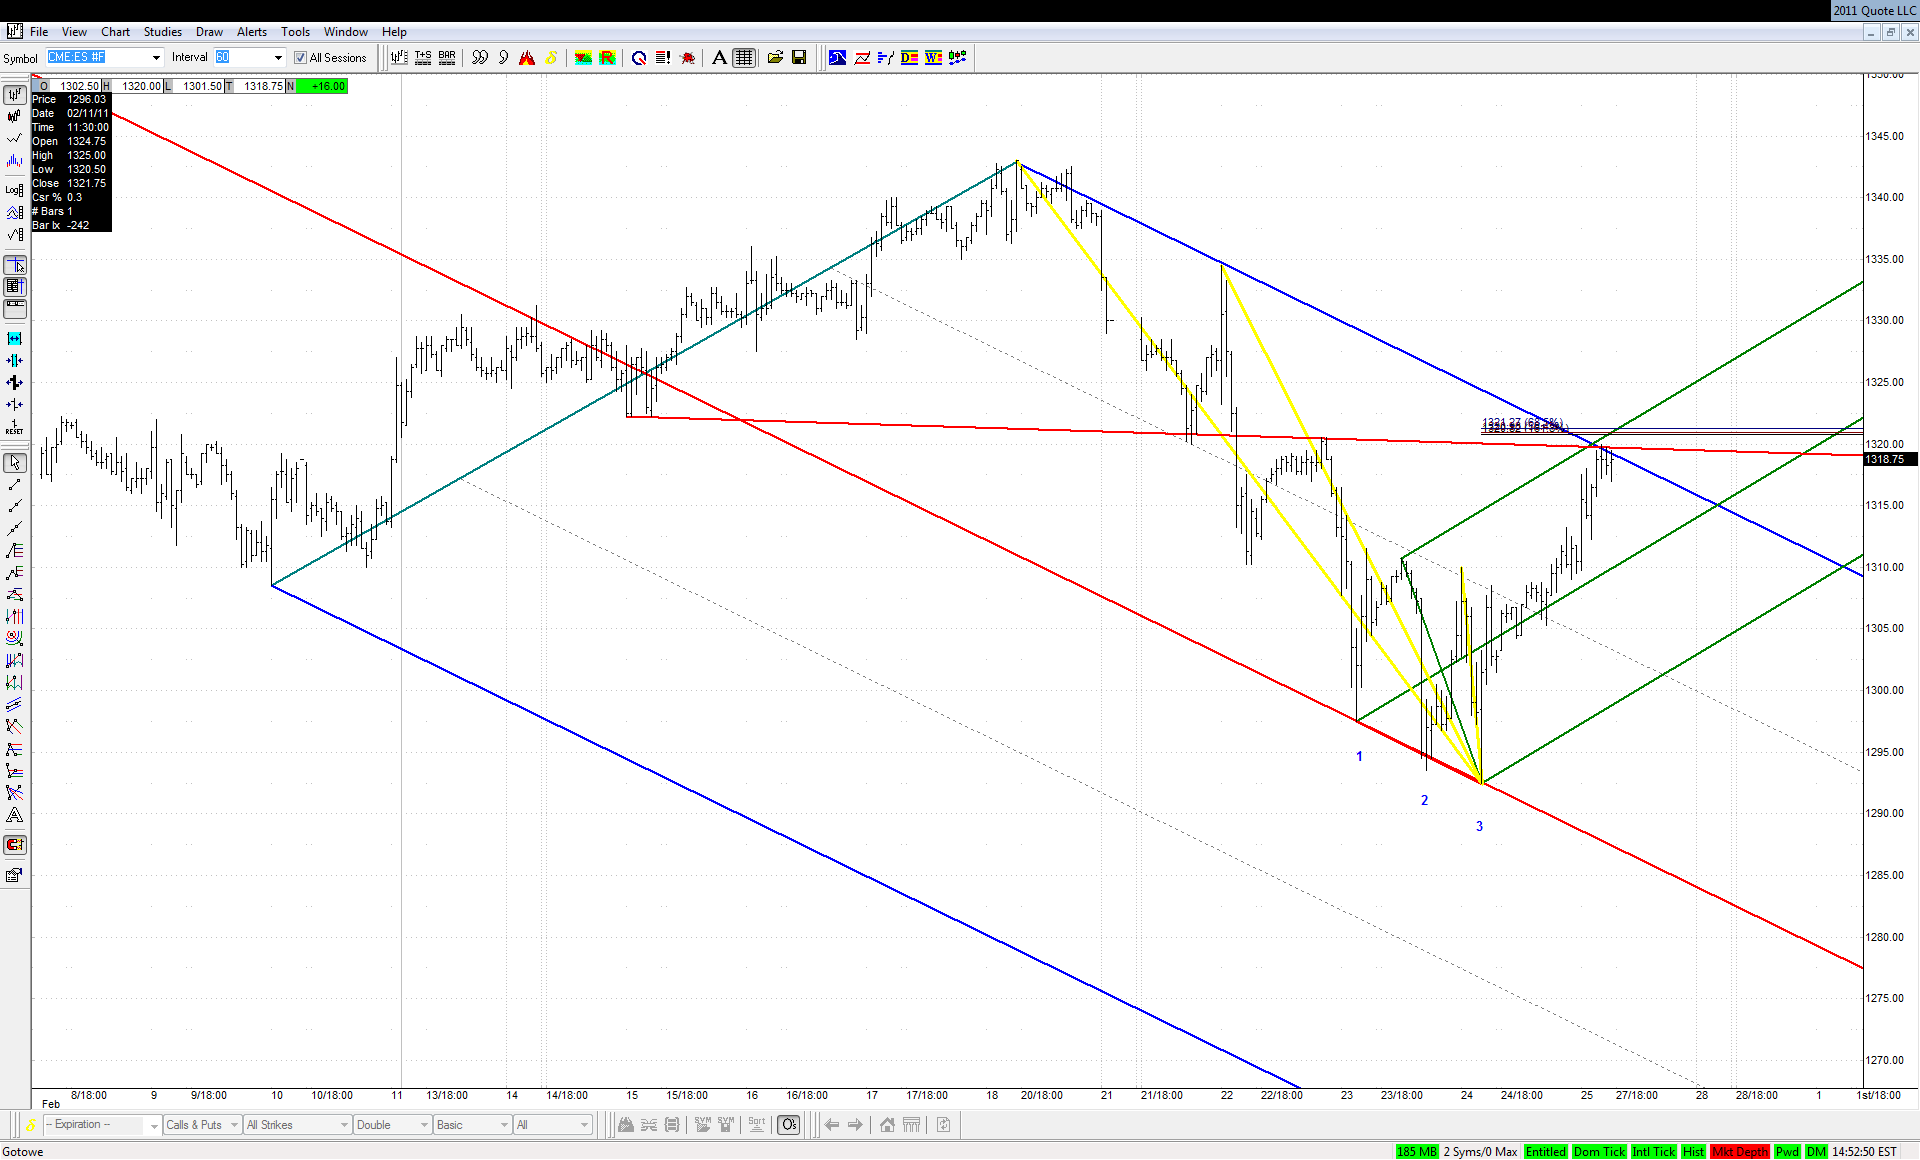
There was also a lot of action in the market while I was away. The basic question is, as Jim pointed out already, whether Thursday's 3D ended in a meaningful PTA or not. The best lines I could find for this area are following:

Click image for original size
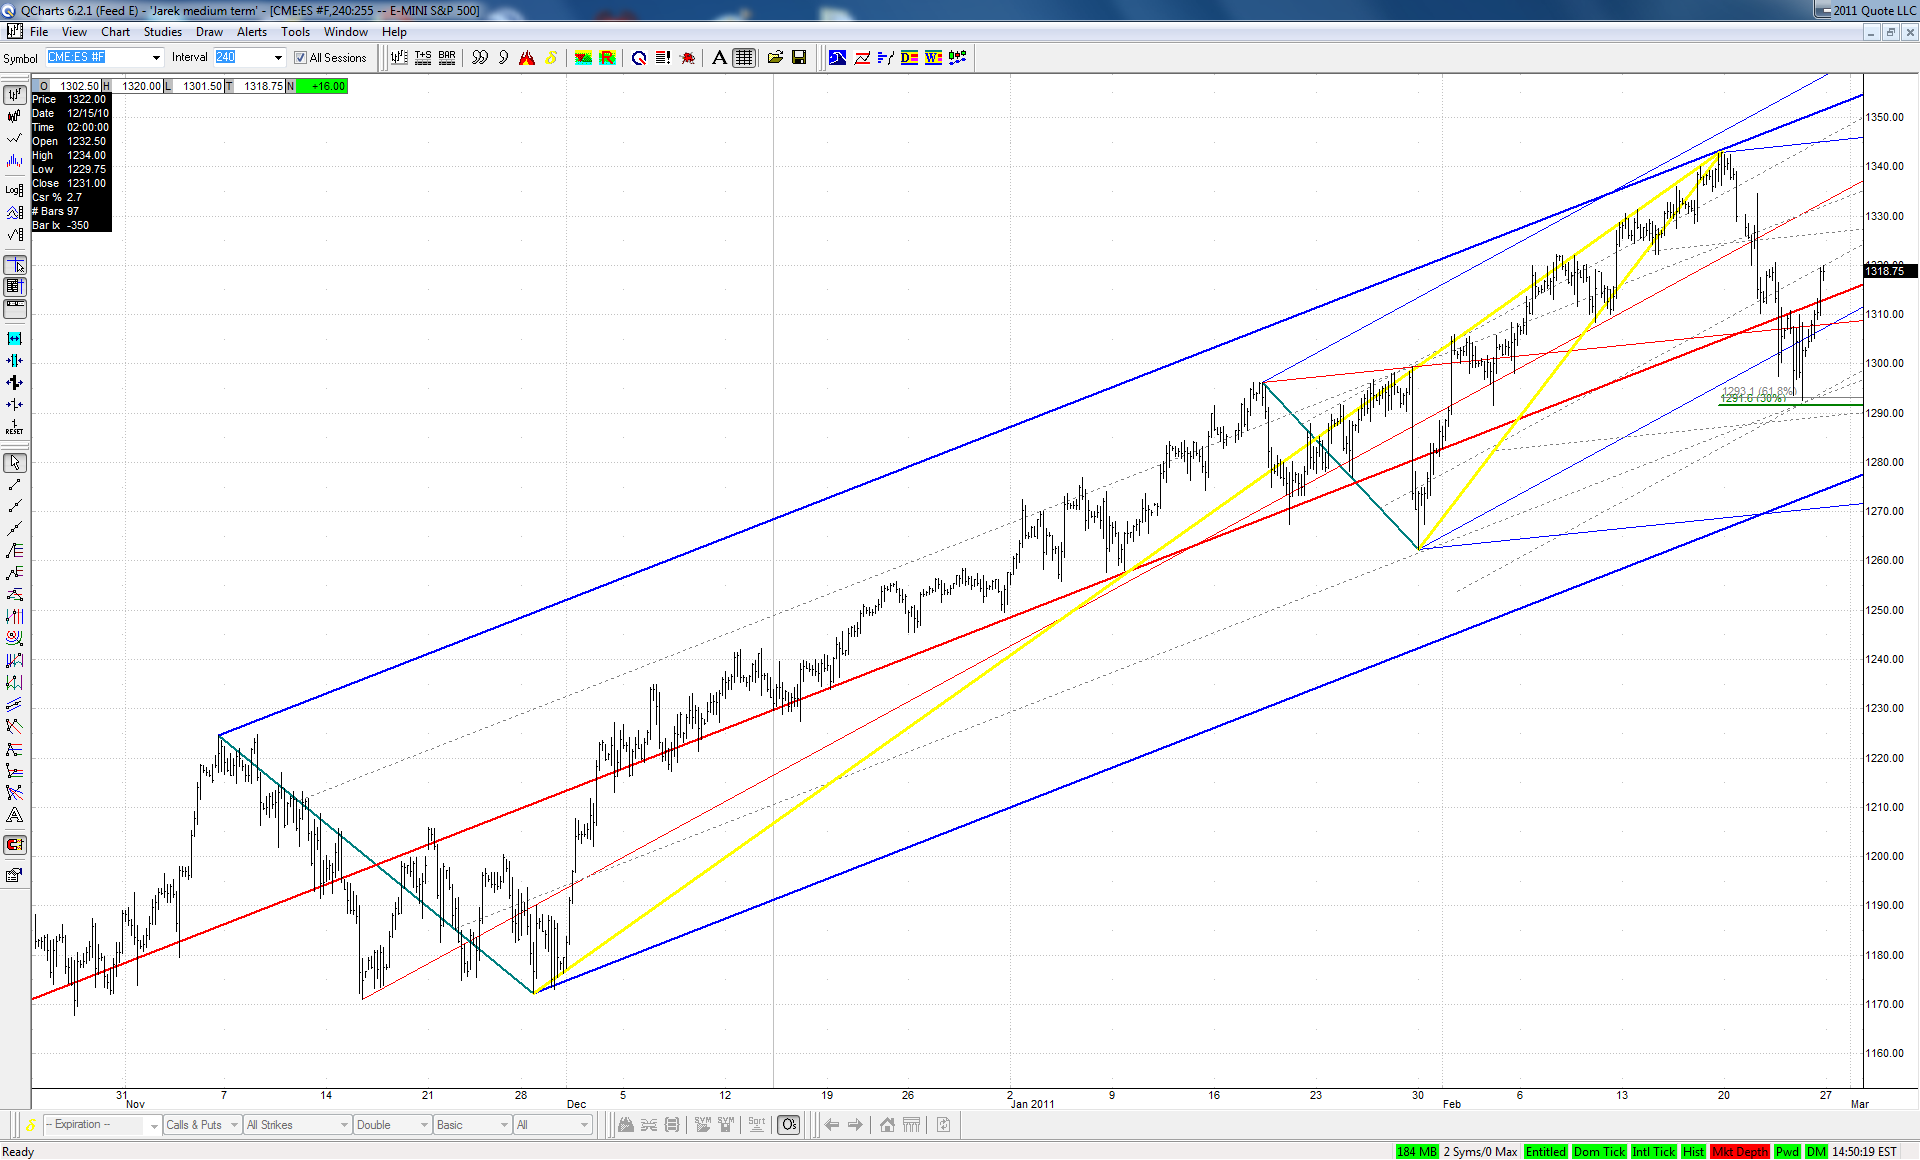

They don't look very convincing and there is no pattern, so the reaction at the current area should be very important:

Click image for original size
RO
roofer
Rep: 3,689
Posts: 3,574
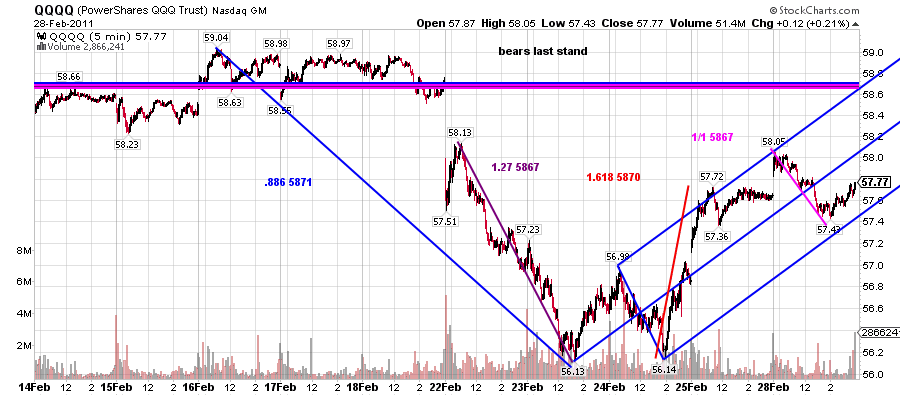
roofer's last stand......
Click image for original size
RO
roofer
Rep: 3,689
Posts: 3,574
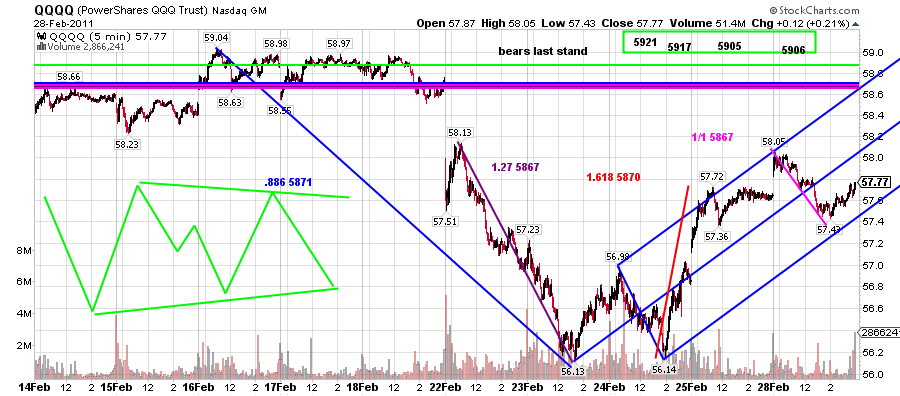
this also makes sense.....would blow out all the .886 on gap traders, blow out all the stops
Click image for original size
JA
jarek
Rep: 94
Posts: 3,474
Do the charts above include the astro stuff you were mentioning earlier?
JA
jarek
Rep: 94
Posts: 3,474
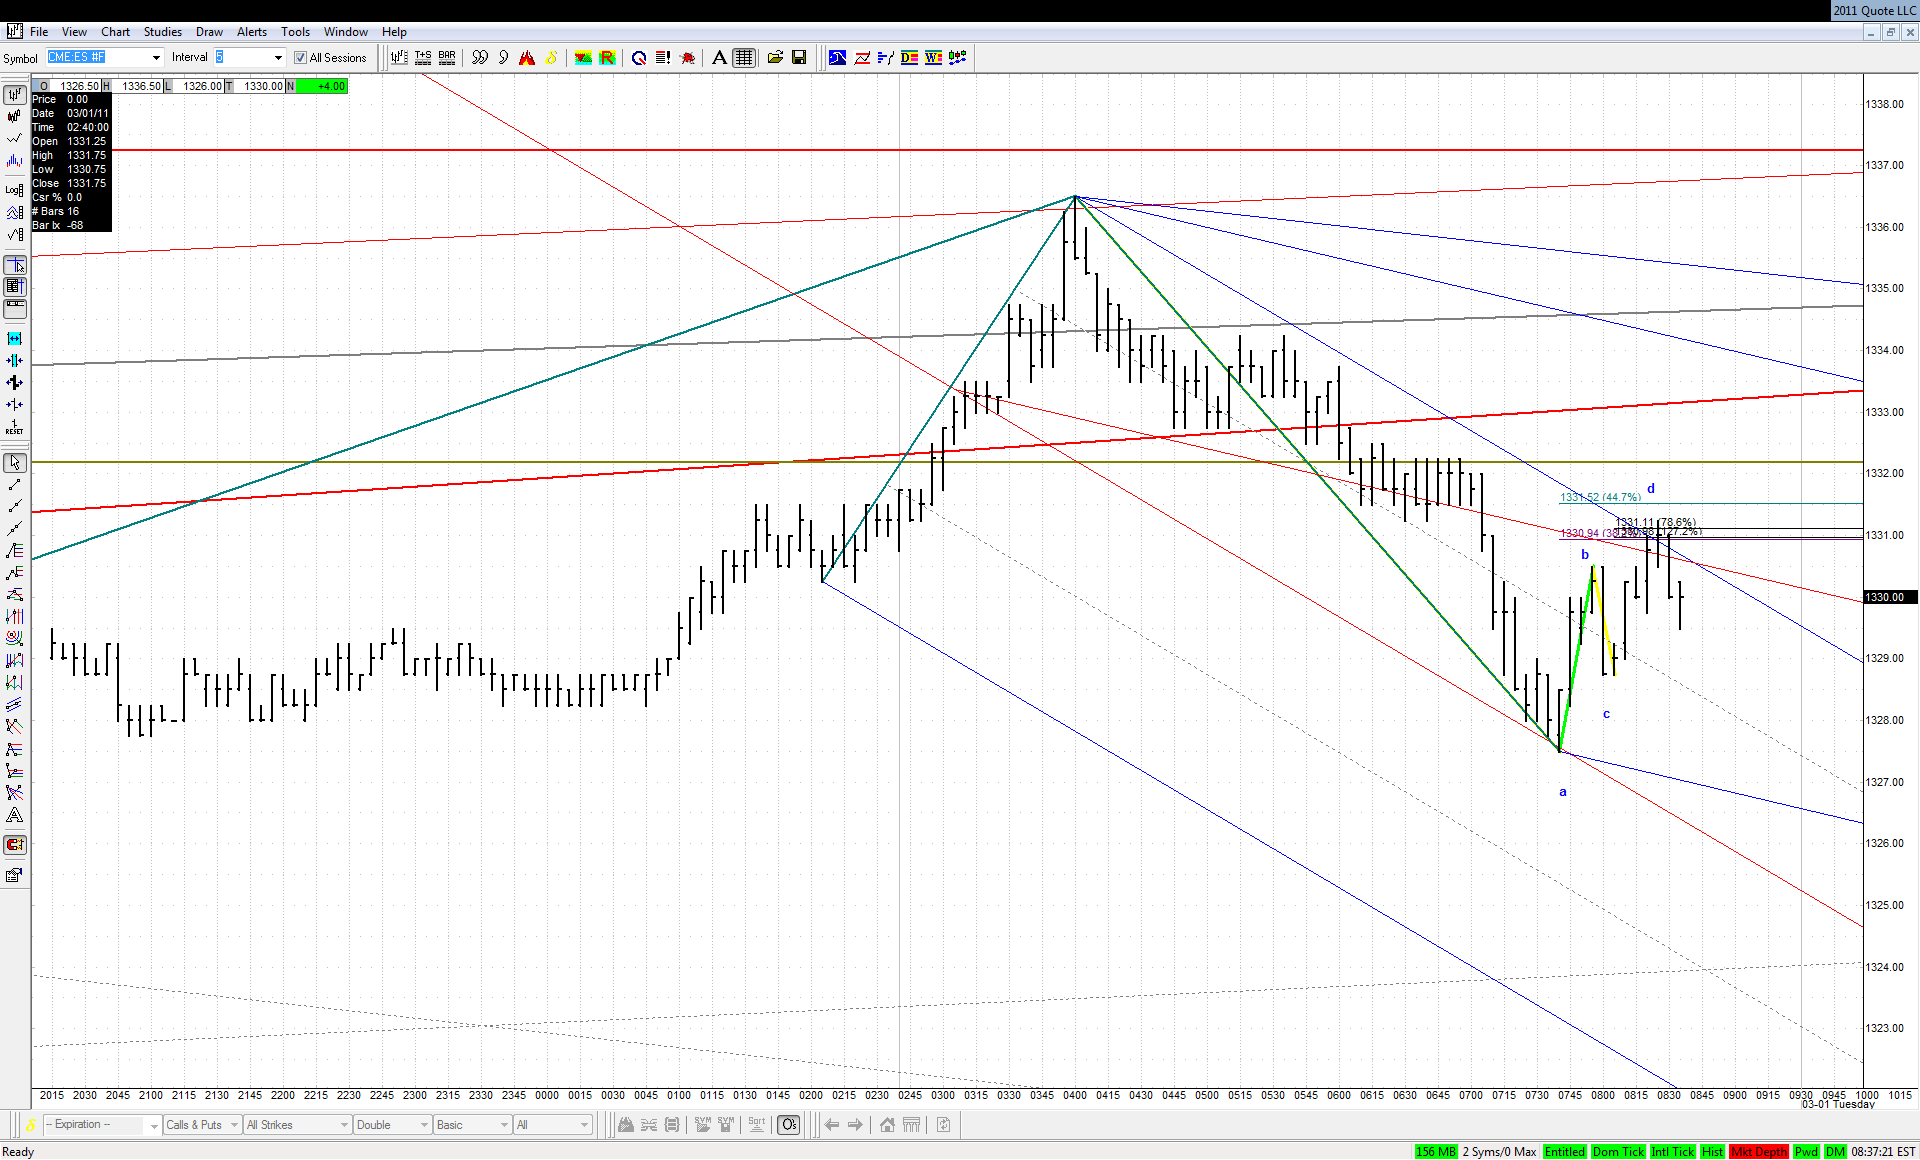
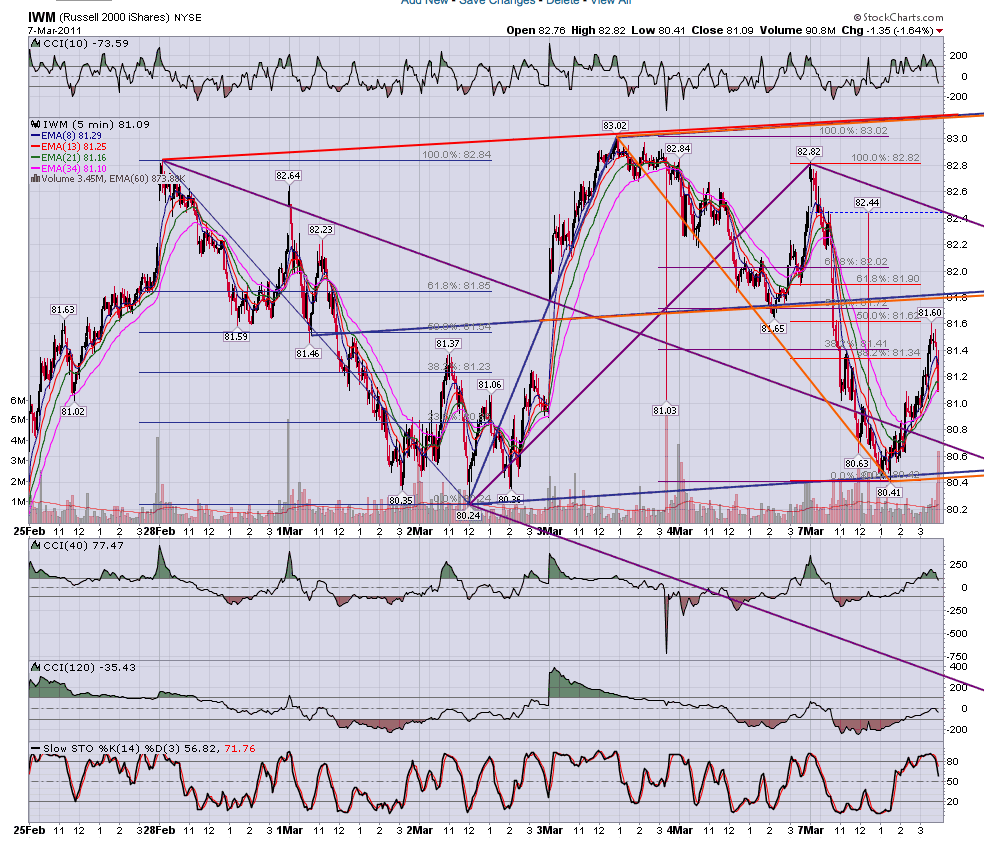
First test of the move off HOD - .786 (sign of weakness?) bearish KZ ABCD:

Click image for original size
RO
roofer
Rep: 3,689
Posts: 3,574
astro was in reference to DBC only
JA
jarek
Rep: 94
Posts: 3,474
OK - thanks
RA
rat89
Rep: 0
Posts: 7,015
too funny

Originally posted by roofer

roofer's last stand......
RA
rat89
Rep: 0
Posts: 7,015
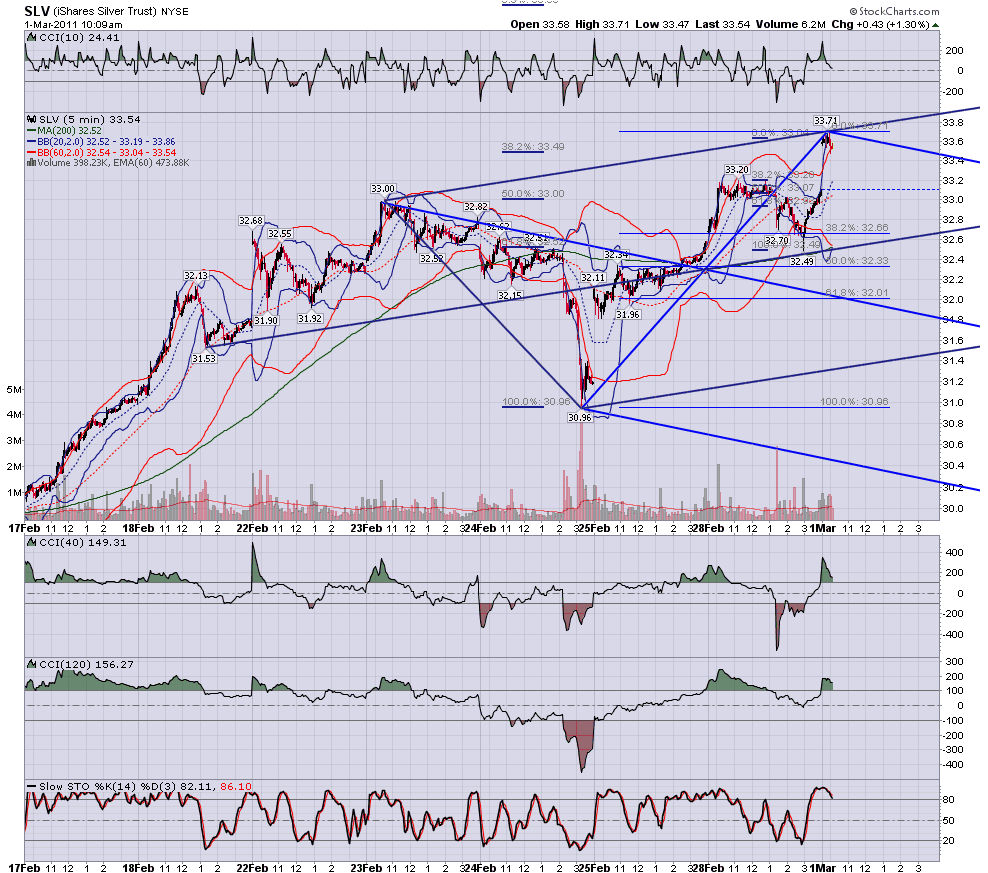
33.64 = 1.618 of yesterday's swing; 33.55 = 1.27 of bigger swing

Click image for original size
RA
rat89
Rep: 0
Posts: 7,015
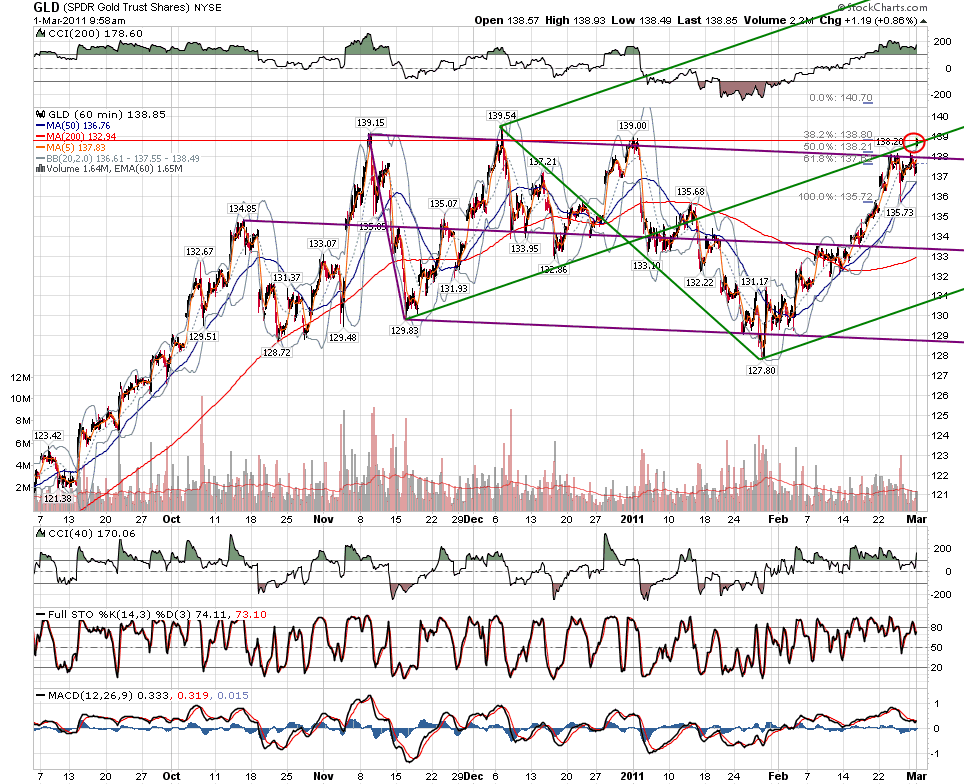
red line at 138.86 = .941 from high at 139.54; 138.20> 135.73 = 1.27 @ 138.87
Click image for original size
RA
rat89
Rep: 0
Posts: 7,015
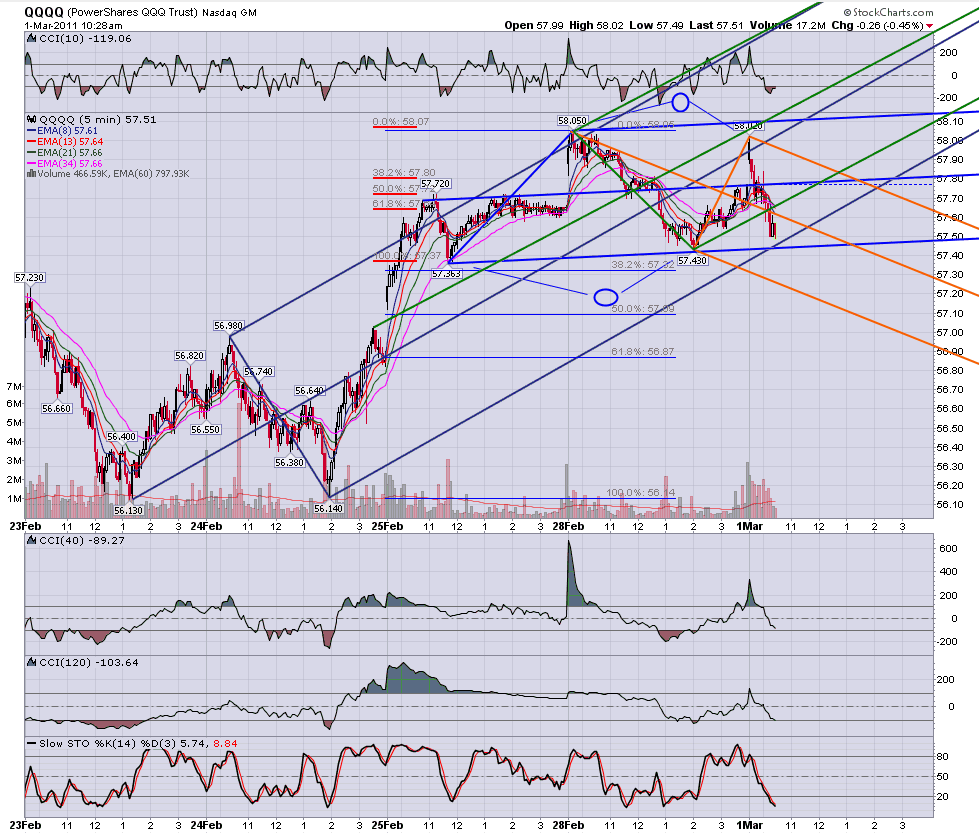
.886 on the q's in both directions
Click image for original size
RA
rat89
Rep: 0
Posts: 7,015
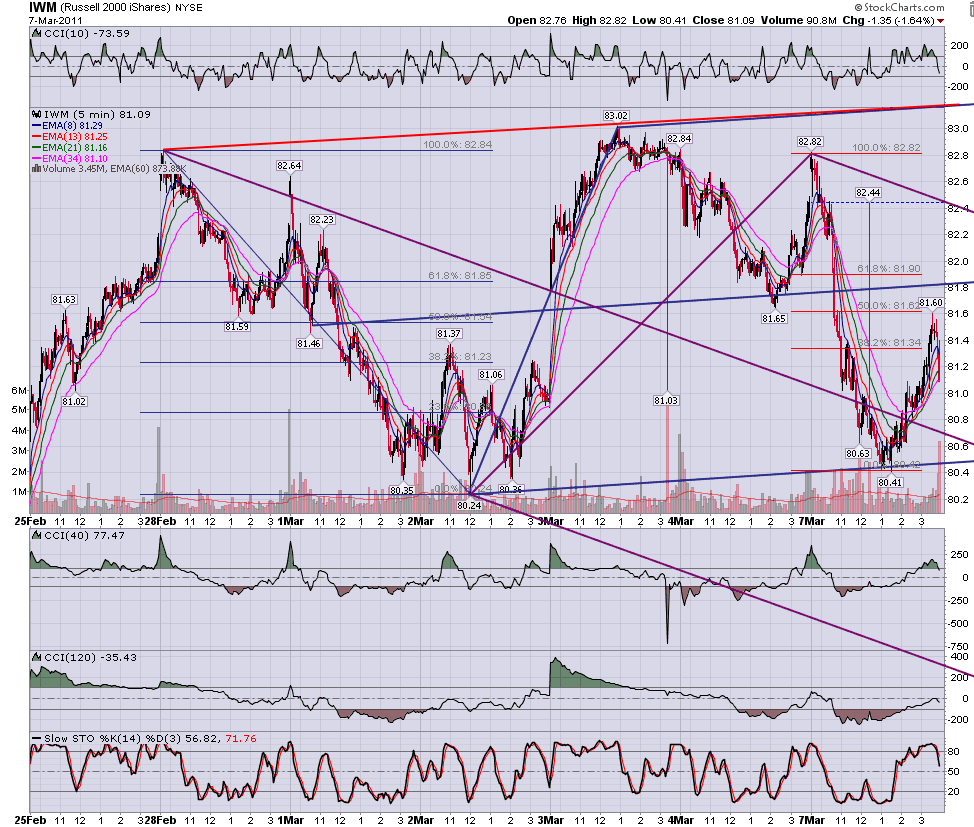
iwm bounced at line, at .941/ .618......how far will the bounce get? interesting how the new schiff set sits right on top of the last one....
Click image for original size

Click image for original size