ES Short Term Trading for 3-21-2011
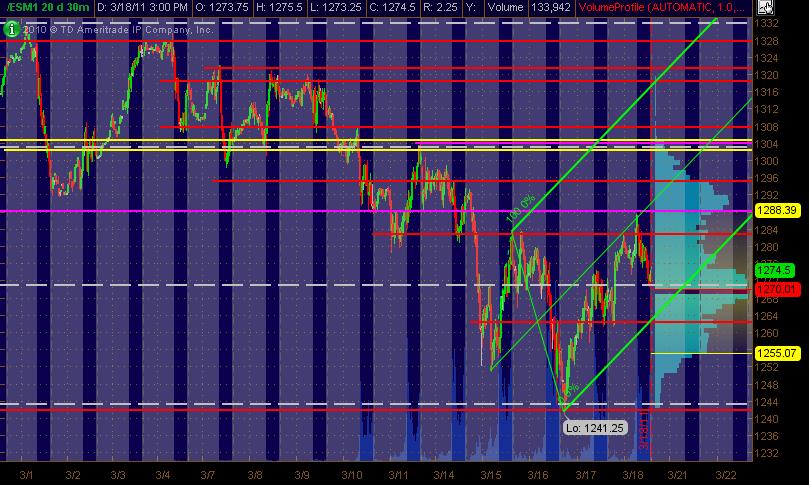
Thought I'd go ahead and launch Monday's ES goodies for folks to add to. Posting my Monkey MAP of the ES June contract, 30min bars for 20 days. The Red lines are potentially significant PASR levels with Magenta as semi-significant. The Whitish dashed lines are the Weekly Pivots. The 2 Yellow lines are a Fib Cluster that stood out to me in that zone. And fwiw, I also included in Green, an Andrews Pitchfork since it "felt" right for what I was looking at. The right vertical Blue lines are Volume at Price. Hope this is a helpful MAP to folks!
Lots of lines ... but I'm showing roughly 100 points with this particular chart.
Click image for original size
Lots of lines ... but I'm showing roughly 100 points with this particular chart.
Forgot to mention that the grayed out background is "overnight" trading activity while the solid blue background is RTH. (kind of shows how much time/trading goes on outside of the RTH's)
Good morning. It would appear from overnight price action, the bulls have taken control!...for now... I still look for a legitimate test of the recent lows however over the next week or so,, Sentimentrader notes: "S&P futures are up more than +0.6%. When we've seen an opening gap of +0.5% after March expiry, the futures went up an additional +1.7% on average through Tuesday's open, and gained ground 5 out of 5 times. But then the futures lost ground 4 out of 5 times during the next 3-4 days."
I don't buy on 3rd up gap in a row...especially when the other two up gaps have failed ( haven't filled)..that is a fairly small sample size Kool for opt expiration stuff but price action will tell us...thanks for the heads up though
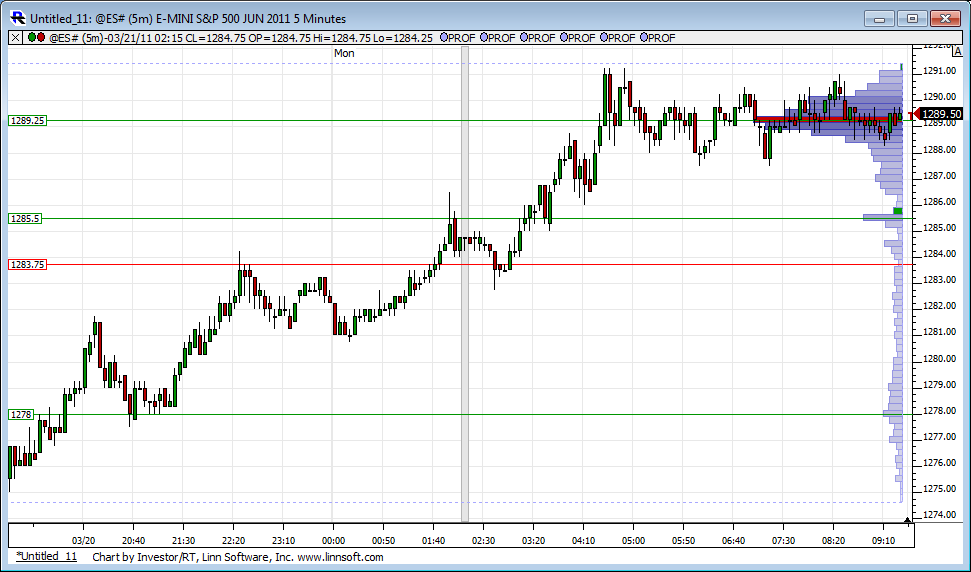
The 91.50 magnet is at O/N highs and 84 - 85 has loads of volume and my prefered direction and target from up here...
so we can watch that O/N high for continuation which would lead to the next magnet up at 1295 and 1300 - 1302..then 1306 - 1308...but I'm picking at short side
further short side failure will go back to the 81 volume
this is just my glorified way of posting the numbers that we've seen for the last week or more...all volume based ....getting closes on 30 minute outside the O/N high will cause me to rethink the plan
Now NQ did as well
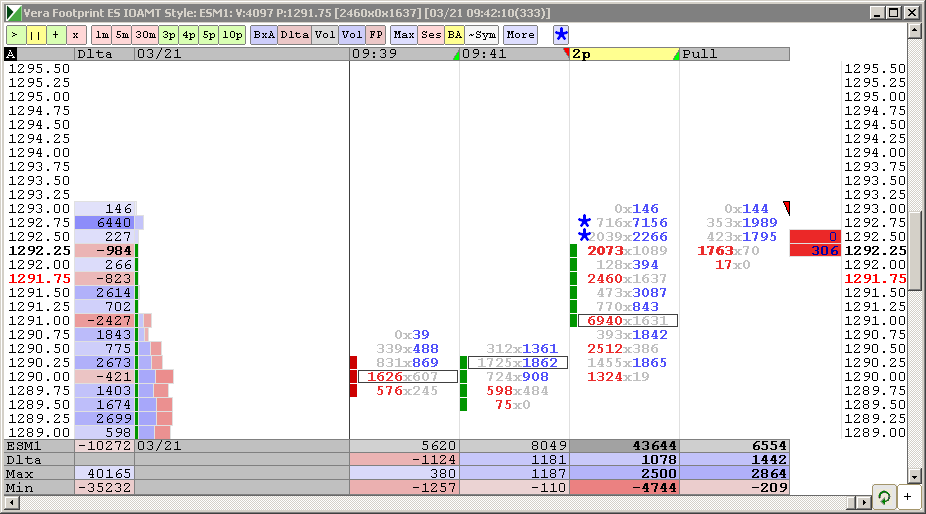
starting second short at 94.50 today..perhaps they will trend it ...smaller as report in 9 minute..targeting 90.50
BIG volume back into a key number on that push...internals seem too strong and too early to be this strong..
revising first target to 91.50 ..
Hi
JP Morgan was a big Buyer today , he/they bought > 90ish LONG with over 2.000 Contrats alltogether again and again...Audiotrader i listen the big one 250,- $ ES Contract for 1 Point. So 1 Point was worth 500.000,- $ and thats realy big Numbers for JP .
@ Koolble , MonkeyMeat, Bruce and all the fine People here : THANK YOU GUYS i learn so mutch here that no any book can teach me and sory that i have not the Knowledge to share also here but i love it every Day moore and moore to be here !!!
Emini Day Trading /
Daily Notes /
Forecast /
Economic Events /
Search /
Terms and Conditions /
Disclaimer /
Books /
Online Books /
Site Map /
Contact /
Privacy Policy /
Links /
About /
Day Trading Forum /
Investment Calculators /
Pivot Point Calculator /
Market Profile Generator /
Fibonacci Calculator /
Mailing List /
Advertise Here /
Articles /
Financial Terms /
Brokers /
Software /
Holidays /
Stock Split Calendar /
Mortgage Calculator /
Donate
Copyright © 2004-2023, MyPivots. All rights reserved.
Copyright © 2004-2023, MyPivots. All rights reserved.