ES Short Term Trading for 3-21-2011
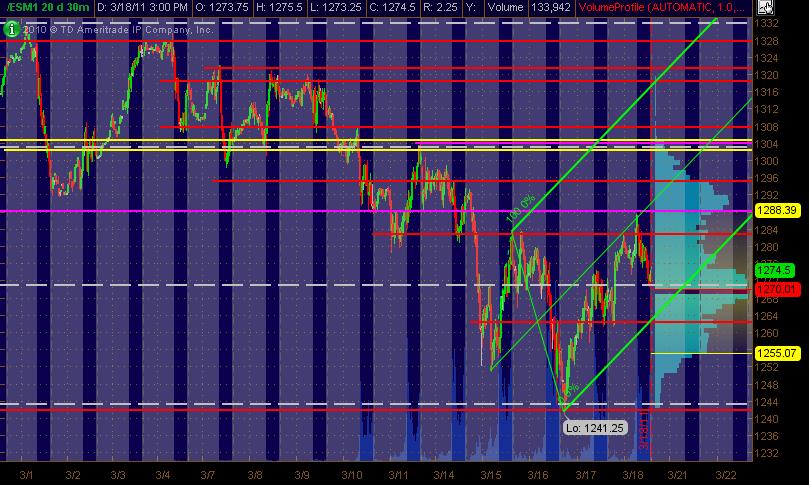
Thought I'd go ahead and launch Monday's ES goodies for folks to add to. Posting my Monkey MAP of the ES June contract, 30min bars for 20 days. The Red lines are potentially significant PASR levels with Magenta as semi-significant. The Whitish dashed lines are the Weekly Pivots. The 2 Yellow lines are a Fib Cluster that stood out to me in that zone. And fwiw, I also included in Green, an Andrews Pitchfork since it "felt" right for what I was looking at. The right vertical Blue lines are Volume at Price. Hope this is a helpful MAP to folks!
Lots of lines ... but I'm showing roughly 100 points with this particular chart.
Click image for original size
Lots of lines ... but I'm showing roughly 100 points with this particular chart.

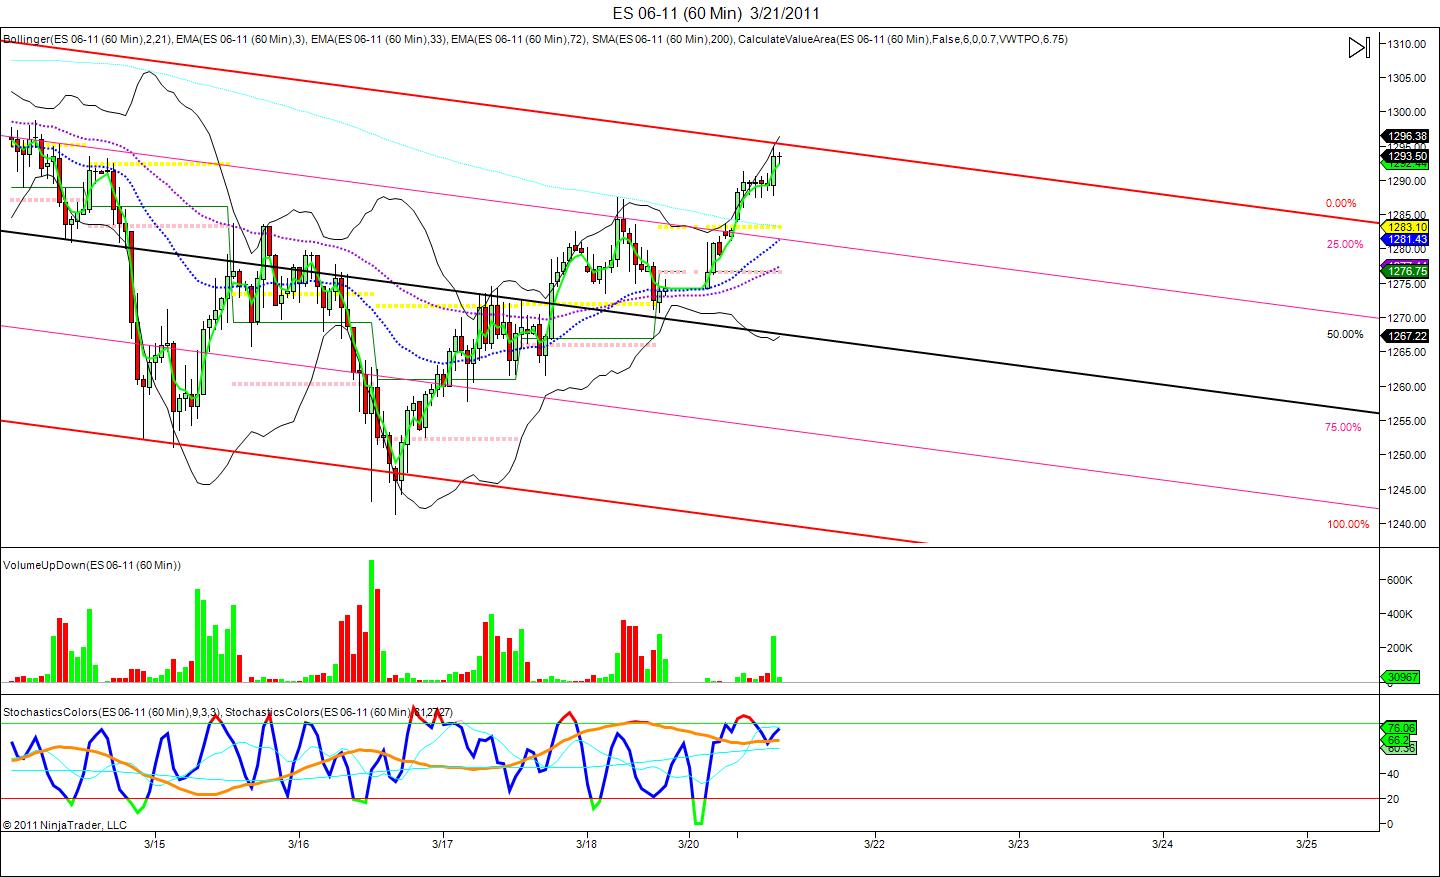
this market seems to be indecisive about price... shaping up to be a real yawner today if they can't get it figured out. on my 1 hour chart, looks like we are getting close to a top. so with my luck this morning, that would mean buy it
Click image for original size
stopped out and tring again from 95.50...report out of the way now
textbook $tick and volume divergence..but will it be enough..targeing 93.50 first.....hoping this is it and dumb money is now buying
took short 1295
stop loss 4 points
target 1292
stop loss 4 points
target 1292
classic stuff....volume comes in infront of the key number and then we get the divergence with a first target back to the key volume.....the step one volume!
ad line is at 2100.....next target is 91.50 if runners not stopped.....otherwise will need to sell above IB high
ad line is at 2100.....next target is 91.50 if runners not stopped.....otherwise will need to sell above IB high
the simplest way to think about all this is that there will be those of us trying to fiqure out if a volume level is being accepted or rejected .....and that's what makes the bulls and bears...the bulls want 1300 and higher and us bears want 91.50 and lower
the trick is always looking for the subtle directional ( or lack of direction) clues
the trick is always looking for the subtle directional ( or lack of direction) clues
all key volume still at 93.50 today...they are trying to push up away from it on light volume...expect trade back down!!
hoping that was the last push up now...internals breaking down slightly....very slightly!!
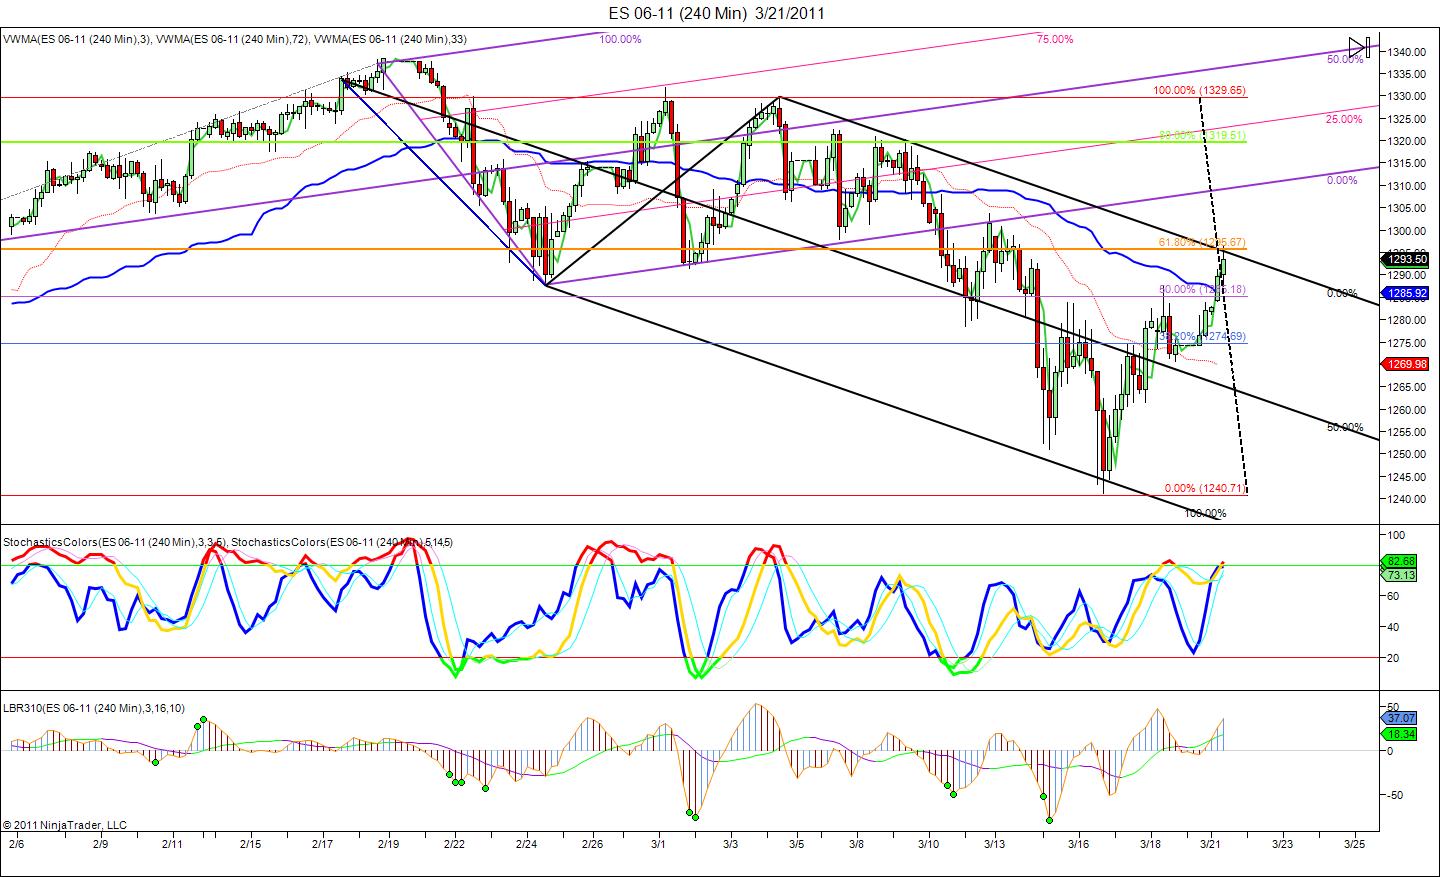
here's the 240 chart showing we are topped out and we are at 61.67 since the down trend began... my way of thinking, if there's going to be a reversal back down it will be here today or tomorrow. hope it works out that way
Click image for original size
Hi
JP Morgan was a big Buyer today , he/they bought > 90ish LONG with over 2.000 Contrats alltogether again and again...Audiotrader i listen the big one 250,- $ ES Contract for 1 Point. So 1 Point was worth 500.000,- $ and thats realy big Numbers for JP .
@ Koolble , MonkeyMeat, Bruce and all the fine People here : THANK YOU GUYS i learn so mutch here that no any book can teach me and sory that i have not the Knowledge to share also here but i love it every Day moore and moore to be here !!!
Emini Day Trading /
Daily Notes /
Forecast /
Economic Events /
Search /
Terms and Conditions /
Disclaimer /
Books /
Online Books /
Site Map /
Contact /
Privacy Policy /
Links /
About /
Day Trading Forum /
Investment Calculators /
Pivot Point Calculator /
Market Profile Generator /
Fibonacci Calculator /
Mailing List /
Advertise Here /
Articles /
Financial Terms /
Brokers /
Software /
Holidays /
Stock Split Calendar /
Mortgage Calculator /
Donate
Copyright © 2004-2023, MyPivots. All rights reserved.
Copyright © 2004-2023, MyPivots. All rights reserved.