ES numbers for 4-12-11
1326.75
1323.50 ****
1319.75
1310.50 - 1312.50 **** critical for O/N to hold this one..reports in early AM too !!
lets see what the O/N deals us///
1323.50 ****
1319.75
1310.50 - 1312.50 **** critical for O/N to hold this one..reports in early AM too !!
lets see what the O/N deals us///
Bruce,
what does that 12-10 area represent?
I don't have true volume profile running, I have TS's activity bar on weekly showing a HVN at 1312-1310 area from week ending 4-1-11, is that what you are referring to?
I see on daily volume actiivty 1311.50-1310 HVN from mar 29
don't you usually expect first tests of HVN (from above) to bounce?
this is opex week.
yes Paul...lots of volume in there....a key zone for buyers to TRY and hold
sometimes we just chop around high volume Paul.....easier to use HV zones as targets then to trade from...IMHO....
I'd prefer to see them get below this zone and then watch to see if volume dires up as we attempt to move lower....then get long and trade for the retest back up into the zone
reverse if they rally away from it up.......if volume dries up then get short for the retest of it from above....
Trading right at the zone is more delicate!!
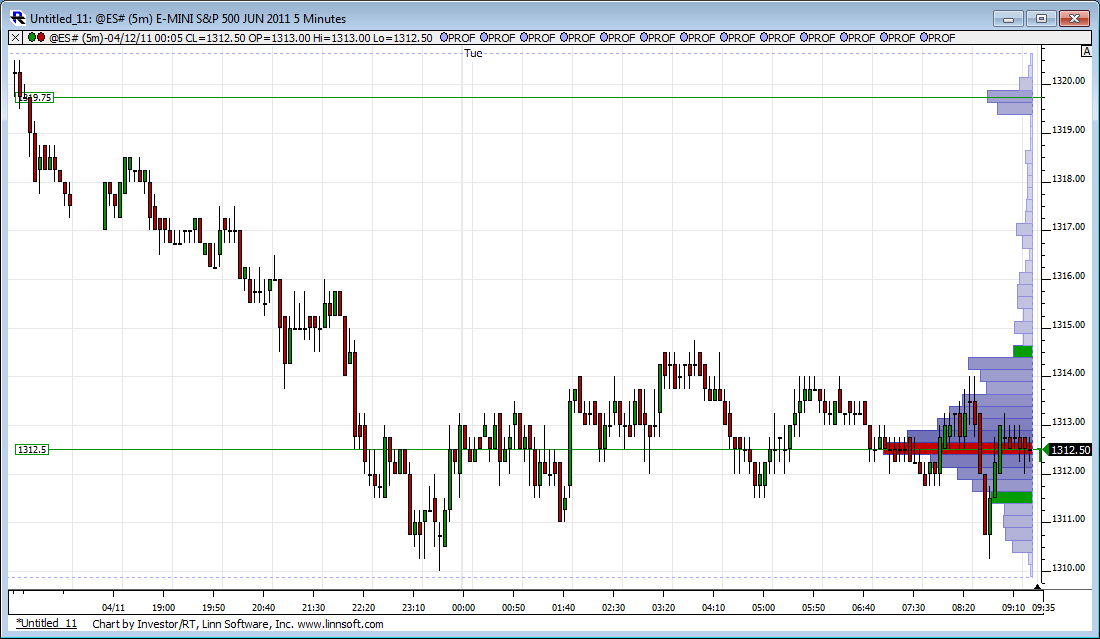
small short working off that 14.75 high...16 will take me out as the O/N midpoint sits at the next number of 19.75 and not taking that big of a loss
nedd to get back below the OR high for me....otherwise this gonna be a failure
taking two off at 1312.50 ...holding one to try for O/N low....but will be tricky as this is trading right back into a volume distribution......like a miniature neutral day with volume in the center
1310.00 holding for now. Went long on the successful retest of the level. Prolly use something around the VWAP as a target, 12.50 maybe...
Volume accumulating at 11.50
Volume accumulating at 11.50
Here is a look at the CD picture. Attempted break away moves on both sides of the range have failed so far however VWAP is in a downtrend. Having said that, volume is bunched extremely tight between 1314 and 1311.
Click image for original size
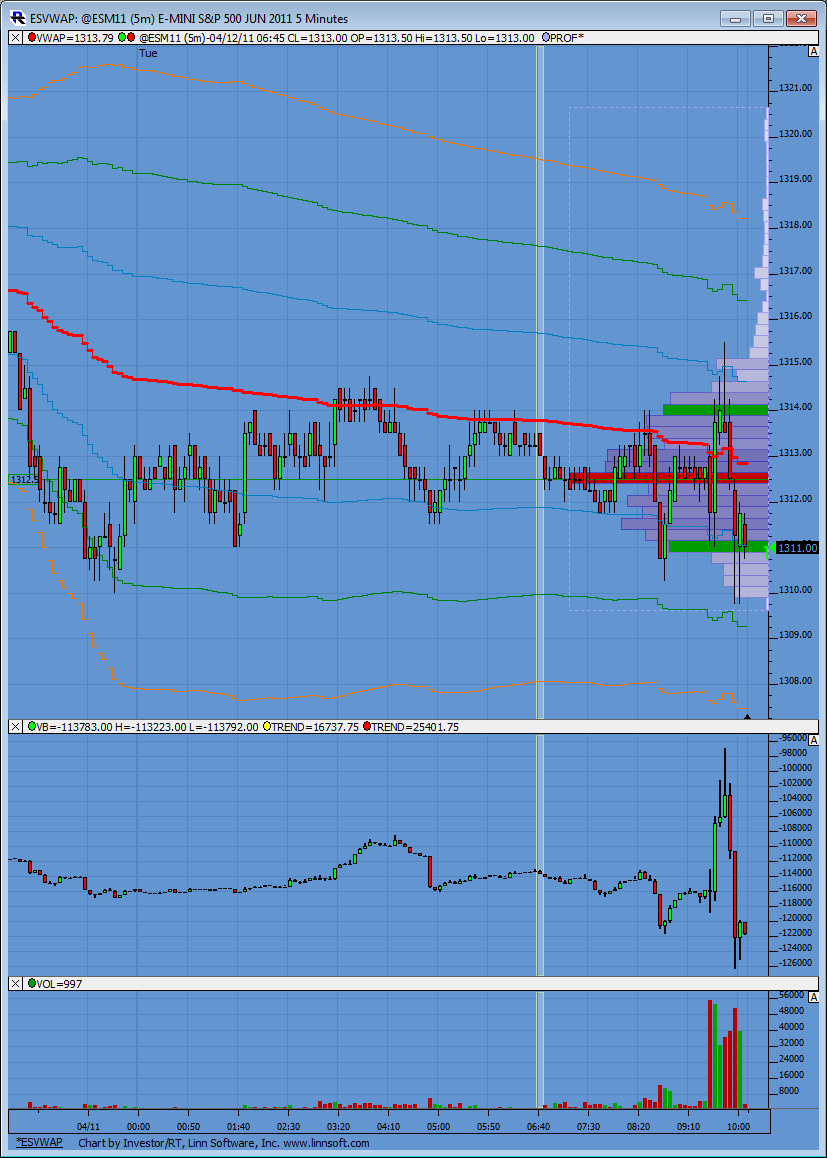
went flat at the O/N low......Paul you can see the big symetric distribution from Lorns chart......so I was watching volume dry up as we went up......just telling yoi that because of the concept I mentioned before...a good example today
so we need to watch for big volume to EVENTUALLY break away from this area and establish new value at higher or lower levels.....till that happens we will try to push away and revert
so watch volune closely down here.....don't get caught in the break away down here if it comes...
so we need to watch for big volume to EVENTUALLY break away from this area and establish new value at higher or lower levels.....till that happens we will try to push away and revert
so watch volune closely down here.....don't get caught in the break away down here if it comes...
thanks for the explaination
Emini Day Trading /
Daily Notes /
Forecast /
Economic Events /
Search /
Terms and Conditions /
Disclaimer /
Books /
Online Books /
Site Map /
Contact /
Privacy Policy /
Links /
About /
Day Trading Forum /
Investment Calculators /
Pivot Point Calculator /
Market Profile Generator /
Fibonacci Calculator /
Mailing List /
Advertise Here /
Articles /
Financial Terms /
Brokers /
Software /
Holidays /
Stock Split Calendar /
Mortgage Calculator /
Donate
Copyright © 2004-2023, MyPivots. All rights reserved.
Copyright © 2004-2023, MyPivots. All rights reserved.