ES Short Term Trading for 4-21-11
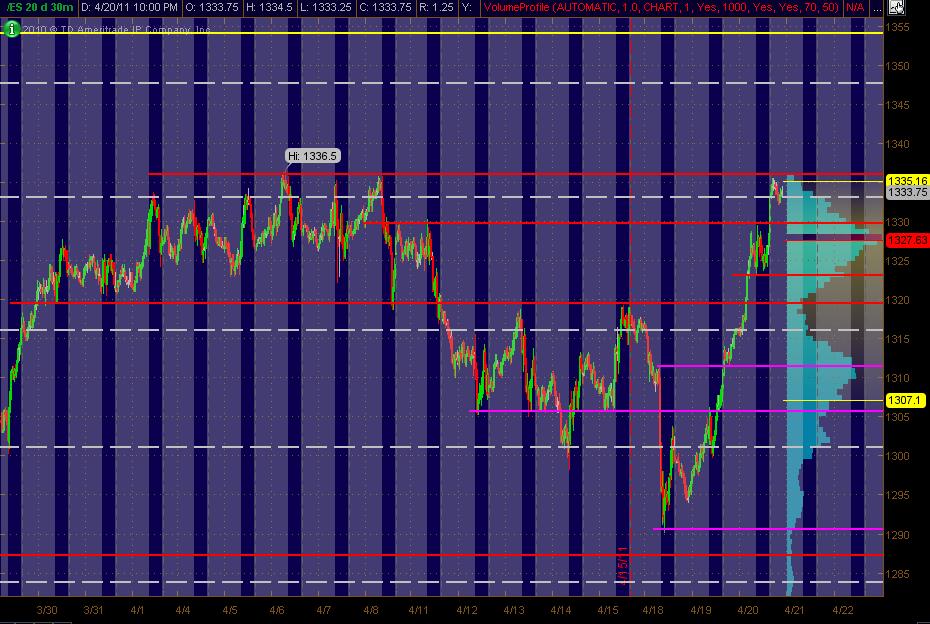
Here's my MonkeyMap of the ES 30min chart of 20 days. The Gray background is the "overnight" trading. The right vertical axis shows the 20-days worth of Volume at Price in Light Blue. The Red lines are my PASR "zones" of potential S/R with the Magenta potential semi-significant. The White dashed lines are the Weekly Pivots. Have a Yellow line above the current market that looks like a potential significant Fib cluster area to me. Hope this helps some in this whacky current market action!
Don't have much in the way of PASR above what is a 3 year high for now ... my bad!
Click image for original size
Don't have much in the way of PASR above what is a 3 year high for now ... my bad!
(onsy twosy here because of the mov avg signal!
just bailed at 1330.75...trying to be ultra conservative since im usually trading many more contracts!....
nice quick trade kool....had my buy order at 28.75, which was hit but not filled...twice !
Click image for original size

Click image for original size

Next decent cycle turn point due couple min after 11:00 am ,est
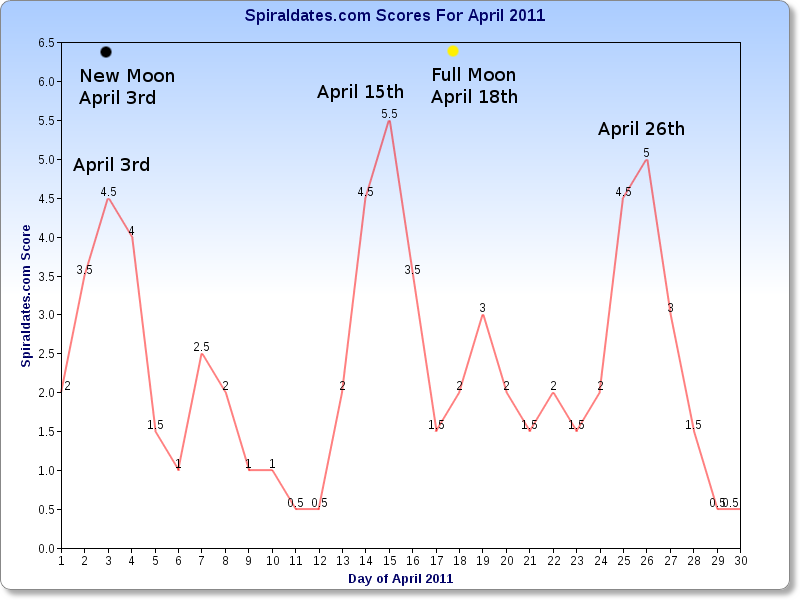
Interesting chart.... 3rd was a top, 15th was a bottom..26th?...
Click image for original size
open and drive that can't retest the open and 1332 was a key number...so it bodes well for as 26 - 27 retest..I'd like to see the 90 minute close below YD RTH high...todays profile is still symetric so we need to break out of that type of trade
mini turn points might include 11:03 and more important 11:08, but only for reference... i trade the projections!
short again on the 32...only trying to get to 30.75 and then tighten as we are symetric
Well, i just woke up from my nap and was about to post how it looks like 1331.00 held it, but check out the last 4 min of trading!...ha! Crafty bastards! too late to take advantage of!... c ya next week!
Emini Day Trading /
Daily Notes /
Forecast /
Economic Events /
Search /
Terms and Conditions /
Disclaimer /
Books /
Online Books /
Site Map /
Contact /
Privacy Policy /
Links /
About /
Day Trading Forum /
Investment Calculators /
Pivot Point Calculator /
Market Profile Generator /
Fibonacci Calculator /
Mailing List /
Advertise Here /
Articles /
Financial Terms /
Brokers /
Software /
Holidays /
Stock Split Calendar /
Mortgage Calculator /
Donate
Copyright © 2004-2023, MyPivots. All rights reserved.
Copyright © 2004-2023, MyPivots. All rights reserved.