ES Short Term Trading for 4-21-11
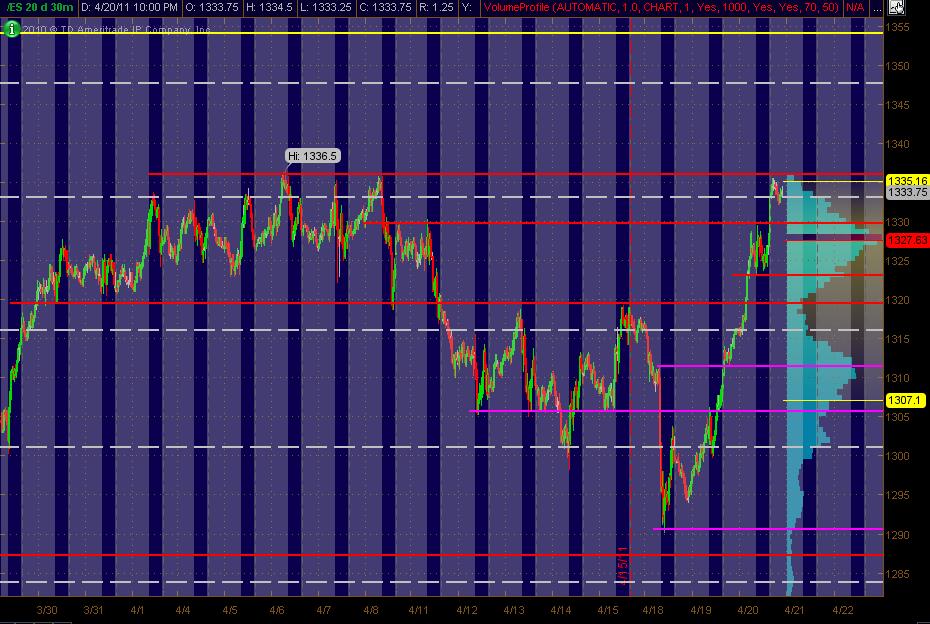
Here's my MonkeyMap of the ES 30min chart of 20 days. The Gray background is the "overnight" trading. The right vertical axis shows the 20-days worth of Volume at Price in Light Blue. The Red lines are my PASR "zones" of potential S/R with the Magenta potential semi-significant. The White dashed lines are the Weekly Pivots. Have a Yellow line above the current market that looks like a potential significant Fib cluster area to me. Hope this helps some in this whacky current market action!
Don't have much in the way of PASR above what is a 3 year high for now ... my bad!
Click image for original size
Don't have much in the way of PASR above what is a 3 year high for now ... my bad!
Btw, Bruce ROCKS on the git-fiddle and can create some way cool tunes. Maybe there's something to be said for the right-brained "artistic/musical" aspect of "reading" the market ... or hearing how the price dances with the music-of-volume and distilling the multiple overlapping melodies. Just a thought as to how Bruc-ifer tunes into divining the calls, often to the tick (or two), that he posts. Now that he's got a microphone and figured out how to vid his stuff ... maybe he'll share how to strum the market in a big Marshall stack kind of way. Just a thought!!
Ps. Fun reads on right/left brain activity http://www.archetypewriting.com/articles/articles_ck/muse_block_ckFlowArticle.htm
Google for more theories
Ps. Fun reads on right/left brain activity http://www.archetypewriting.com/articles/articles_ck/muse_block_ckFlowArticle.htm
Google for more theories
Back in feb, after the 1343 high(basis Mar contract) I showed a chart hoping it wasnt the daily projection... it projected 1291.25! The last 2 weeks ,shorter term charts were hinting at 1290.50 and finally ,the 'superb' buying opportunity occurred at 1290.25. I have been trying to increase my size (4-10 lots) instead of my onsy, twosy's and have been trading the euro a lot, which has much more volitility. Positive seasonality yesterday, and today are propelling the market higher, tagging the yearly highs last night. That could end Monday, however! Had to buy a new computer and re-load ninjatrader 7, but i still cant get my fib extentions to work properly! So i cant show any meaningful charts untill i get that straightened out.. just went long at 1332.50 and exited 1334.25 (expecting 1335.25) on a short term buy scalp.. Hope to get my problems figured out soon!
nice to see you back kool !
Interesting facts: day after Easter(Monday) , the dow was down 16 of the last 20 years, but was up 6 of the last 7. And from sentimentrader, referring to yesterday.. "This was only the sixth time the S&P was near a 52-week high, then gapped up at least +1% and just sat there, with the narrowest intraday range of the past two weeks. Four of the previous five led to a higher market going forward in both the short- and intermediate-term (9/13/96, 7/3/97, 2/2/98, 3/5/99 and 2/8/00), so not too shabby there.
While stocks rallied again, expectations of future volatility tanked, which is unusual for this time of year. There has been only one other time in its history that the VIX closed at a 52-week low at any point in the week leading up to the Easter holiday, which was in 2002.
Most troubling is that while the VIX is dropping, S&P 500 traders are still paying dearly for put protection (see below). When we've seen this combination in the past, the market was within 1-2 weeks of a peak 6 out of 7 times." This reinforces my view of a short term top coming within a few days and a decline back to the 1320 and change number that both Bruce and i thought would hit yesterday!
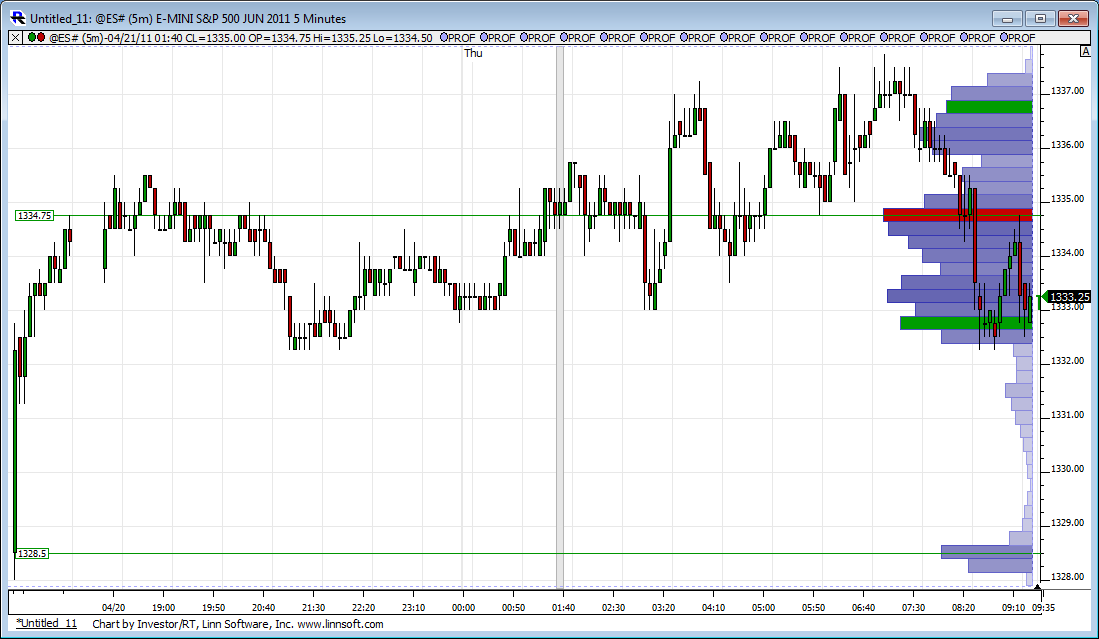
Originally posted by aynWont posting much till i figure out how to change my fib extention tool.. but i would think 1329.75-1330.50 might be a decent buy scalp....thats also where the 30 min prc lies... 1328.00 is the overnight low.
nice to see you back kool !
some reports coming out in 15 minutes..
Philadelphia Fed Survey
10:00 AM ET
FHFA House Price Index
10:00 AM ET
Leading Indicators
10:00 AM ET
Courtesy of ECONODAY
Philadelphia Fed Survey
10:00 AM ET
FHFA House Price Index
10:00 AM ET
Leading Indicators
10:00 AM ET
Courtesy of ECONODAY
Well 1330.50 proved to be a nice little bounce...i was/am targeting lower...Remember, news out soon!
Click image for original size
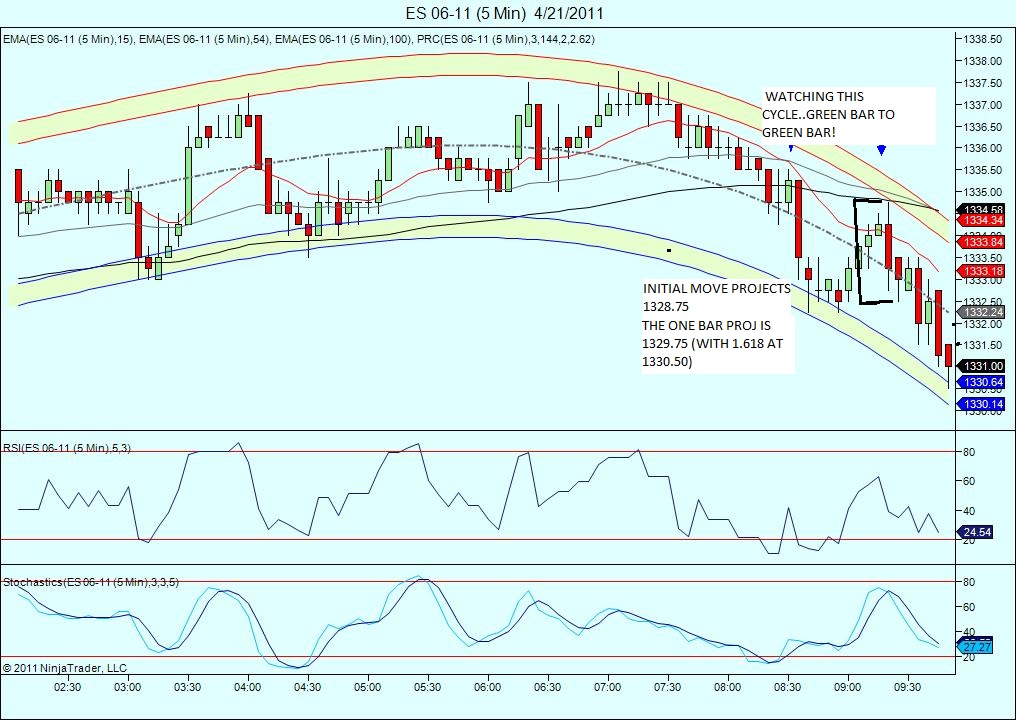
Note the moving avgs just crossed giving a negative trend signal!
got long at 1329.00 took half off at 1330. Holding one still for around 1332
Well, i just woke up from my nap and was about to post how it looks like 1331.00 held it, but check out the last 4 min of trading!...ha! Crafty bastards! too late to take advantage of!... c ya next week!
Emini Day Trading /
Daily Notes /
Forecast /
Economic Events /
Search /
Terms and Conditions /
Disclaimer /
Books /
Online Books /
Site Map /
Contact /
Privacy Policy /
Links /
About /
Day Trading Forum /
Investment Calculators /
Pivot Point Calculator /
Market Profile Generator /
Fibonacci Calculator /
Mailing List /
Advertise Here /
Articles /
Financial Terms /
Brokers /
Software /
Holidays /
Stock Split Calendar /
Mortgage Calculator /
Donate
Copyright © 2004-2023, MyPivots. All rights reserved.
Copyright © 2004-2023, MyPivots. All rights reserved.