JI
jimkane
Rep: 3,058
Posts: 33,089
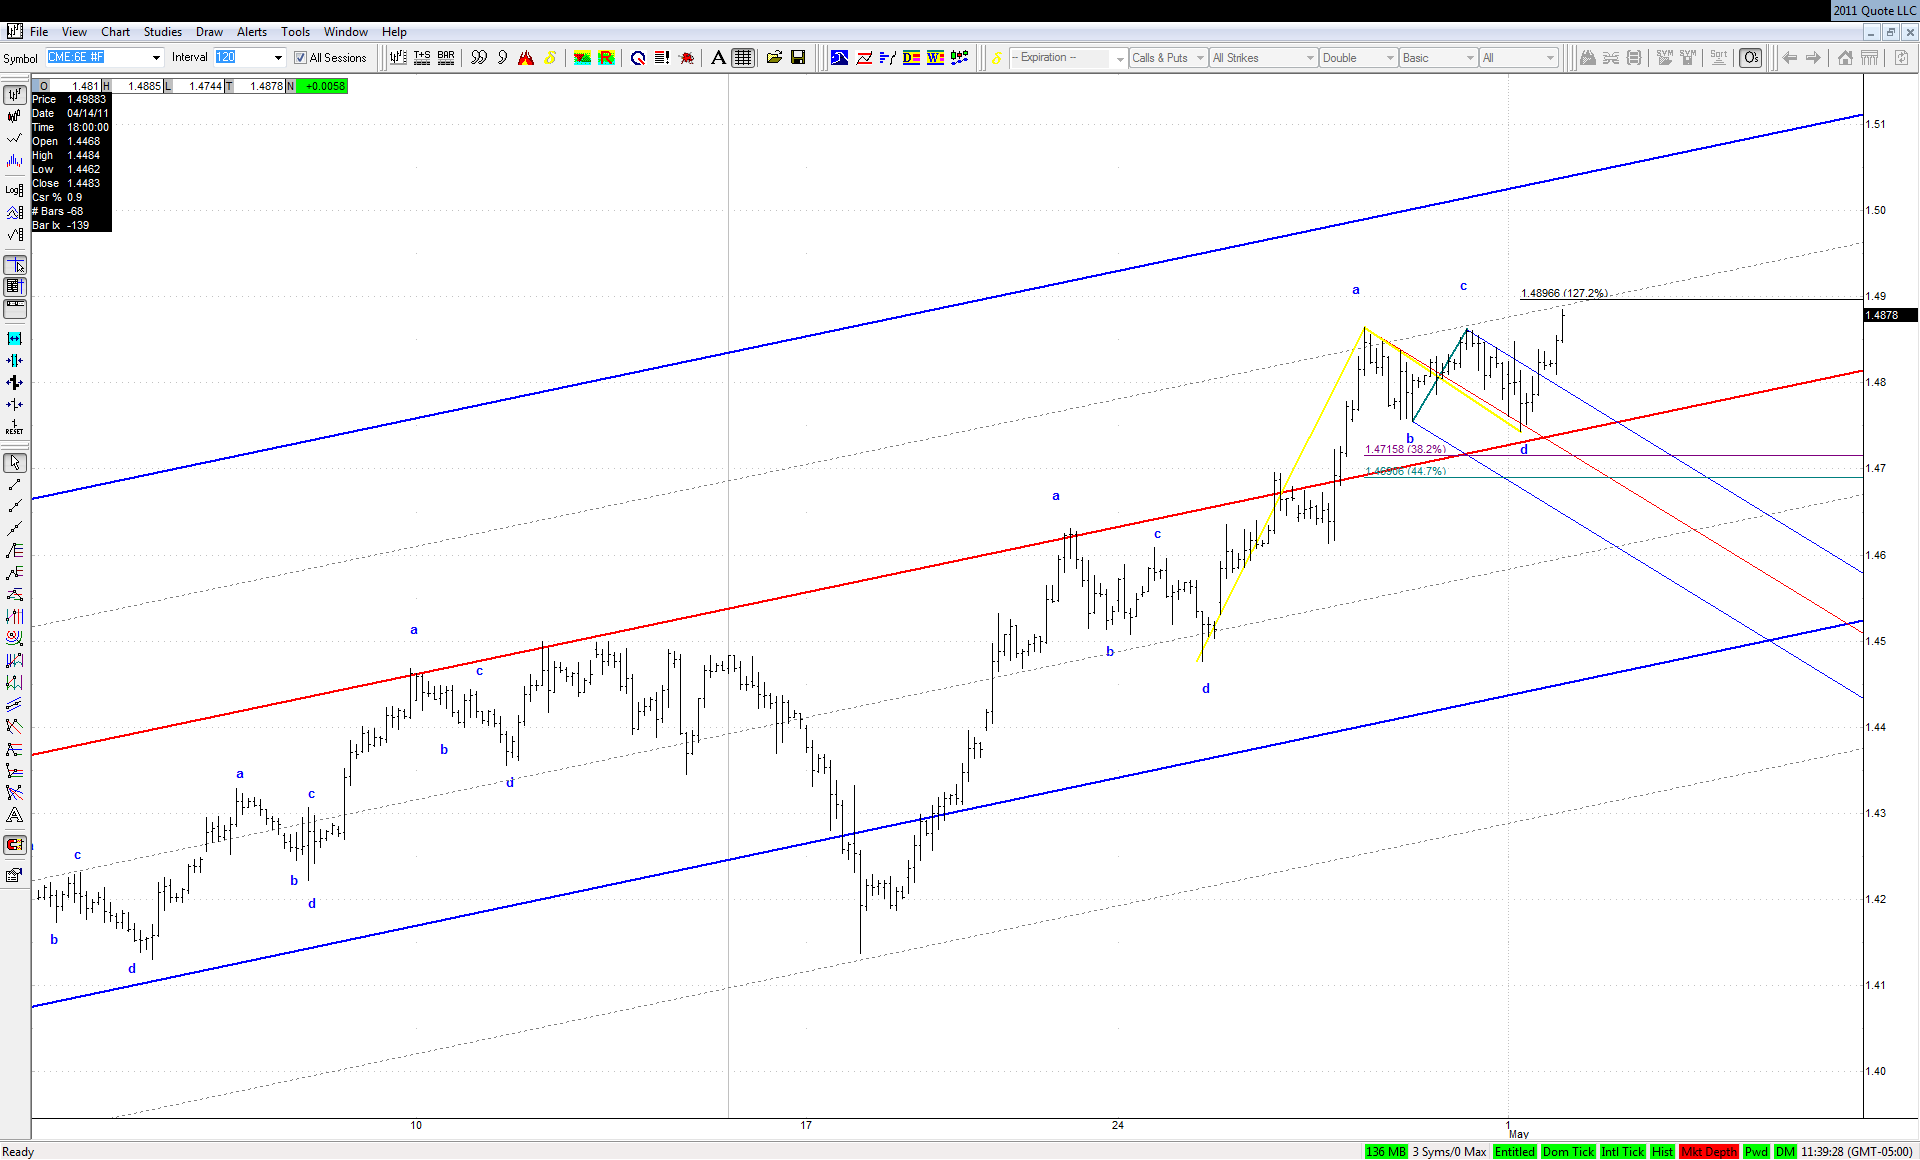
Okay, no one has started the new topic, so here it is. Silver ready to hit 48, gold at another new all-time high, ES futures are up and rising, the Aussie is looking strong, CL another new high for the move, and working on that contract high. Same old, same old. 'Risk on'.
TX
tx_ches
Rep: -10
Posts: 514
Jim could tell you what the D point would need to be with his spreadsheet. But I haven't figured out the calcs -- still work on it occasionally for a fun mental exercise.
Originally posted by rat89
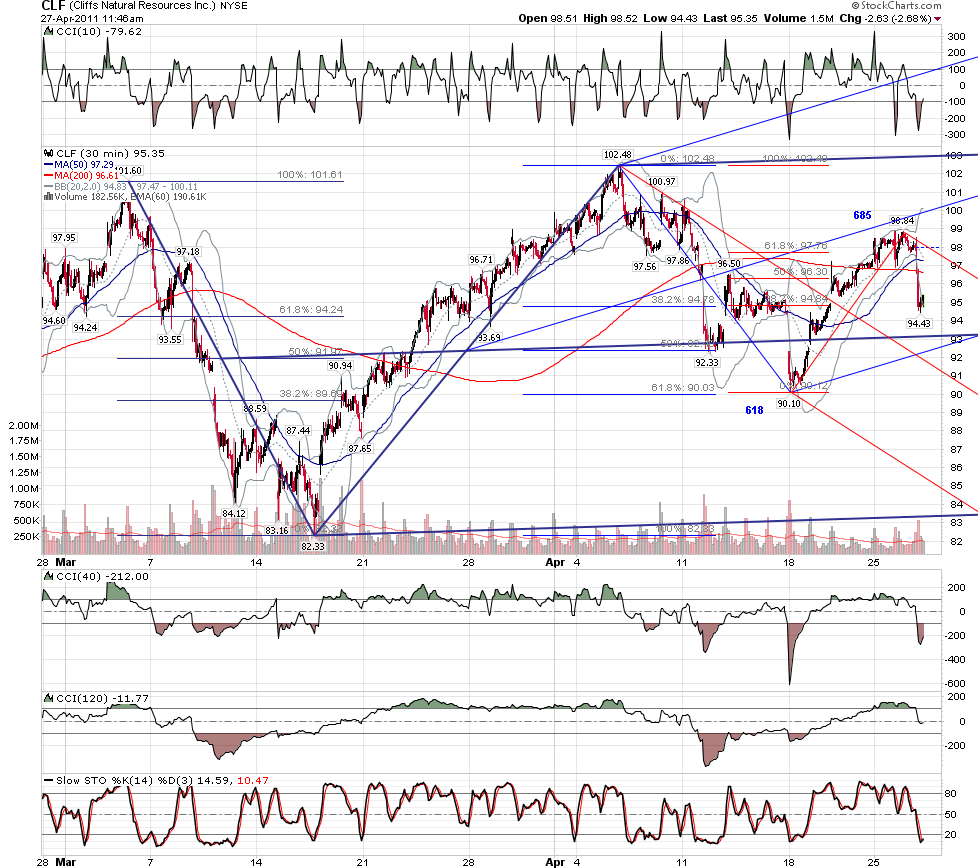
looks like the potential makings of a 5 point....but the b is low, 886....the bounce highs are a series of 685's....is slb heading down to the 78 - 76 area?
RA
rat89
Rep: 0
Posts: 7,015
tx....took a look at clf....fascinating....another chart with the makings of a 5 point, but the indicators are saying bounce....is this planning to drop below the march low after a bounce??
Click image for original size
JI
jimkane
Rep: 3,058
Posts: 33,089
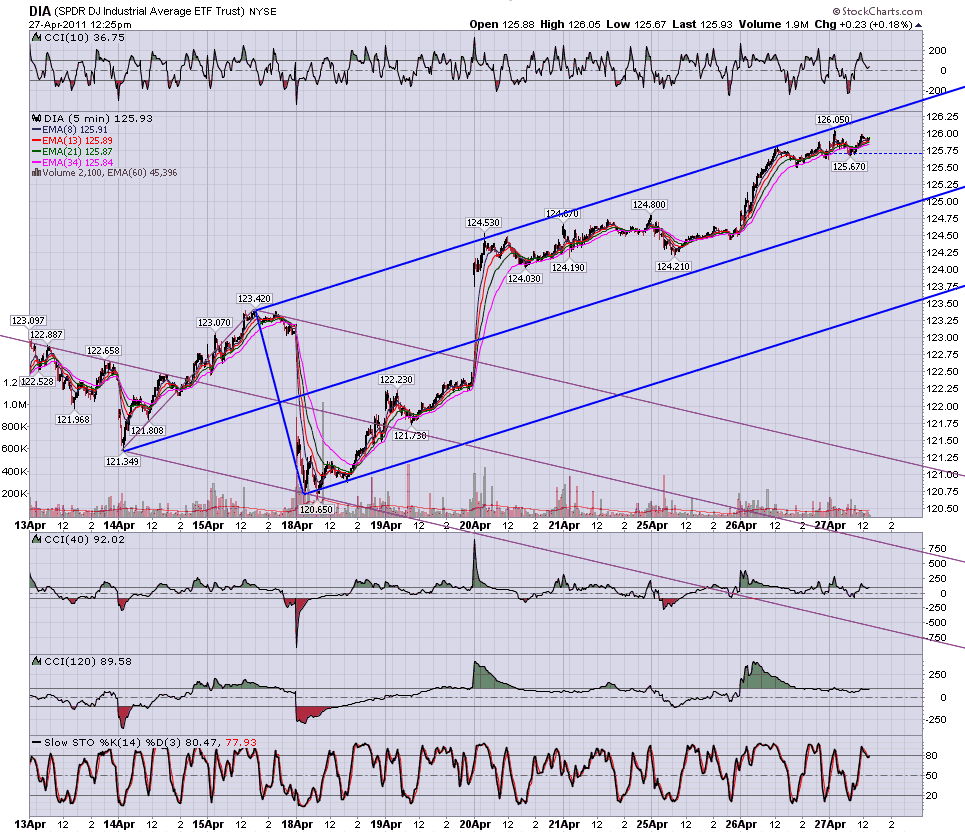
Okay, there's the BS Fed announcement. Now let's see how that press conference goes... 2:15 PM I heard?
JI
jimkane
Rep: 3,058
Posts: 33,089
POS sets a new all-time high, up over 26 off the after-market low I was talking about yesterday. Here's my quote. Were my observations on with this one, or what?
Originally posted by jimkane
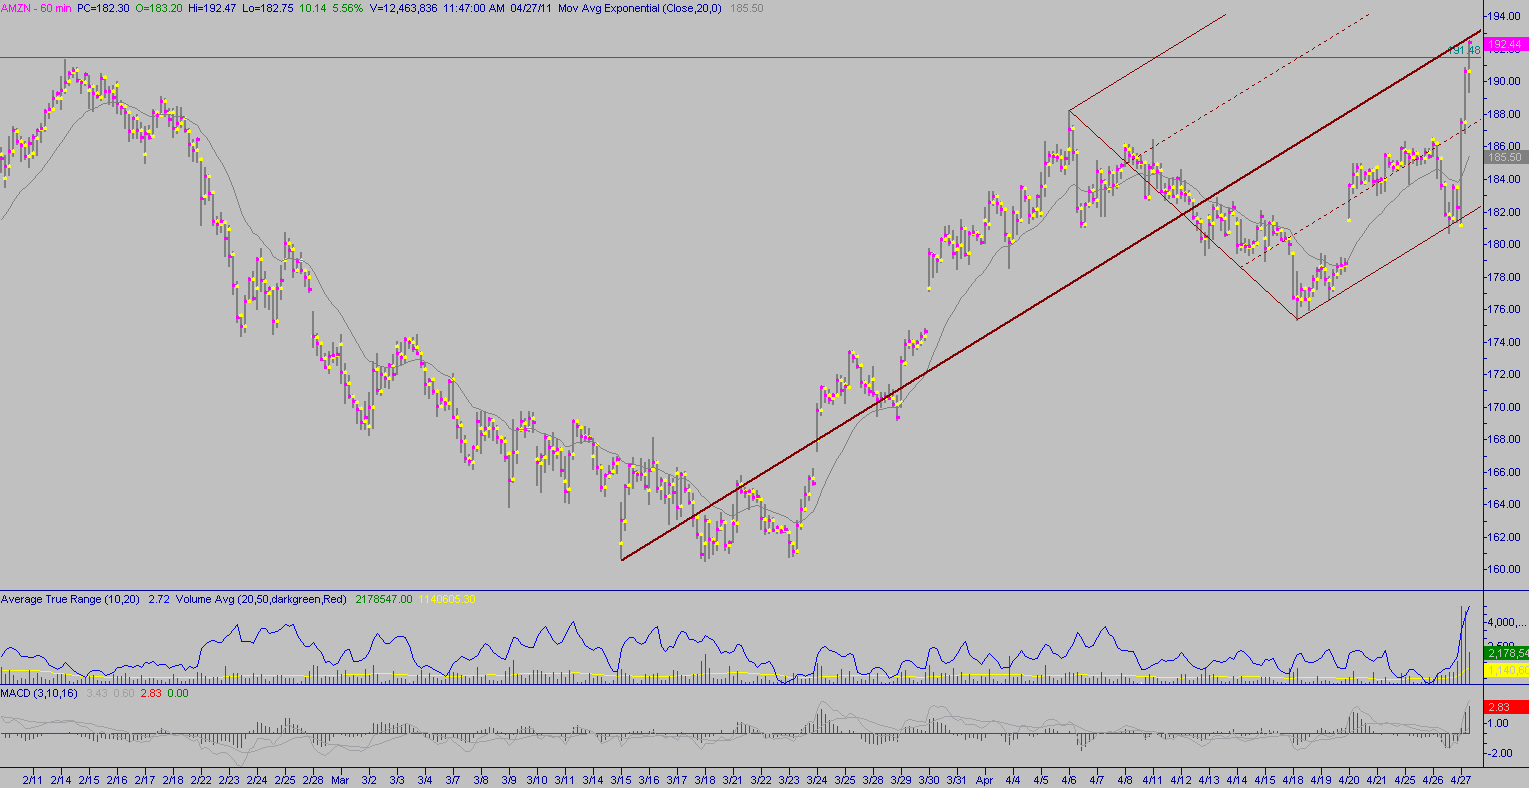
And AMZN is back to the high for the move there. Point? The low end of guidance going forward is at 25% of expected. 25%! This stock should be cut in half, or just plain crushed, ala FNSR. Instead as soon as they try to take it down at all buyers magically come in en masse and gun it up, and now it's actually up from the closing price. Up! With forward guidance low end at 25% of expectations! That is a big clue to me that they are not ready for downside yet. Just a thought.
Originally posted by tx_ches
AMZN 60 min.
Can anything stop it?
Click image for original size
RA
rat89
Rep: 0
Posts: 7,015
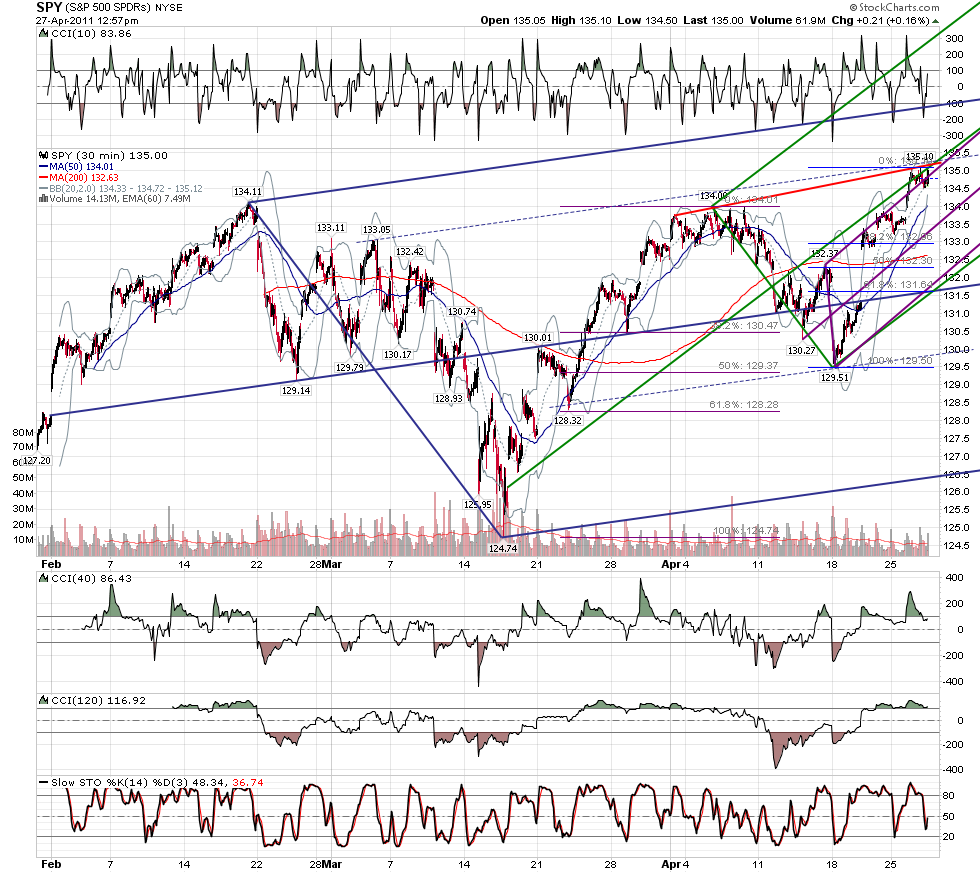
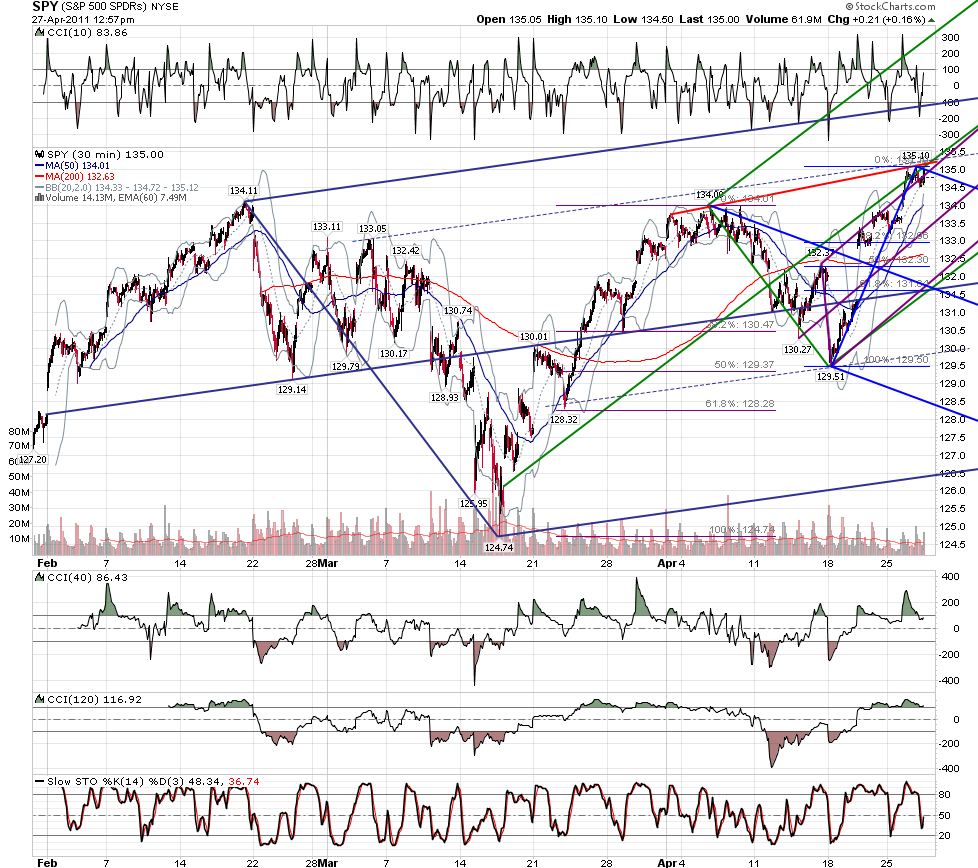
134.11 > 127.74 = 1.128 @ 135.31
134.00 > 129.51 = 1.27 @ 135.21
135.10 > 134.50 = 1.27 @ 135.26
or is it a fake out and we don't get it? hard to believe they won't push it...
just in case scenario
134.00 > 129.51 = 1.27 @ 135.21
135.10 > 134.50 = 1.27 @ 135.26
Click image for original size
or is it a fake out and we don't get it? hard to believe they won't push it...
just in case scenario
Click image for original size
JI
jimkane
Rep: 3,058
Posts: 33,089
I can't see any chance of this selling off in here, rat. I see upside. But, who knows when Bern-Qwacke opens his mouth shortly...
AMZN is just in a frenzy. 195, and rising strongly. Might hit 200 soon. No, this market isn't quite ready for a sell-off just yet, I don't think. But, maybe this AMZN move is the final signal of the final blowoff... I'm just not thinking short side at all yet...
AMZN is just in a frenzy. 195, and rising strongly. Might hit 200 soon. No, this market isn't quite ready for a sell-off just yet, I don't think. But, maybe this AMZN move is the final signal of the final blowoff... I'm just not thinking short side at all yet...
JI
jimkane
Rep: 3,058
Posts: 33,089
Watch how AMZN acts on this checkback (put a regression channel on a 1-min chart starting at about 10:15 to see what it is doing, or just use a few lines), as the ES sits one tick from the 'bulls#%&' market high. Clue time.
TX
tx_ches
Rep: -10
Posts: 514
It is fascinating. If you put on the regular non-schiff versions of your blue sets, I found 3 lines came in at today's low. I have the uml of the large blue standard set and lml of the small blue standard set and the division (quartile) line of the red set all around that low.
The indicators except for CCI 120 do seem to be in oversold territory suddenly.
The indicators except for CCI 120 do seem to be in oversold territory suddenly.
Originally posted by rat89
tx....took a look at clf....fascinating....another chart with the makings of a 5 point, but the indicators are saying bounce....is this planning to drop below the march low after a bounce??