ES numbers 4-28-11
key support zone and probable magnet:
1345 - 1347.25 - this has VPOC, vwap, the Va high, the midrange.....I think that will need to get tested and soon perhaps in O/N trade still
1352 - this was the biggest volume from YD trade at around 3:35, then the 4 pm close was here and then the 4:15 close....so lots of interest there
Yesterday that was a spike in the afternoon and the market did not get TIME to digest that late afternoon rally( read Daltons MOM) so where we open in relation to that spike means something
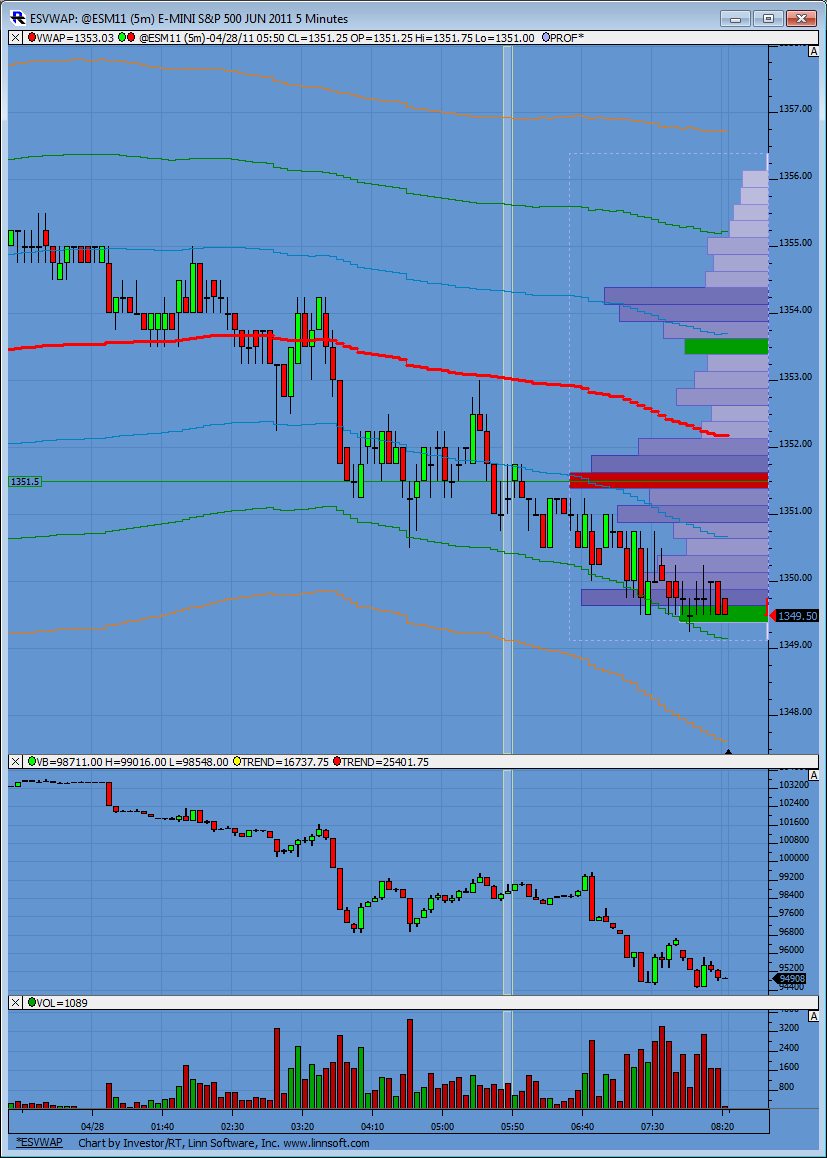
Adding to Bruce's comment you can see price is currently pushing downward below VWAP and has for some time. Volume seems to be following price downward (even though this is O/N volume).
Click image for original size
there is also a pattern that shows up pretty regularly:
When FOMC annc day is a good gainer (like yesterday), day that follows often is weak (as the long positons that squeezed bears yesterday are unwound)
When FOMC annc day is a good gainer (like yesterday), day that follows often is weak (as the long positons that squeezed bears yesterday are unwound)
46.75 was breakout to the upside point from yesterday and it has been teted, usually produce some sort of a bounce.
How far does that bounce get?
pure chart read, just price on the page. no footprints, no volume at price, no volume. just price on the page....
if bounce cannot break above 1351 handle and twist that level into a support, decline to under 46 targets test of
open of 30m bar completed at 3:00pm yesterday (return to the scene of the crime, I call it a breaker bar, the bar opens in traffic but breaks out), that open is 1344.50
and there would be a range of potential support 1344.50 down to
50% of the week which is 1341.50
How many times can the bears get squeezed?
usually, after PA like yesterday's I expect to see yestHOD tested, or at least come within 3 ticks. HOD yest was 54.25
that is line in sand.
for traders looking at footprints, footprints at that level might be worth something. If they are,m could you post and explain what you saw.
usually, after PA like yesterday's I expect to see yestHOD tested, or at least come within 3 ticks. HOD yest was 54.25
that is line in sand.
for traders looking at footprints, footprints at that level might be worth something. If they are,m could you post and explain what you saw.
Trying to sell 1354.00...chart coming
Originally posted by koolblue
Trying to sell 1354.00...chart coming
Click image for original size
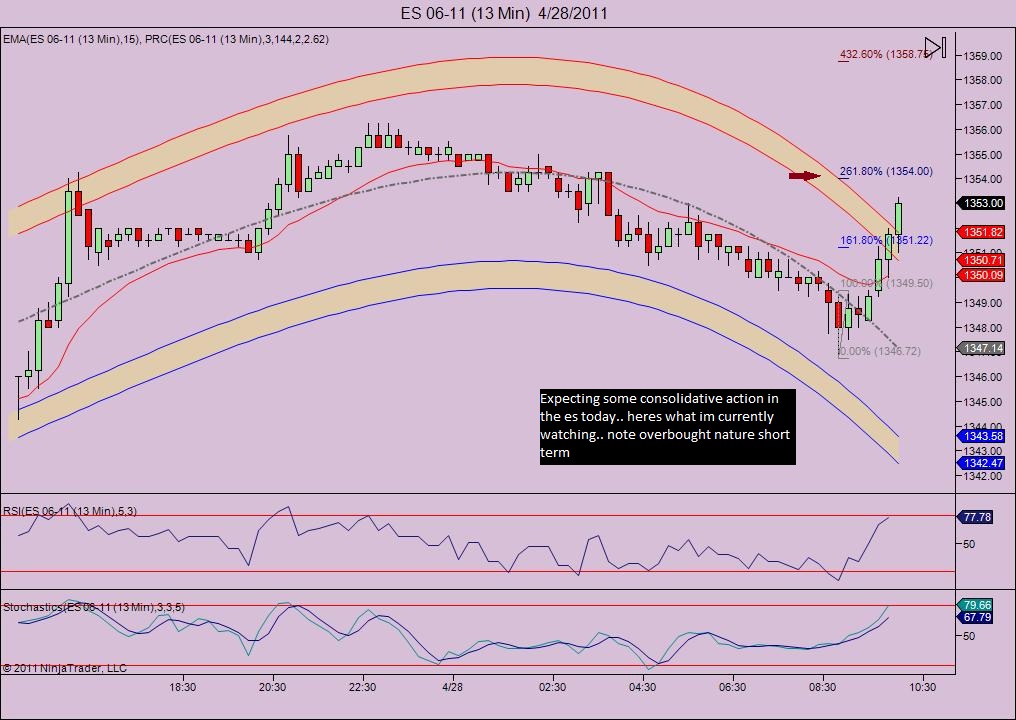
Bingo!!! and no fill so far..Now thats discouraging!
nas indicates the trend... consolidation,imho.... 52.50 is where i would have taken half off if i got filled... Was looing for around 1351.50...order cancelled.. Now i just have to hope we get another pop to test yesterdays . and overnight high (at least 1355.50) or ive missed it!
if it's any consolation, Kool,
I call it a 1 tick fakeout when price approaches a key level and does not sneek above by a tick or two.
the key level was yest H, 54.25
high print today RTH 54.00
I don't know what will happen and neither do you, but more times than not, as long as existing intrady support (your 51.50 remains intact, another test of 54.25 can unfold (not all the time but often enough that I have recognized the pattern.
if a sell-off were going to happen today (down to 44 area, I would rather see yesterday's H taken out by 1 single tick. then, a drop which garnishes a rebound that is a failure swing is pretty good sign for lower.
enough of my blather. good trading to all.
don't you just set that up as a 5 tic reversal chart in Market delta...? perhaps I missed the Point and fiqure option.....I'll need to look again...thanks
Originally posted by Lisa P
Originally posted by BruceM
Lisa I have Zenfire data and we aren't matching up...is that IB data you have on your 5 tic reversal footprint ? Can anyone fire a chart like that up and see if their data matches....?
I had buyers winning into the 11:16 bar but then at 11:30 bar the sellers took over...just want to make sure my zenfire data isn't goofy!!
Bruce, yes, I have IB feed. Please note that I use "point and figure" chart which is NOT time-based, not sure what you use.
Emini Day Trading /
Daily Notes /
Forecast /
Economic Events /
Search /
Terms and Conditions /
Disclaimer /
Books /
Online Books /
Site Map /
Contact /
Privacy Policy /
Links /
About /
Day Trading Forum /
Investment Calculators /
Pivot Point Calculator /
Market Profile Generator /
Fibonacci Calculator /
Mailing List /
Advertise Here /
Articles /
Financial Terms /
Brokers /
Software /
Holidays /
Stock Split Calendar /
Mortgage Calculator /
Donate
Copyright © 2004-2023, MyPivots. All rights reserved.
Copyright © 2004-2023, MyPivots. All rights reserved.