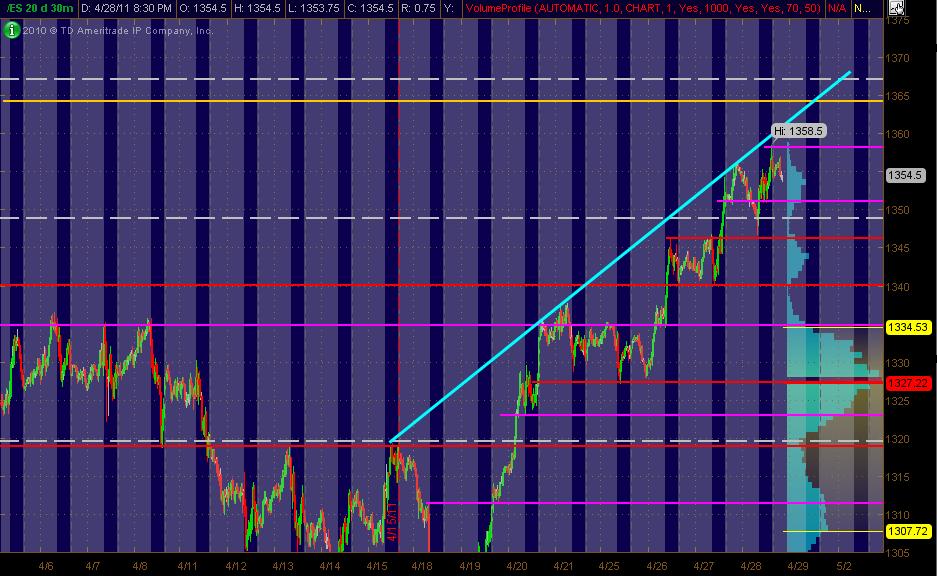
ES MAP for 4-29-11
Here's what I've got looking at the ES 30min chart of 20 days. The Gray background is the "overnight" trading. The right vertical axis shows the 20-days worth of Volume at Price in Light Blue. The Red lines are my PASR "zones" of potential S/R with the Magenta potential semi-significant. The White dashed lines are the Weekly Pivots.
Have a Yellow line above the current market that looks like a potential significant Fib cluster area to me. Also, I've drawn in a Cyan trendline across the top swings of prices. I've adjusted some of the lines/levels/zones since the last posting of my "map". Hope it's helpful to both ES and equity traders!
Have a Yellow line above the current market that looks like a potential significant Fib cluster area to me. Also, I've drawn in a Cyan trendline across the top swings of prices. I've adjusted some of the lines/levels/zones since the last posting of my "map". Hope it's helpful to both ES and equity traders!
Click image for original size
this gonna come back for 57.50 .......still symetric...CD didn't make new highs with price but we have broken that trendline.....levels still way off from YD highs...we'll see..need to get back under 60 minute high before noon close
Just popped...
Click image for original size
Yea Bruce. What CD is doing currently is something I watch very carefully because there is going to be a spring like effect one way or the other to balance this situation.
Originally posted by BruceM
always fascinating to see what happens if negative sentiment CAN'T drive the market down...all us shorts get trapped....that afternoon surge from YD afternoon was a good example but that move fizzled
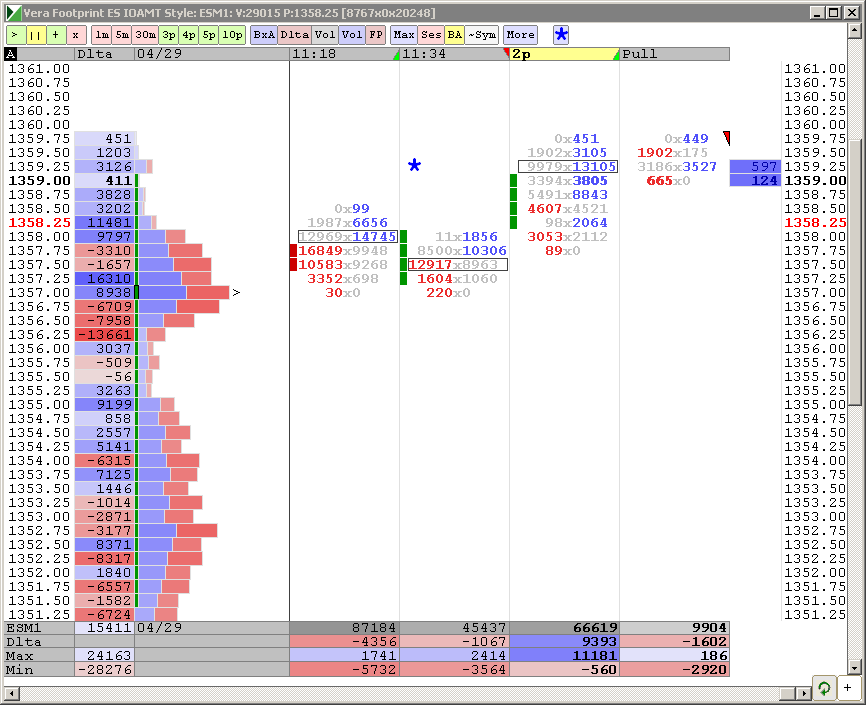
Cycle highs are about 40 min off so there are decent odds we see 1357.00-1357.50 first
added at 60 to short..target is now 57.75...big buyers at 59.25 need to be rewarded on longs soon or else they will bail and bring it down for me...that's what I need...still symetric until proven wrong..perhaps they will give me a lunch time whacking
Bruce, why at 60, please?
yes Lorn..I don't like those coiling or wedging patterns in anything I watch as it often gives those breakout traders a chance to win
It was just 1.5 points off yesterdays highs...normally I'd like to see it 2 points to 5 points in greater volatility but this is dismal.....so they like to drag in the breakout folks and let them think they get rewarded and then bring it back.......
This is a late fade so it gives the market more time to build up NRG and in my opinion a more agdressive fade if I had to rate them....Prefer to have this happen earlier..
This is a late fade so it gives the market more time to build up NRG and in my opinion a more agdressive fade if I had to rate them....Prefer to have this happen earlier..
Originally posted by Lisa P
Bruce, why at 60, please?
flat at 59.25...gotta respect that uptrend in price for now...break even campaign
4 min to target time frame ..and close to the 1361.25-1361.75 sell zone
wow, now that is what I call dumb luck as an exit...!! I guess they like that 57.50 !!
Emini Day Trading /
Daily Notes /
Forecast /
Economic Events /
Search /
Terms and Conditions /
Disclaimer /
Books /
Online Books /
Site Map /
Contact /
Privacy Policy /
Links /
About /
Day Trading Forum /
Investment Calculators /
Pivot Point Calculator /
Market Profile Generator /
Fibonacci Calculator /
Mailing List /
Advertise Here /
Articles /
Financial Terms /
Brokers /
Software /
Holidays /
Stock Split Calendar /
Mortgage Calculator /
Donate
Copyright © 2004-2023, MyPivots. All rights reserved.
Copyright © 2004-2023, MyPivots. All rights reserved.