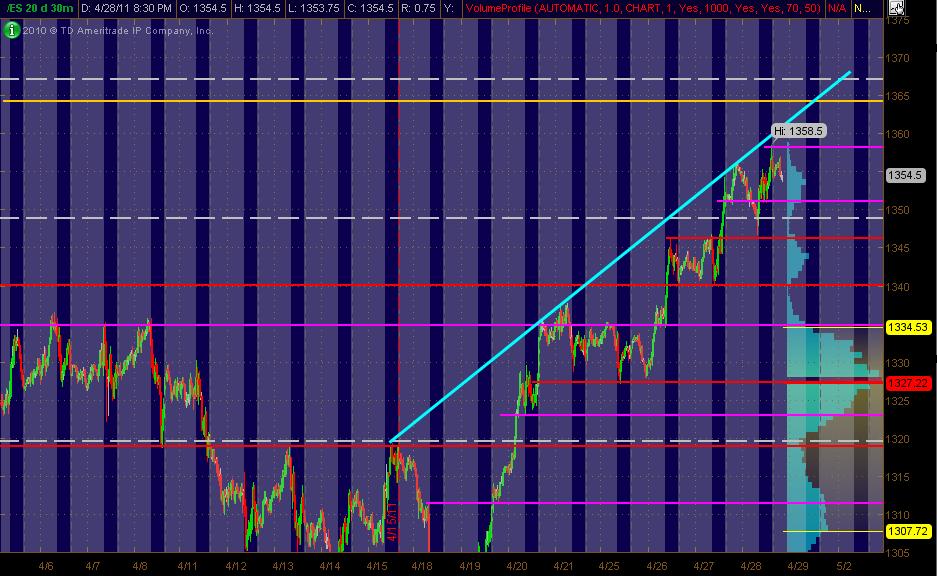
ES MAP for 4-29-11
Here's what I've got looking at the ES 30min chart of 20 days. The Gray background is the "overnight" trading. The right vertical axis shows the 20-days worth of Volume at Price in Light Blue. The Red lines are my PASR "zones" of potential S/R with the Magenta potential semi-significant. The White dashed lines are the Weekly Pivots.
Have a Yellow line above the current market that looks like a potential significant Fib cluster area to me. Also, I've drawn in a Cyan trendline across the top swings of prices. I've adjusted some of the lines/levels/zones since the last posting of my "map". Hope it's helpful to both ES and equity traders!
Have a Yellow line above the current market that looks like a potential significant Fib cluster area to me. Also, I've drawn in a Cyan trendline across the top swings of prices. I've adjusted some of the lines/levels/zones since the last posting of my "map". Hope it's helpful to both ES and equity traders!
Click image for original size
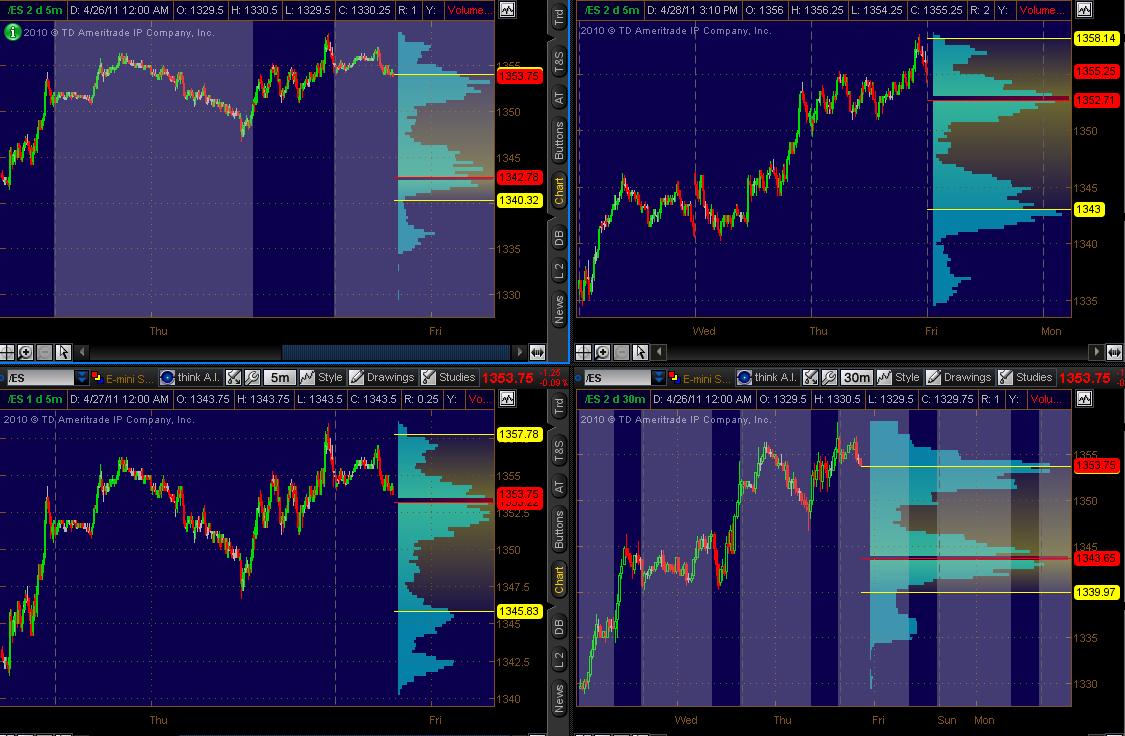
Here's what I've got for Volume Profile :
Top Left: 5min chart of 2 days data ATH
Top Right: 5min chart of 2 days data RTH
Bottom Left: 5min chart of 1 days data ATH
Bottom Right: 30min chart of 2 days data ATH
Top Left: 5min chart of 2 days data ATH
Top Right: 5min chart of 2 days data RTH
Bottom Left: 5min chart of 1 days data ATH
Bottom Right: 30min chart of 2 days data ATH
Click image for original size
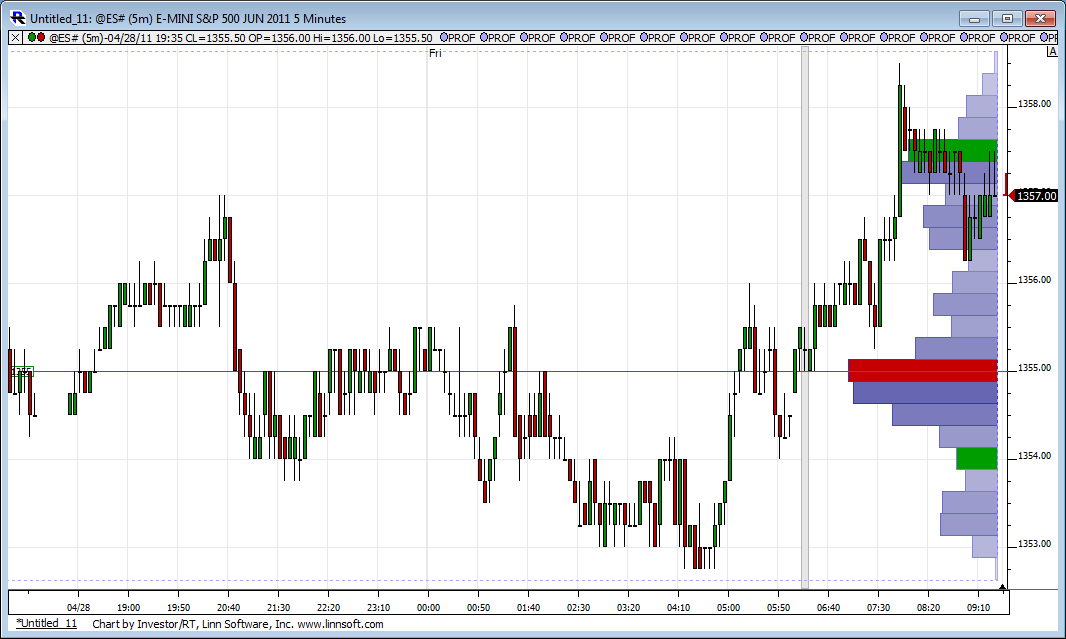
This ain't nothing but a big ole bell curve still with the 58 area being the distribution high and 47 area being the low.....and that 52.50 as the center..that is if you look at all session data.
If you look at the day session only then we have 3 HH and higher lows so we are trending......I like to sell on higher opens on the fourth day.....so a gap up in day session above yesterdays highs will have me put my sell glasses on. Either way I have a short bias.
prefering to get trades on at the extremes, I want to be selling up near the 58 area and preferably higher . eventually targeting the middle ( the 52.50)
The only good volume spike from yesterday happened at the 1357 number so if I had to pick an upper zone to watch it would need to be 1357 - 1358.50...any fades above there need to watch that area when/IF we come back down
Just want to say thank you for all that contribute here. I am learning alot. Wish I could contribute some myself but find you all to be much more advanced in your trading than I. Nonetheless thank you. It is appreciated.
should be interesting.
thanks for your comments, Bruce,
once, sometime in the last couple years, gap guy said after 3 consecutive higher Lows, UP gap fills 85% of the time. Unfortunately, as I look through my notes I don't know whether he had any other filters in place or whether he said fills or "was profitable" by end of day.
I gotta wait as we have a double top with yD high and O/N high....so we need that to run out first....hopefully we won't miss the short ...reports coming!!
I have to add here, that the "3 higher lows" note (not dated, but I know very old) does not designate whether gap fill was measured vs 4:00pm close or 4:15 close.
Yesterday, 4:00 close was 56.50,
4:15 close was 55.25
today's open at 57.00 with a low print of 56.25 would satisfy a 4:00pm C fill.
Yesterday, 4:00 close was 56.50,
4:15 close was 55.25
today's open at 57.00 with a low print of 56.25 would satisfy a 4:00pm C fill.
Paul, "mypivots" shows close as 1355.00
http://www.mypivots.com/dailynotes/symbol/417/-1/e-mini-sp500-june-2011
http://www.mypivots.com/dailynotes/symbol/417/-1/e-mini-sp500-june-2011
LisaP,
that 55.00 is the "settlement price" that the CME produces for something, I don't really know, adjusted for ex-dividends???... adjusted for something. They probably have a definition at the CME site.
My reference to the 4:15pm "Close" is technically the "last trade" of the day (which I prefer to use after getting screwed one day waiting for a gap fill in which the settlement price was 1.25 points lower than the last trade. At the time, I had been using the settlement price in stead of the last trade. (I didn't really think there was a difference in terms of importance, and maybe there isn't) But, on that day price came down, took out the "last trade" price by one tick (thus remaining ABOVE the settlement price by 1 pt) and market turned on a dime and took my profits with it.
On that
I have 55.50 as the close...once again we see Trade above YD highs and CD is no where even close to that when we open....chart later...failure above the O/N range....blah, blah , blah...same old stuff different day
57 - 57.50 is where bears need to hold the line back now
57 - 57.50 is where bears need to hold the line back now
wow, now that is what I call dumb luck as an exit...!! I guess they like that 57.50 !!
Emini Day Trading /
Daily Notes /
Forecast /
Economic Events /
Search /
Terms and Conditions /
Disclaimer /
Books /
Online Books /
Site Map /
Contact /
Privacy Policy /
Links /
About /
Day Trading Forum /
Investment Calculators /
Pivot Point Calculator /
Market Profile Generator /
Fibonacci Calculator /
Mailing List /
Advertise Here /
Articles /
Financial Terms /
Brokers /
Software /
Holidays /
Stock Split Calendar /
Mortgage Calculator /
Donate
Copyright © 2004-2023, MyPivots. All rights reserved.
Copyright © 2004-2023, MyPivots. All rights reserved.