JI
jimkane
Rep: 3,058
Posts: 33,089
I have to start the topic again? C'mon, let's get some volunteers in here. Okay, Sunday night showtime, let's roll.
TX
tx_ches
Rep: -10
Posts: 514
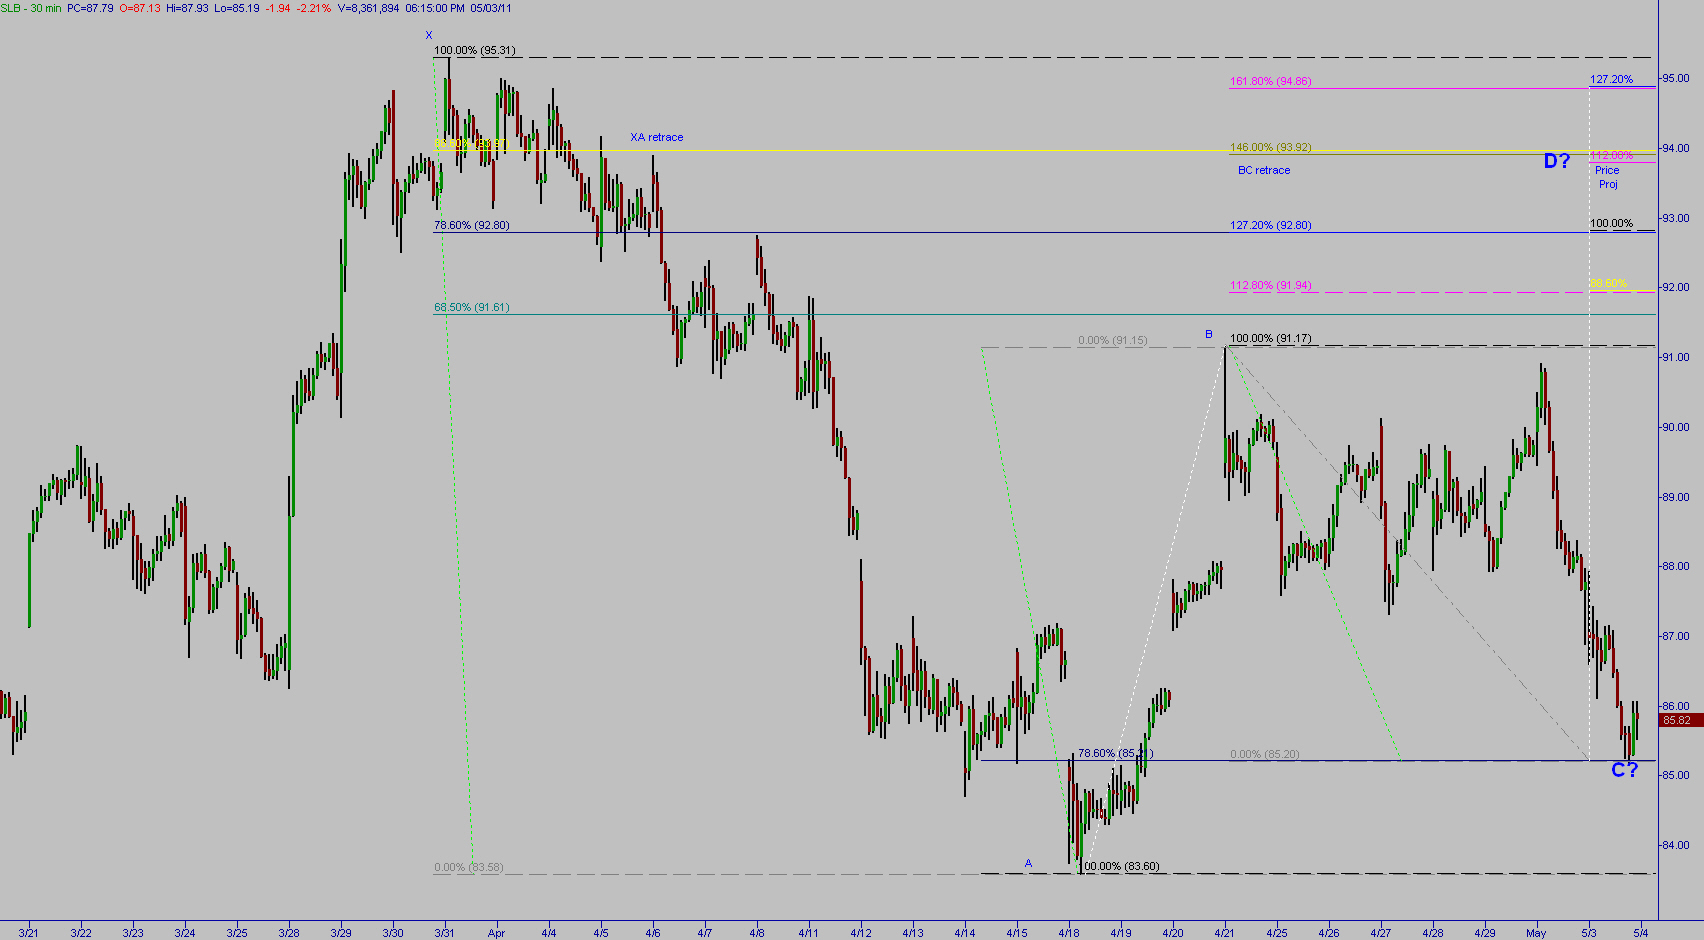
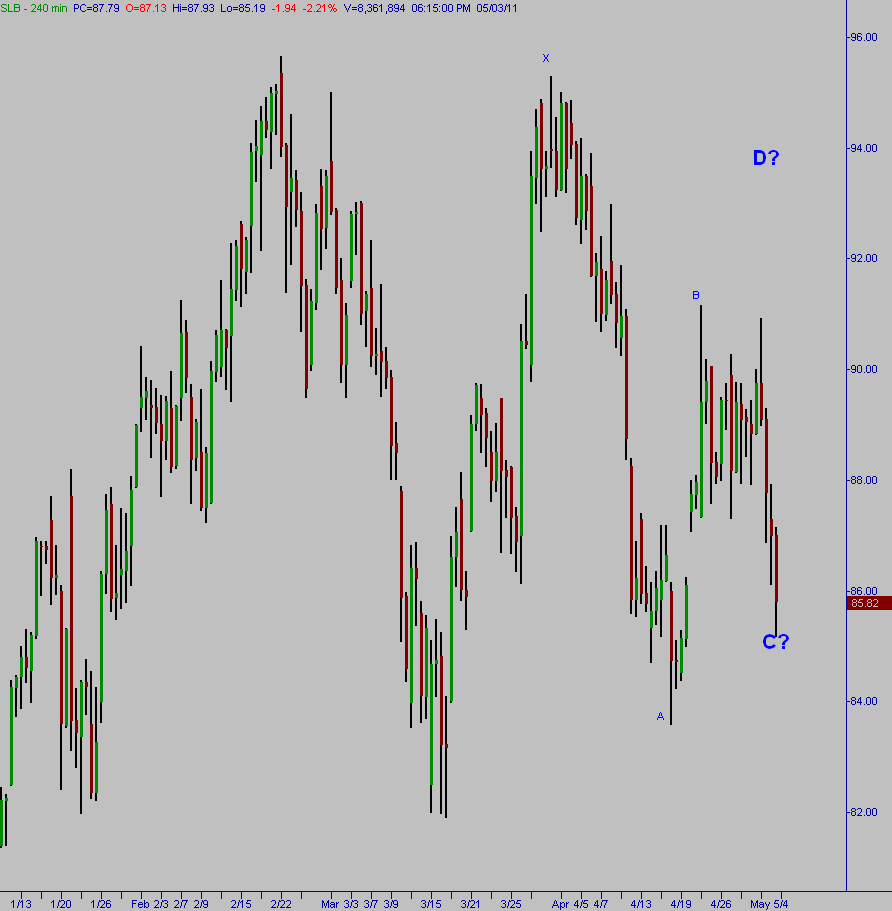
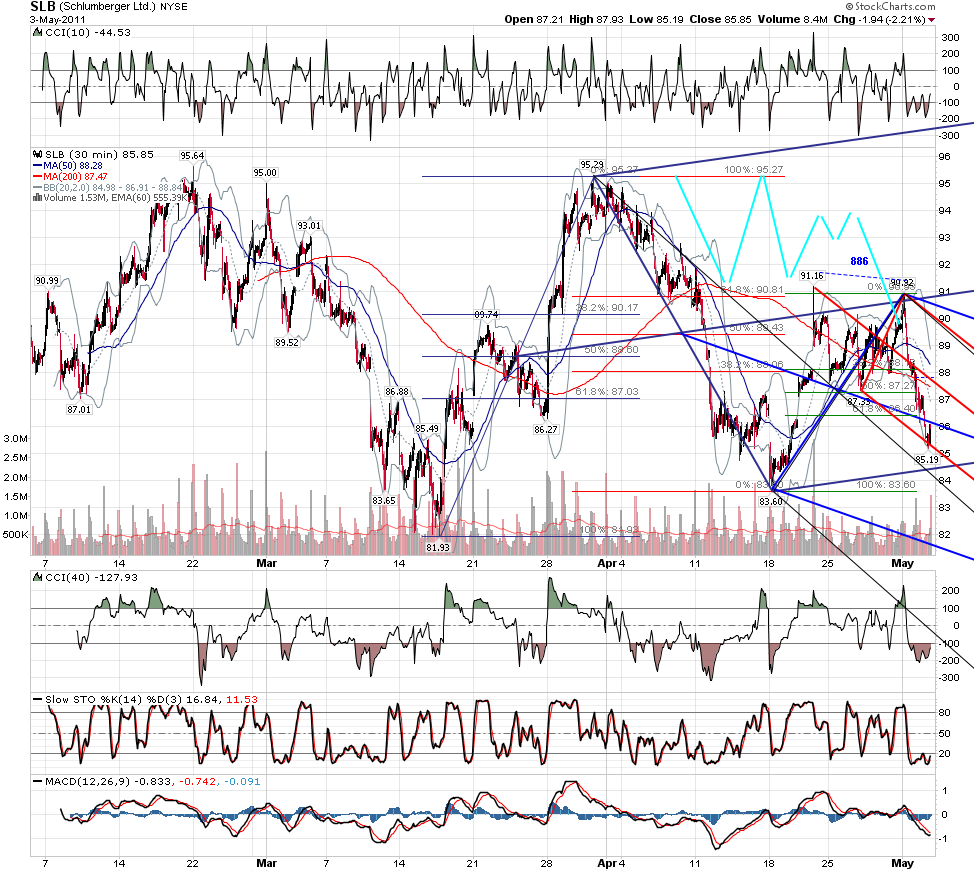
SLB 30 min with possible 5 pt pattern. Pretty ugly chart.
Show SLB 240 min to put it in context.
rat89, let me know if you are seeing something different.
Show SLB 240 min to put it in context.
rat89, let me know if you are seeing something different.
Click image for original size
Click image for original size
JI
jimkane
Rep: 3,058
Posts: 33,089
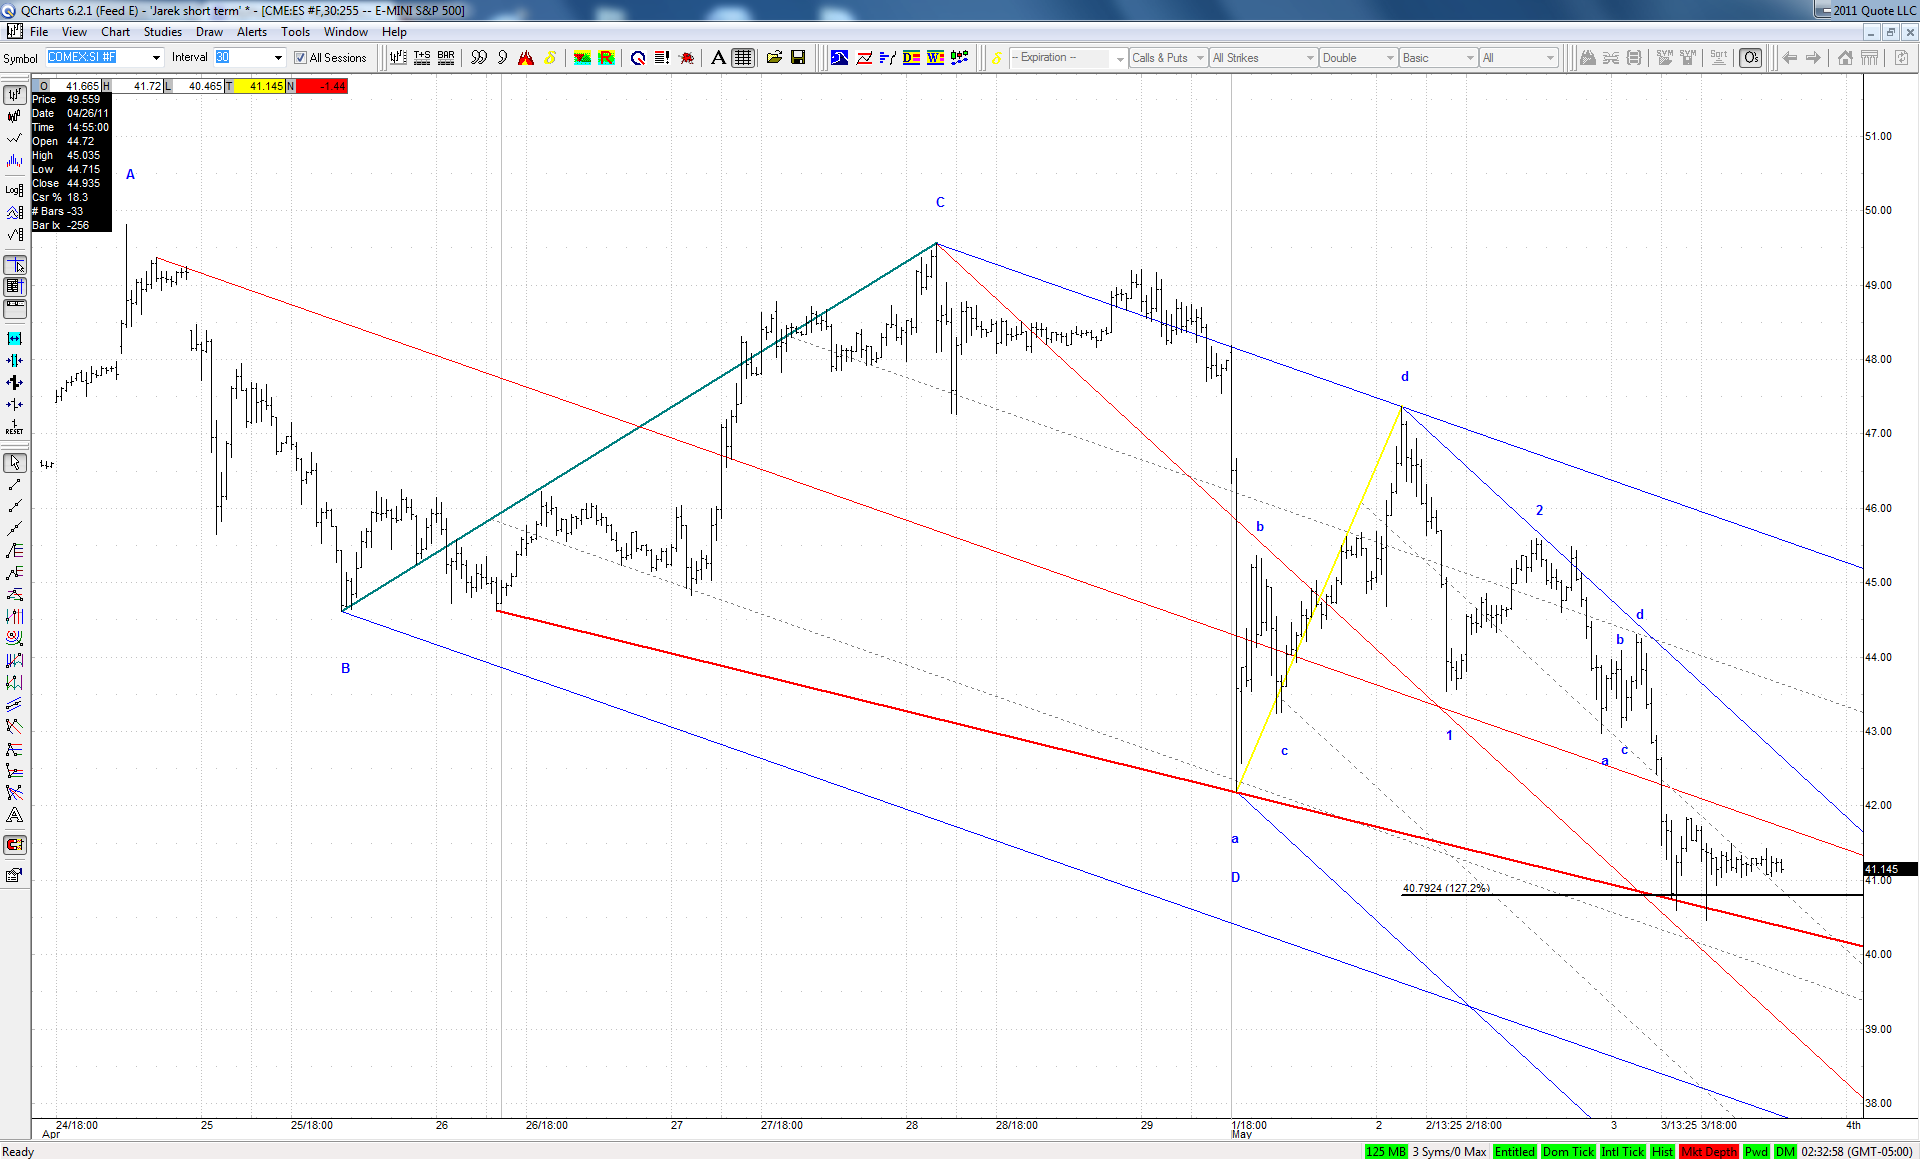
Brutal 'mini crash' in silver. It's not really a crash, the selling took like ten minutes, but these big moves, this time like a full dollar, and almost a dollar and a half from the previous high, and then it makes it right back, they are brutal when you are on the other side of the market. Short-term there is no way I can ride that out (intermediate term I could), but then it snaps right back. If I have some cushion i.e. some profits built in, this takes it all back, stops me out, then it goes right back up.
Hmmmm, let me see. It shakes me out of a long position that was profitable, leaves me without a position and then it goes up. Sounds like exactly what they are trying to do to all the 'weak' hands. And with swings like that, all short-term players are 'weak' hands or maniacs trading without stops on an instrument that moves $5,000 per $1 move in silver. Oh, well, that's trading...
So, one has the option to try to re-establish a position, and hope they don't do it gain. Notice gold shook a little, but nothing that couldn't be technically riden out with ease.
Just some thoughts...
TX
tx_ches
Rep: -10
Posts: 514
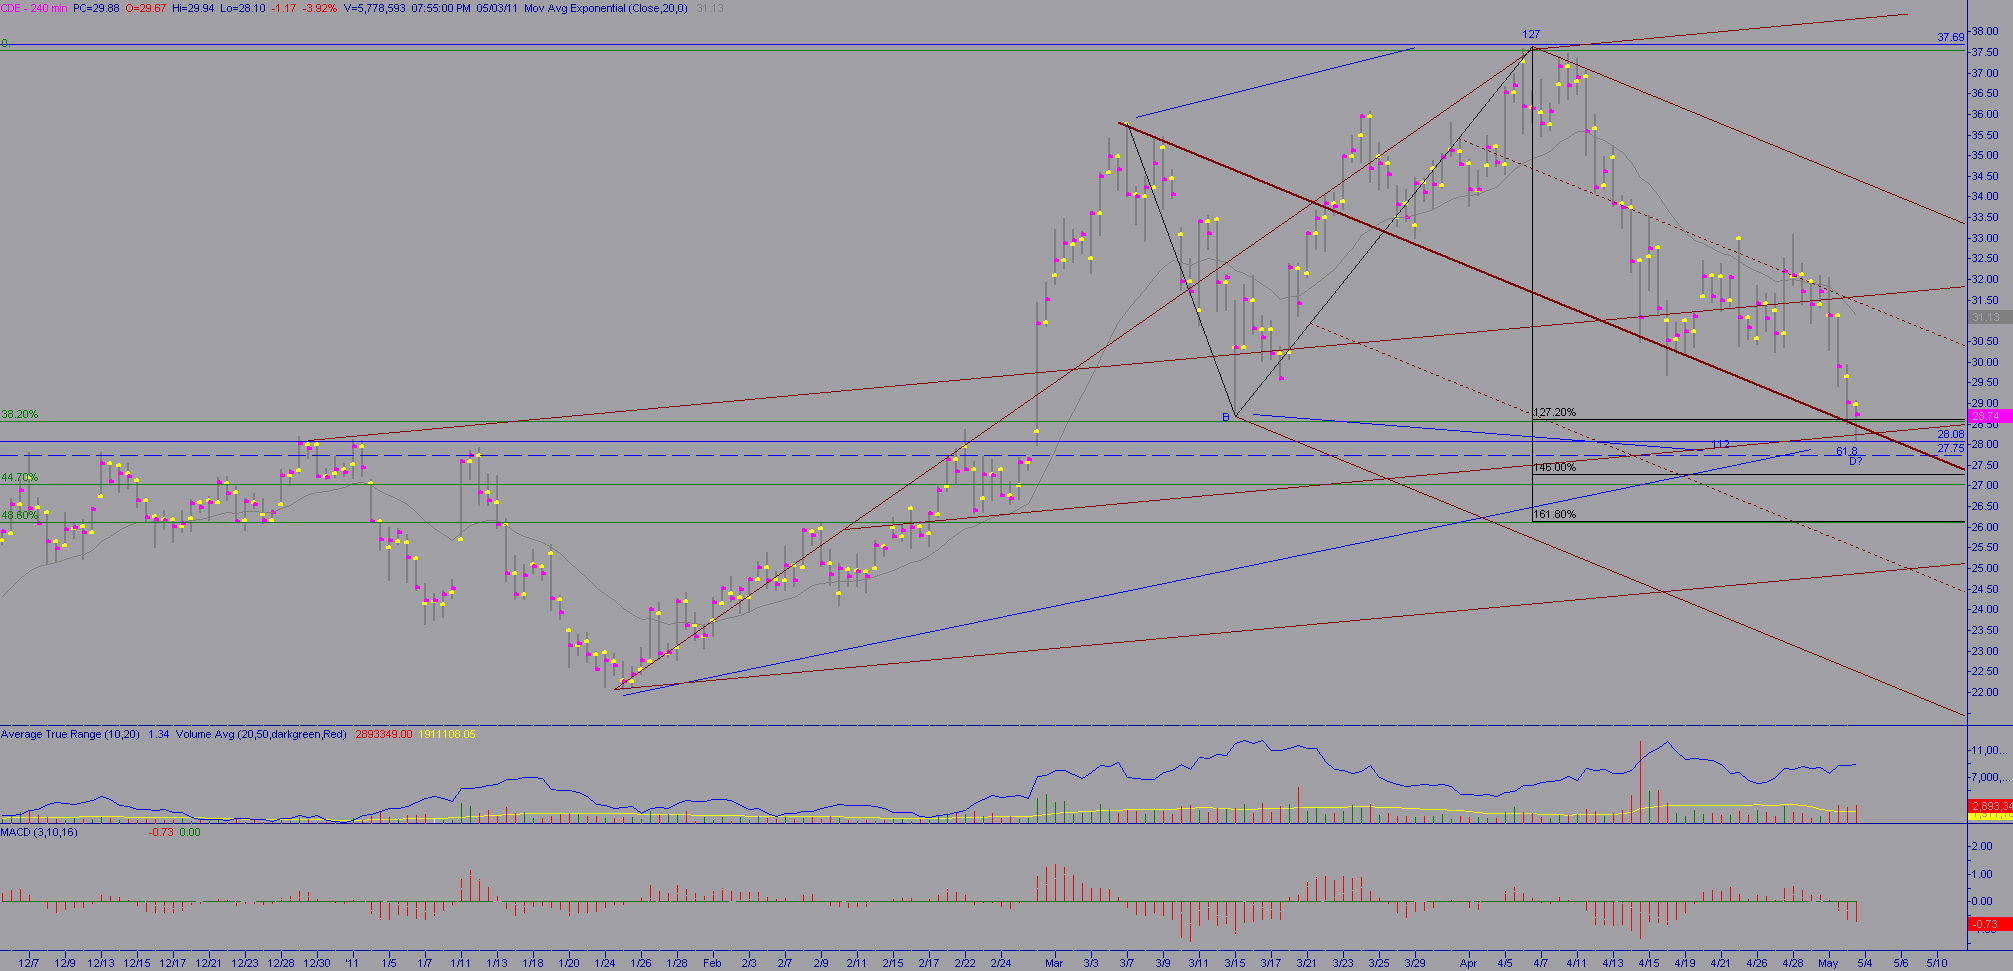
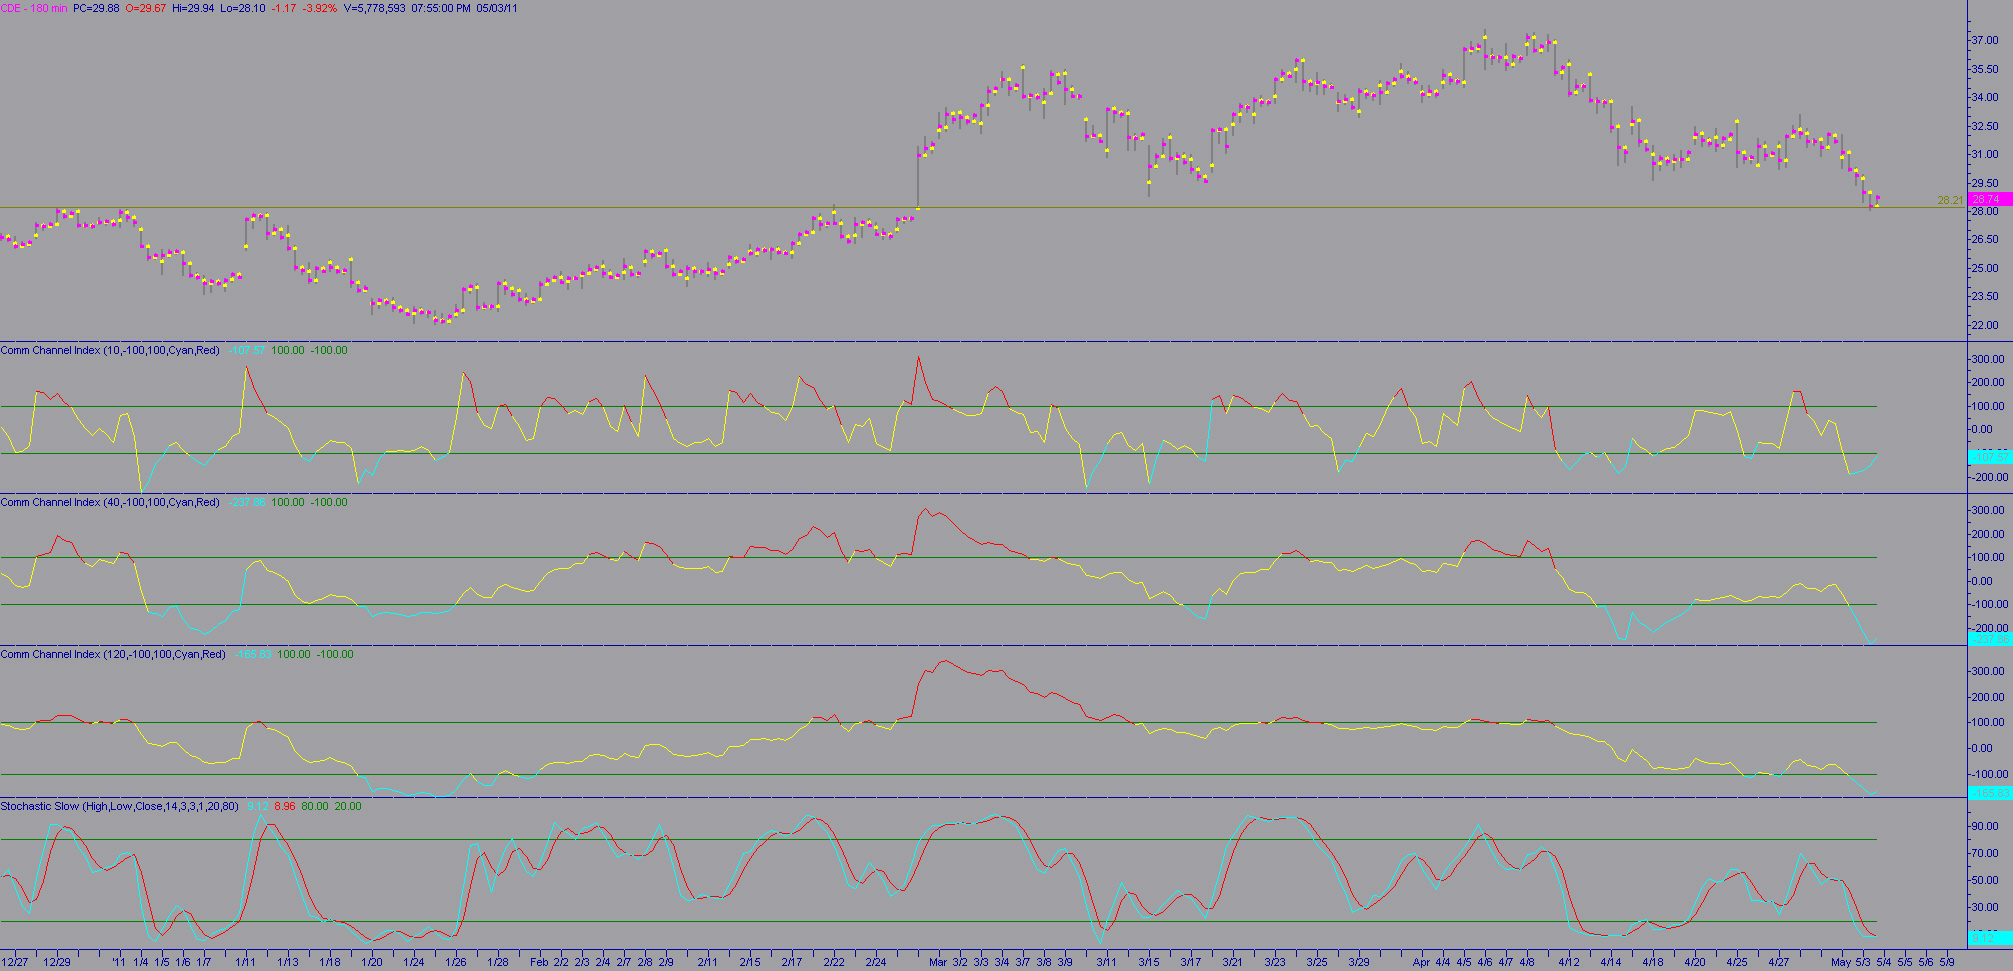
CDE (Silver Mining) closed at a key area today.
240 minute chart followed by 180 minute chart with indicators.
240 minute chart followed by 180 minute chart with indicators.
Click image for original size
Click image for original size
TX
tx_ches
Rep: -10
Posts: 514
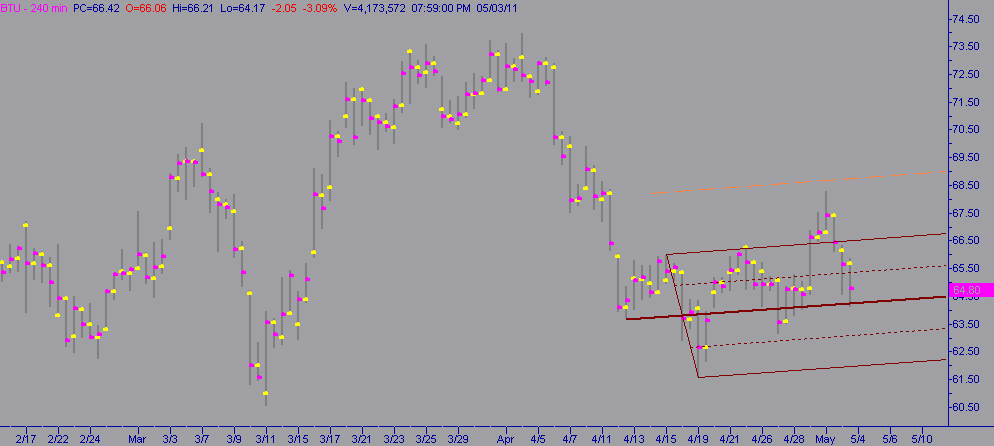
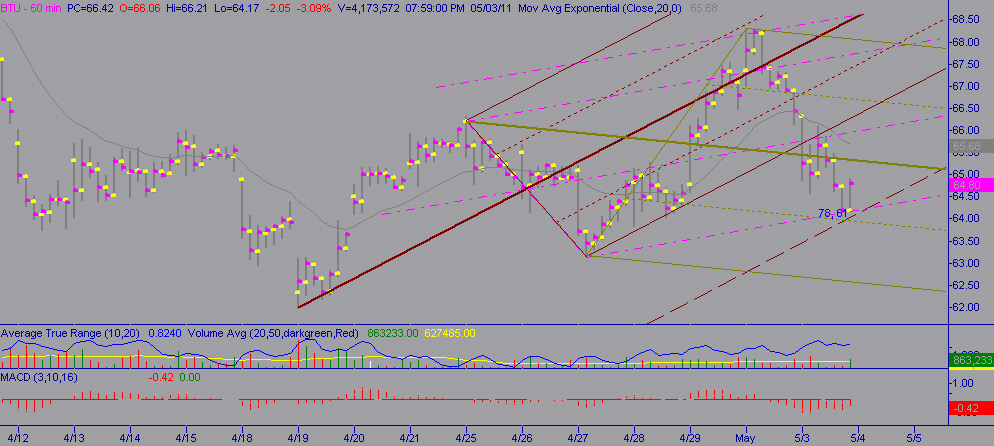
BTU is starting to look bullish.
240 min and 60 min.
240 min and 60 min.
Click image for original size
Click image for original size
RA
rat89
Rep: 0
Posts: 7,015
yes, pretty ugly indeed....something else is brewing. I was looking to see if we would get a turn around 85.98 for a c in a possible kane pattern with a d that would then land up at the area I was mentioning earlier, where xa 95.29 - 83.60 = 1.46 @ 100.67 and bc 91.16 - ~85.98 = 2.618 at 99.54 - for a powerful short. that's out....
what I see now is that there was a bearish abcd with an abcd in the cd leg ending at .618 and also the 942 at the schiff median line before it tanked. that alone now makes me look to a lower low than the 81.93 low, but I'm keeping an open mind about a bounce off an 886 at the lower line at 84.46.
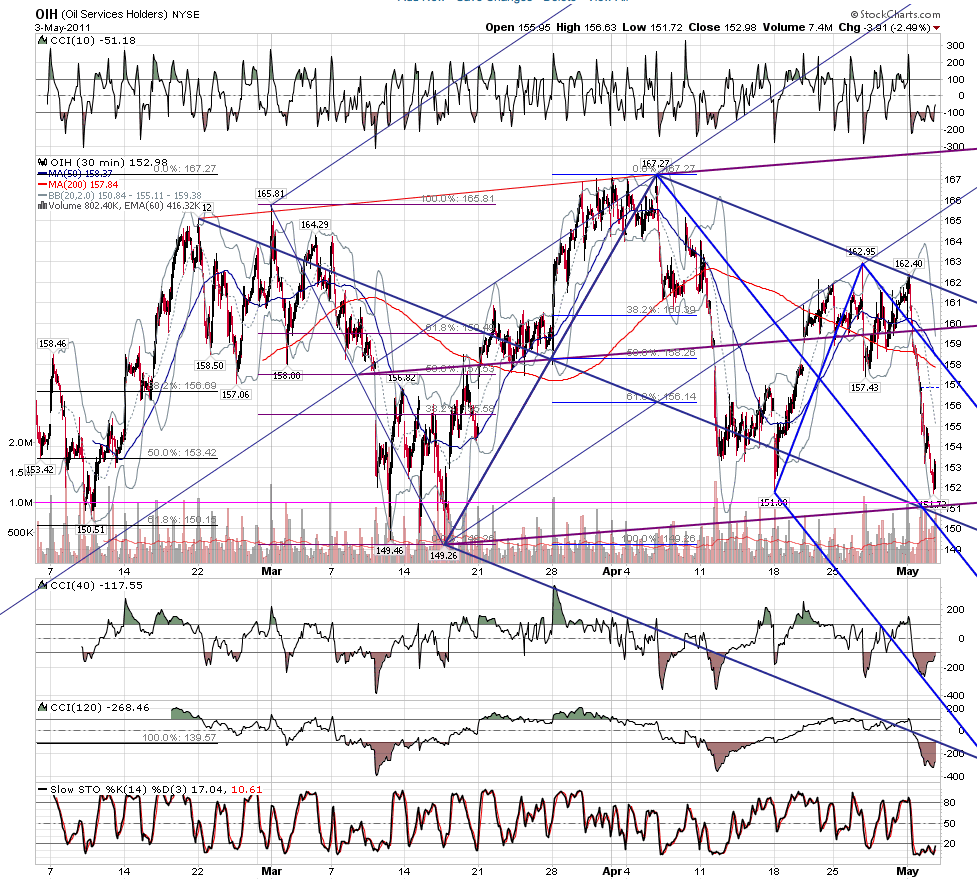
there's an interest area coming right up on oih too for context
Originally posted by tx_ches
SLB 30 min with possible 5 pt pattern. Pretty ugly chart.
Show SLB 240 min to put it in context.
rat89, let me know if you are seeing something different.
Click image for original size
Click image for original size
RA
rat89
Rep: 0
Posts: 7,015
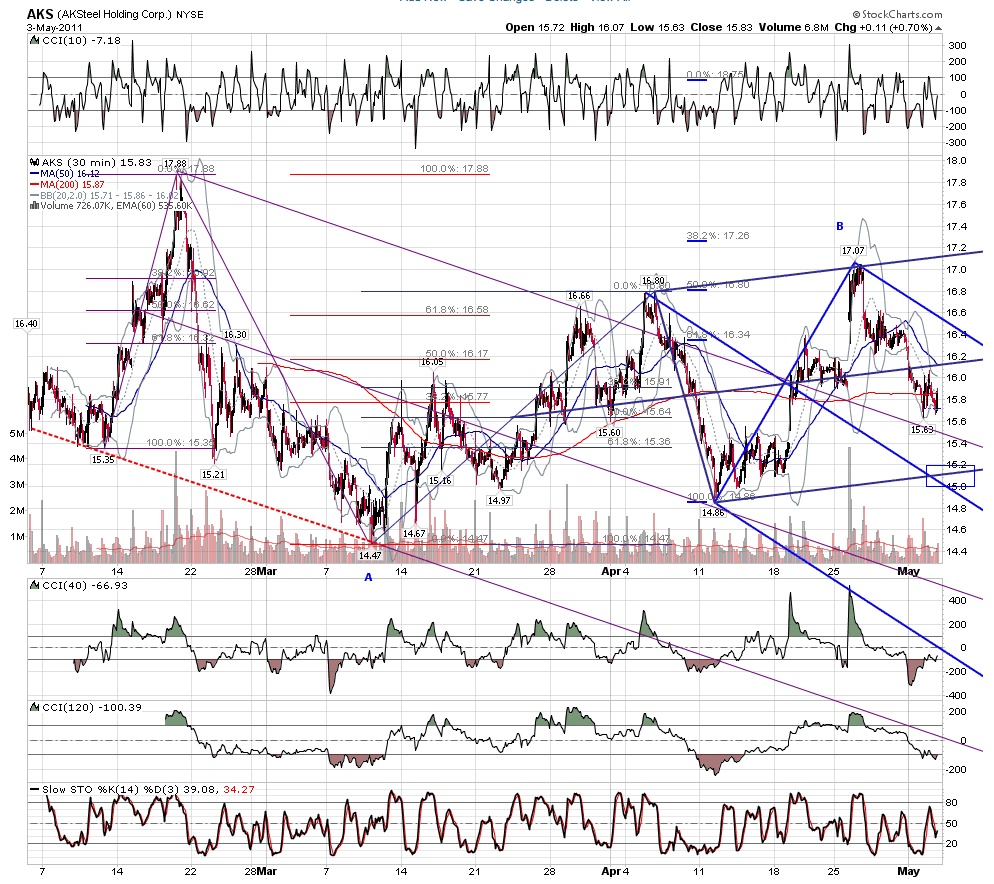
here's one with a potential to make a C in a 5pt.....17.07 was all the way up at the .768.....there is a tight range of interest from 15.20 to 15.01 in any case....
Click image for original size
JA
jarek
Rep: 94
Posts: 3,474
Originally posted by jarek
W2 KZ 4PT in the making?
This obviously was not W2, but this downtrend still looks good for bears:
Click image for original size