JI
jimkane
Rep: 3,058
Posts: 33,089
I have to start the topic again? C'mon, let's get some volunteers in here. Okay, Sunday night showtime, let's roll.
TX
tx_ches
Rep: -10
Posts: 514
It looks to my eyeballs that roofer wasn't quite as precise as you in putting on his upsloping set. So his intersection with up and down sets is slightly different than yours.
I don't create charts with stockcharts.com but I've noticed in Tradestation that you can get slightly different scaling if you use different window sizes and bar spacing (how scrunched together the bars are). Scaling will affect your lines and can be rather frustrating when trying to compare the same set on say 30 minute vs 5 minute. It looks like Roofer used 990*897 and you used 979*840 so that might also have affected the scaling. Qcharts that Jarek uses probably doesn't have this problem since it is probably better software.
Another thing I'll mention is that I sometimes notice a difference in price at pivot points. I don't know the datafeed that stockcharts uses. Many online charting sites use Bats. But I'll see a pivot on your chart or roofer's chart and have a very different value on my own Tradestation chart. I don't know whose is "right" but it sometimes does make a difference because roofer can get something aligned that doesn't align on my own chart. Also happens with Jarek charts on ES futures as compared to what I see on my own charts.
Another caution about tradestation and maybe all data feeds in general is that they are notorious for having different values for the exact same period but different timeframe. For example, the high price at 11:00 of a 5 minute will be different on the 30 minute or 60 minute. And don't even get me started on the daily closing price discrepancies.
Just something to be aware of in all this. Good thing Kane has trained us to look for areas and not specific price points! Though roofer uses such tight stops on the .886 gap trade that I suspect he does something different.
Originally posted by rat89
roofer....or anyone who knows...i'm baffled by something and troubled by it.....it's why our sets line up differently....why? i'm using non log....can't figure out what other settings might cause it...
RA
rat89
Rep: 0
Posts: 7,015
interesting tx.....I don't see those settings in stockcharts though you do get to pick a size, and that could have something to do with it, you never know....
JA
jarek
Rep: 94
Posts: 3,474
Originally posted by rat89
...anyone who knows...i'm baffled by something and troubled by it.....it's why our sets line up differently....why?
I've gone through similar pain some time ago The reason for the discrepancy is (as tx_ches pointed out already) that Geo's anchor points are not always equal to the exact high/low to the penny. I don't know StockCharts, but in my other software the difference between the two charts would be that of "Snap to" function turned on or off
TX
tx_ches
Rep: -10
Posts: 514
Jarek, I don't know Elliott waves or Kane waves. So sometimes I have a hard time following you on the counts.
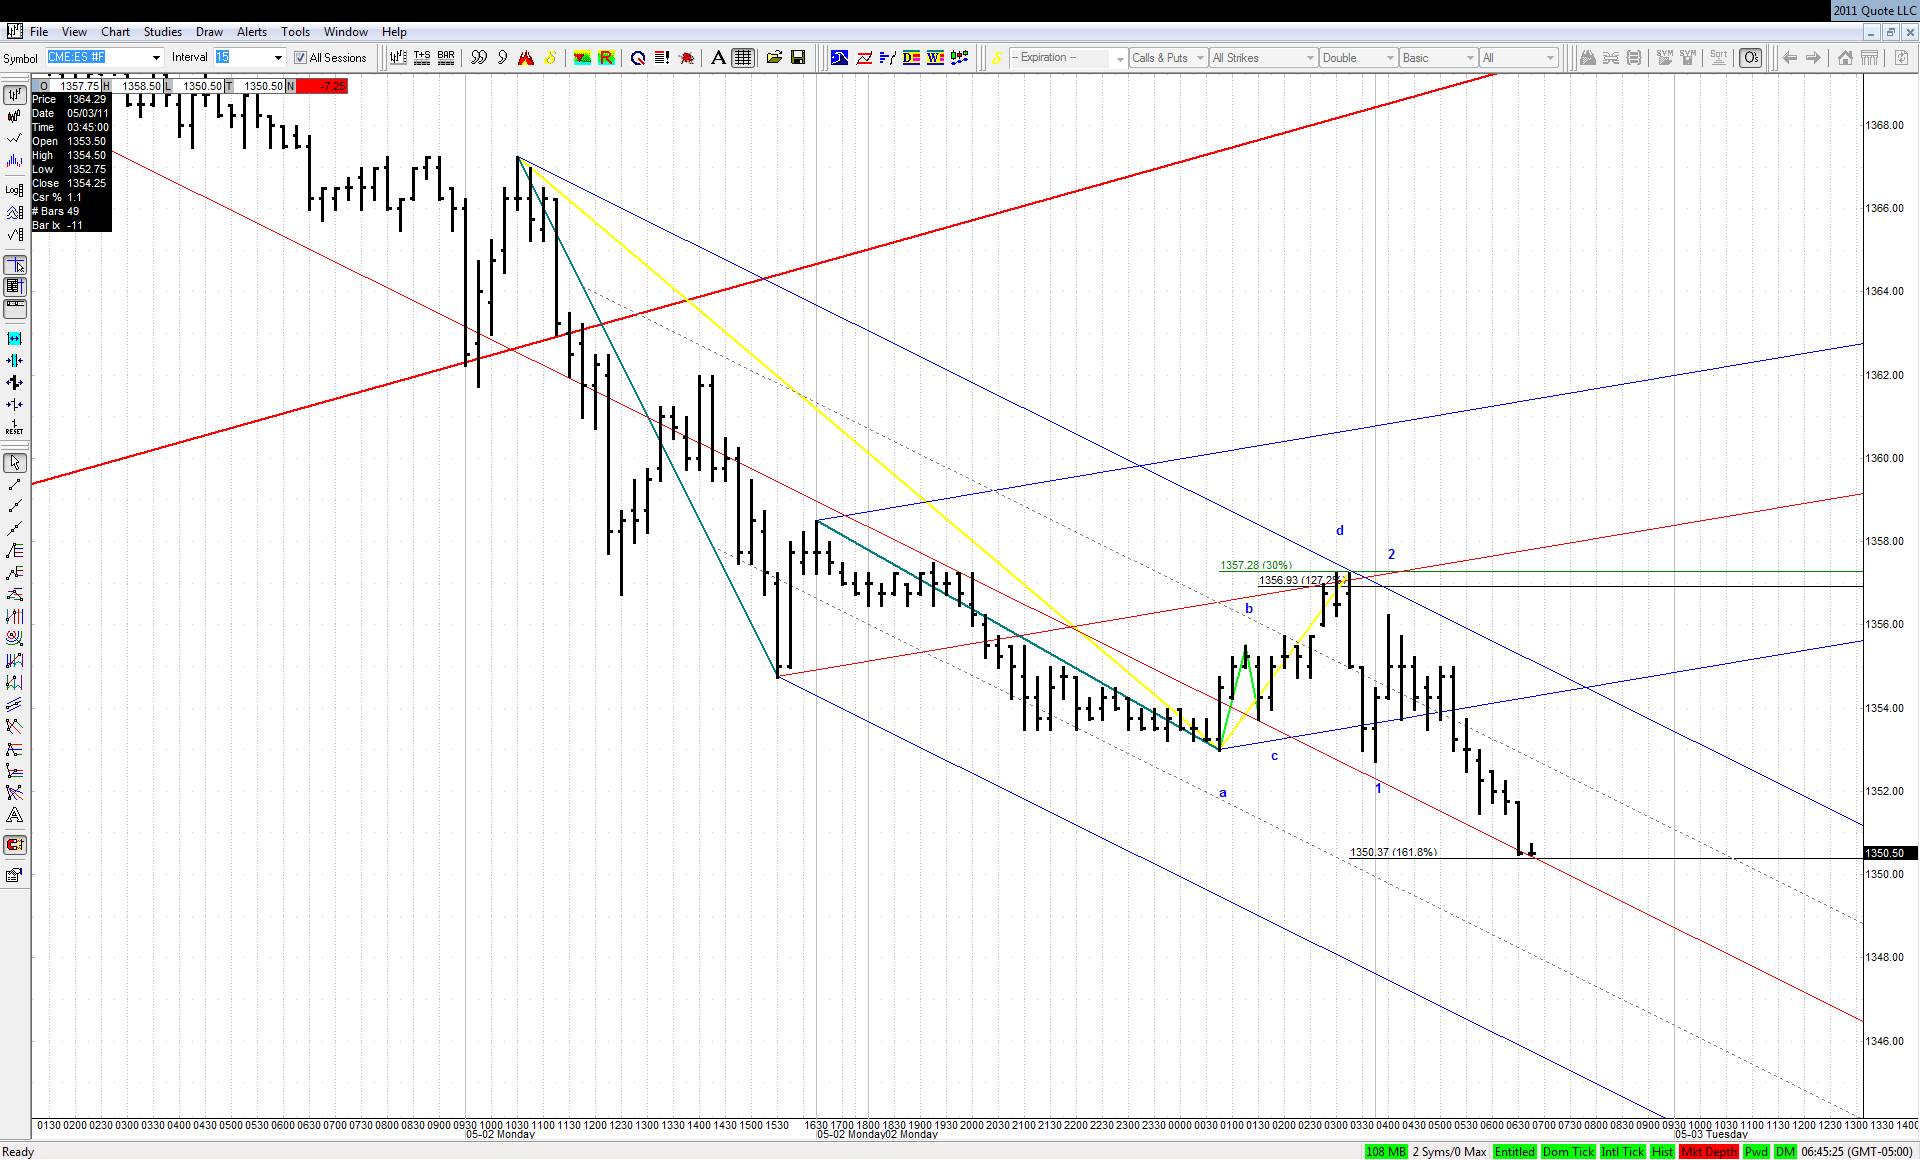
I was wondering how you get W4 out of this if you are showing
W1 and W2. What happened to W3?
I was wondering how you get W4 out of this if you are showing
W1 and W2. What happened to W3?
Originally posted by jarek
1.618 of our bearish ABCD reached. That should be it if this ABCD was a mere W4:
Click image for original size
JA
jarek
Rep: 94
Posts: 3,474
The reasoning here is that if Kane ABCD is Wave 4 of a bigger move, then the move off it (which obviously is Wave 5 of this bigger move) rarely exceeds 1.618 external retracement of such ABCD. If the bearish ABCD on the chart above was Wave 4 of the move down, then my W1 and W2 would be just subwaves of Wave 5. Hope it helps
TX
tx_ches
Rep: -10
Posts: 514
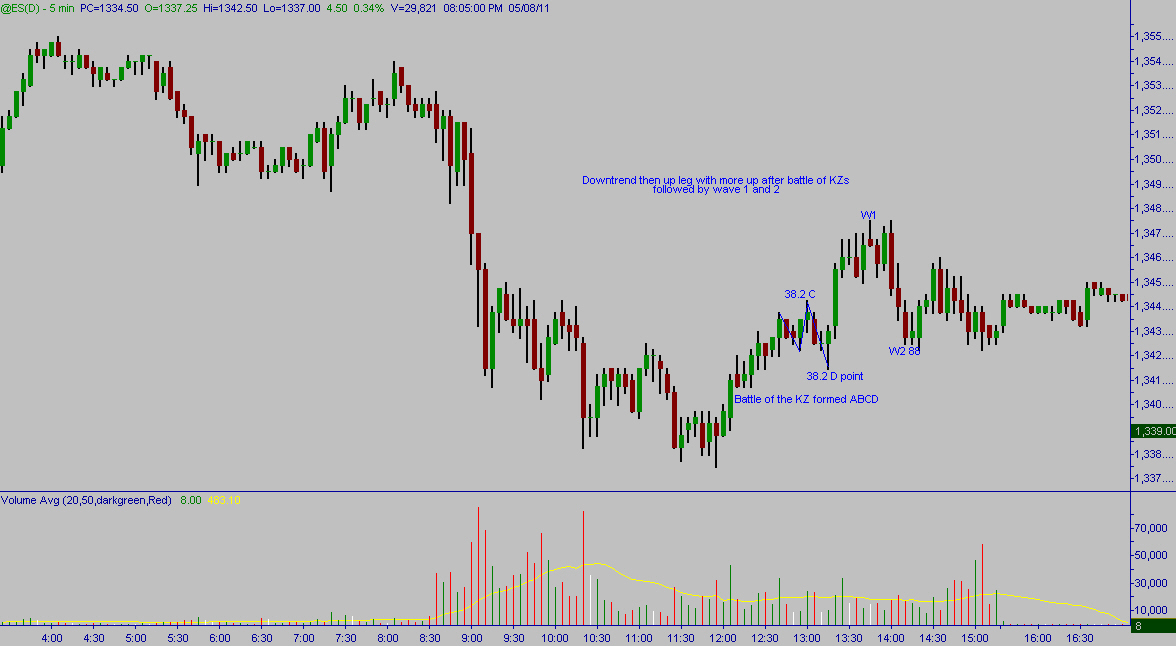
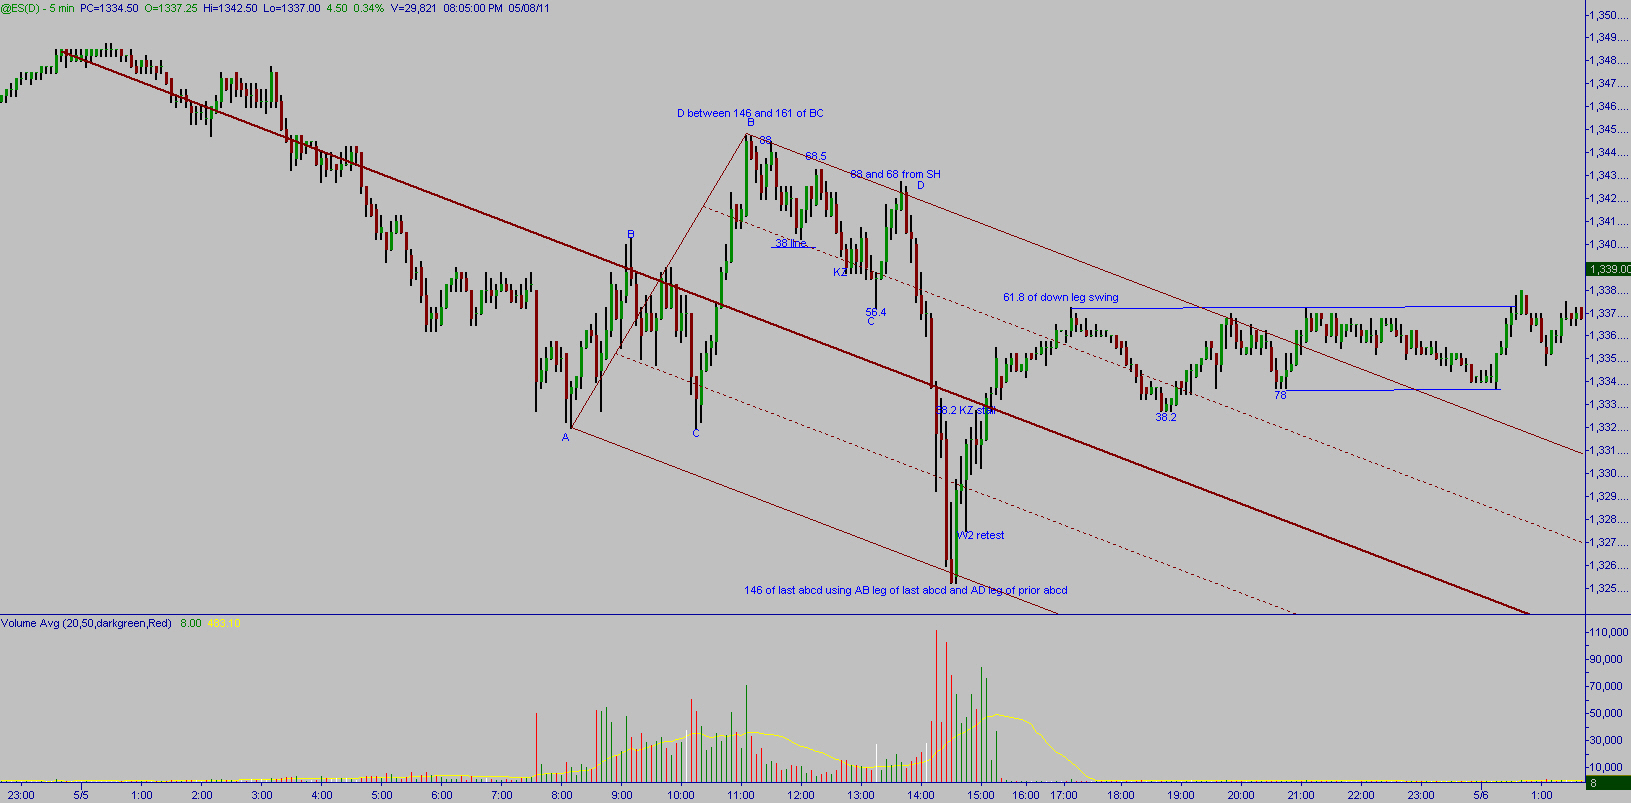
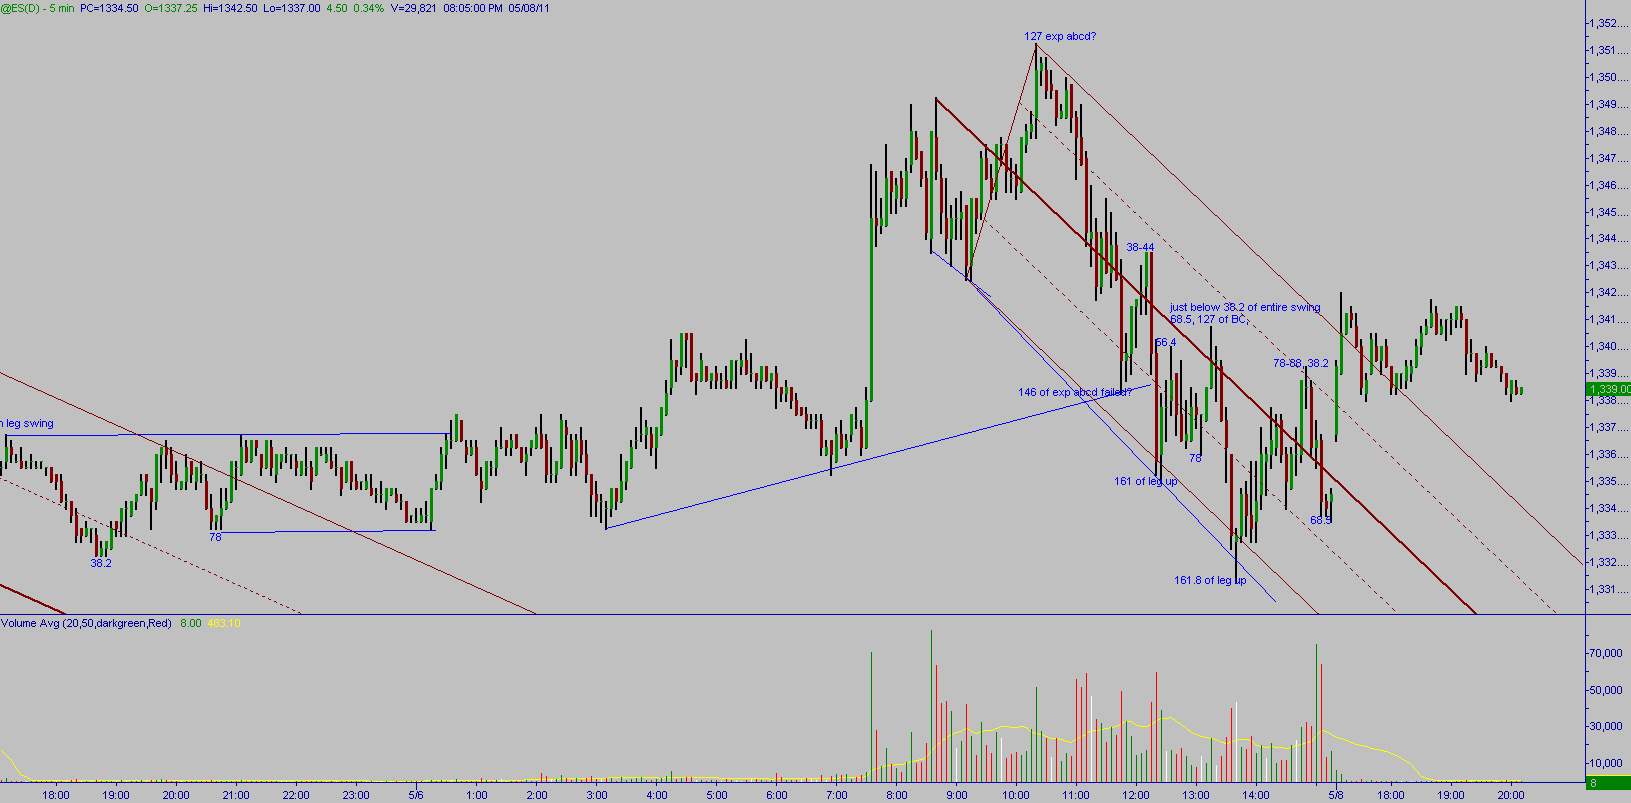
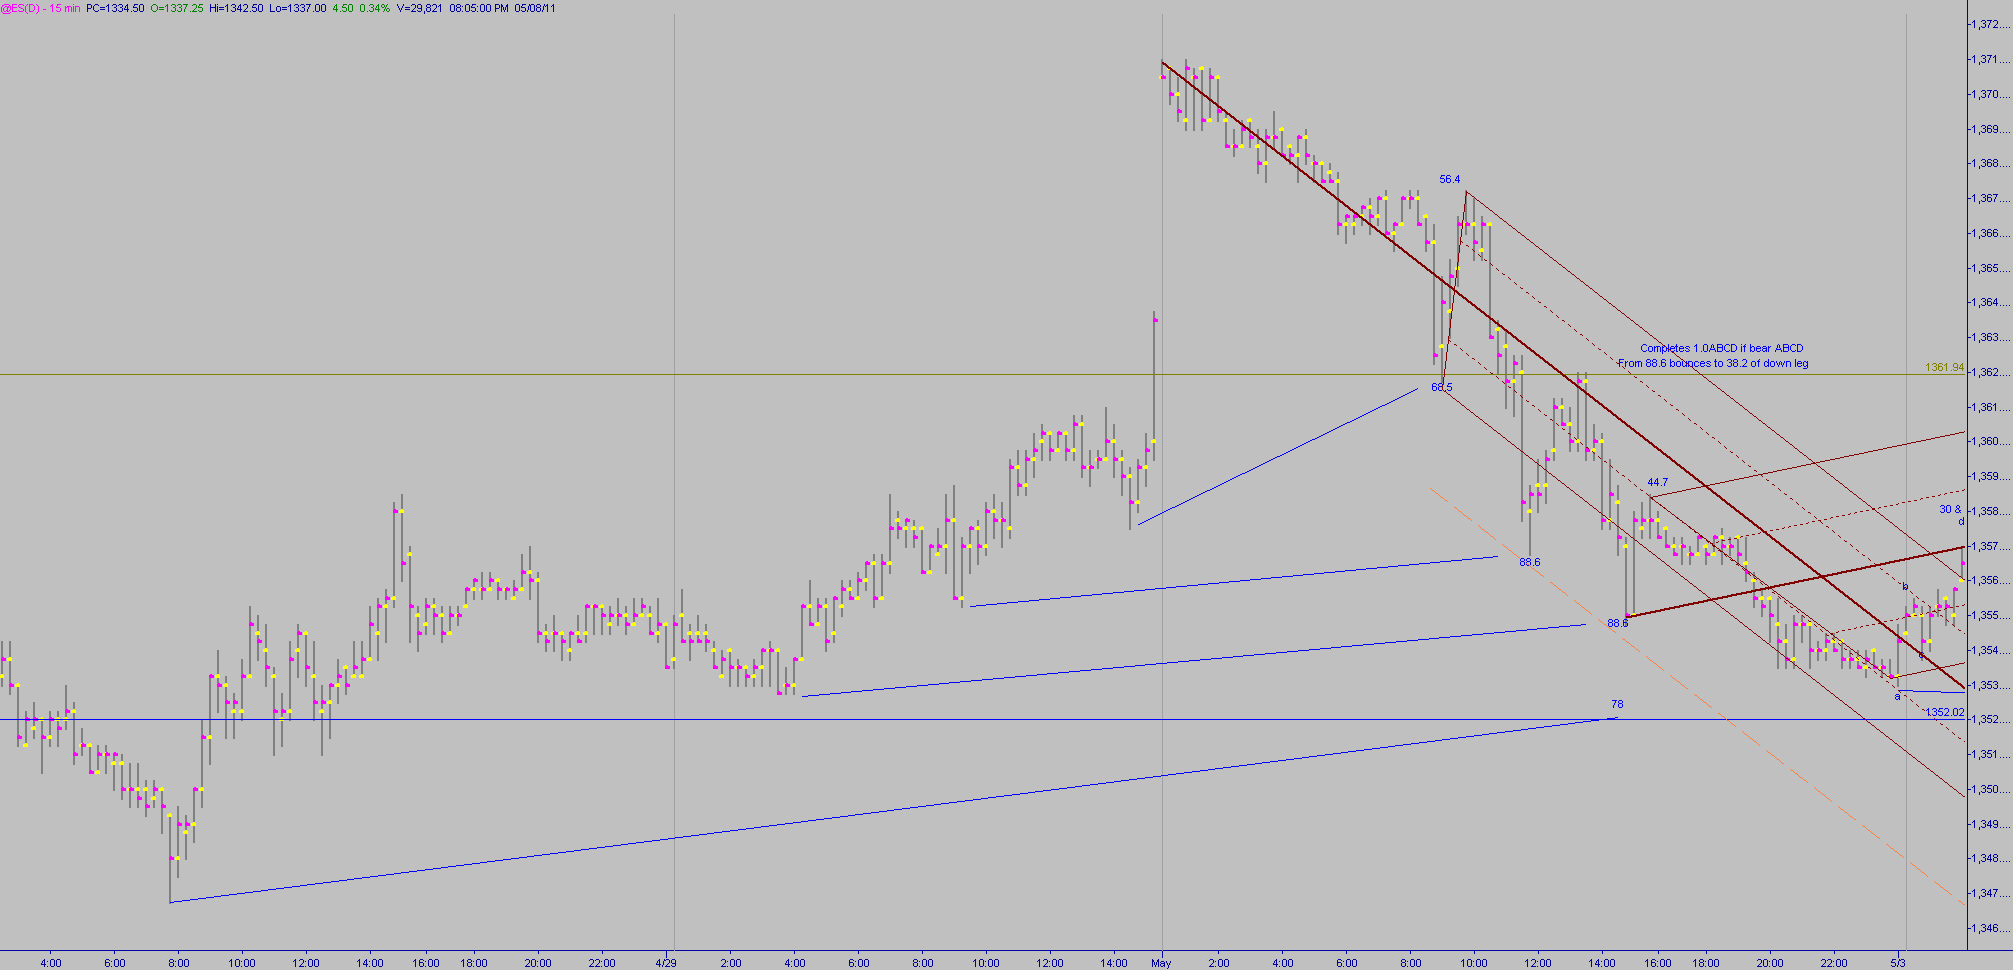
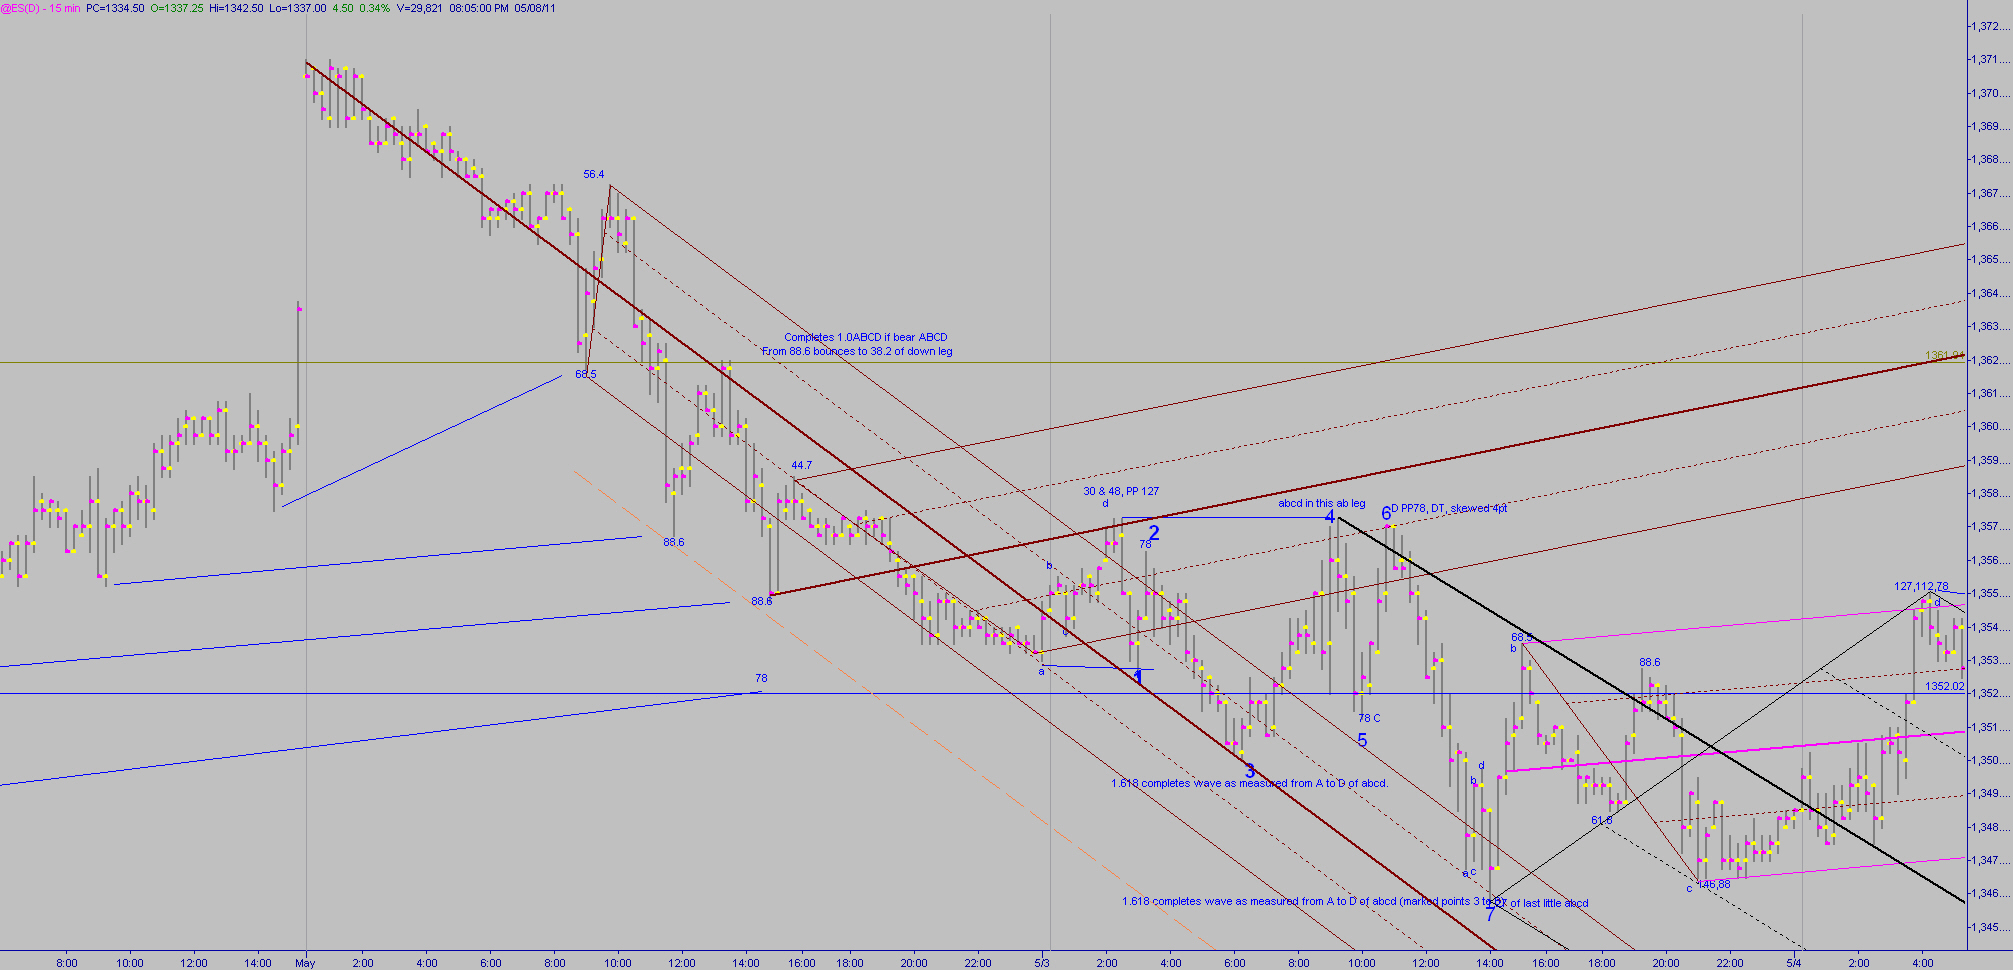
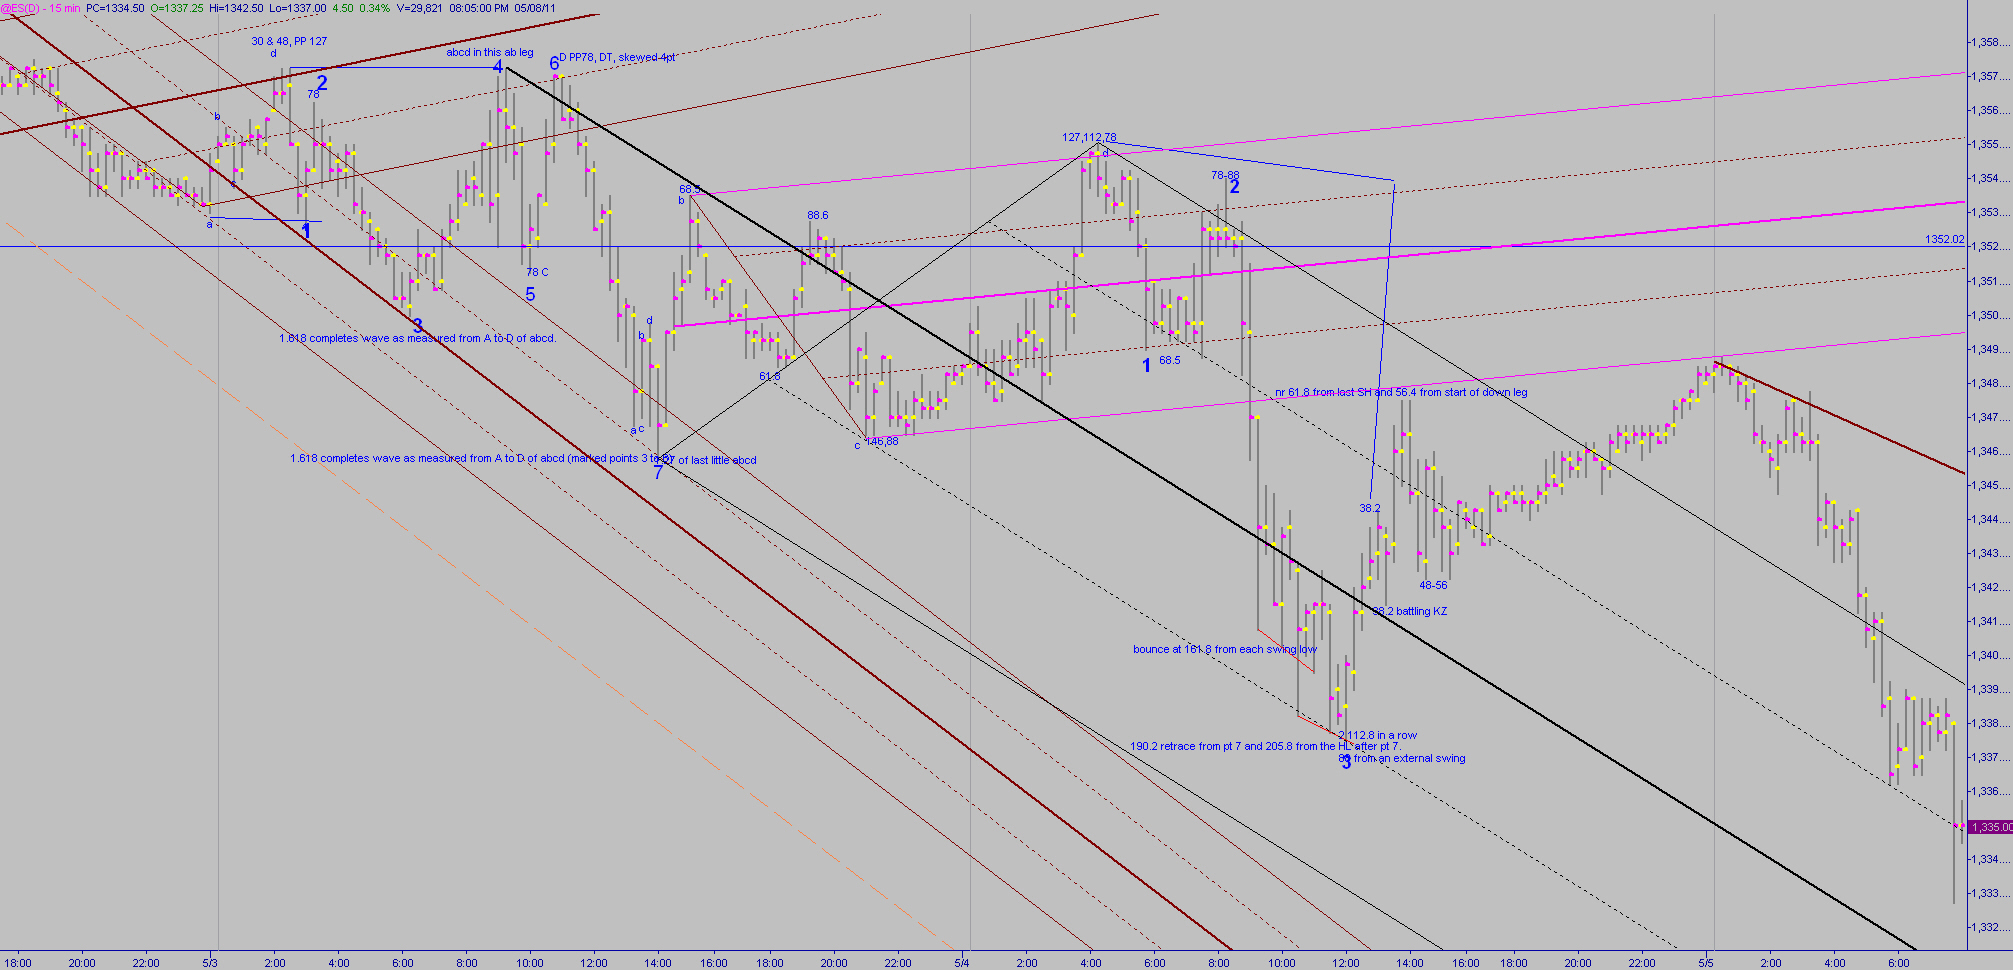
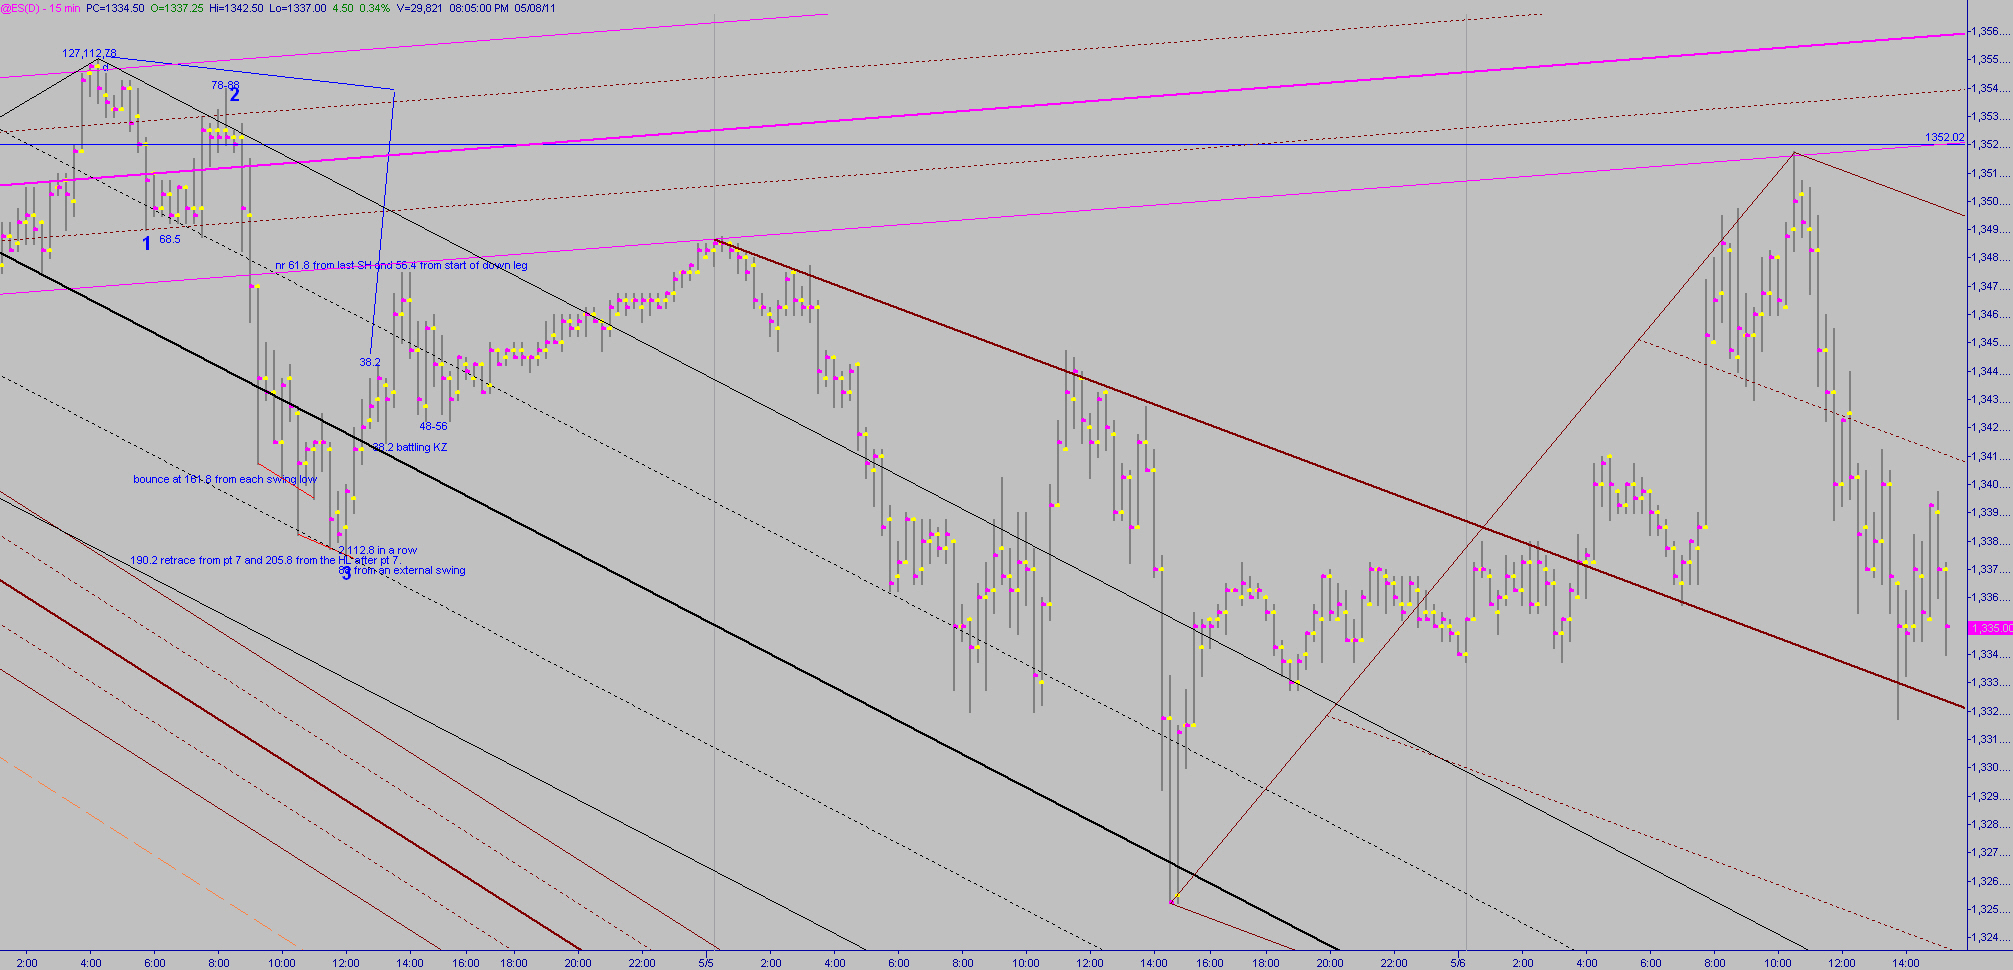
Follows is a recap of Jarek's work for the entire week on ES chart. The 1 and 2 numbers are his but all other numbers are mine and probably meaningless. I've made notes of what I think Jim was commenting upon.
The 15 minute charts overlap 2 days.
The 30 minute is used for 1 day.
The end of week is shown on 5 minute charts.
For educational purposes only and a chuckle. Maybe some awe at the market. It was a very interesting week.
Charts follow.
The 15 minute charts overlap 2 days.
The 30 minute is used for 1 day.
The end of week is shown on 5 minute charts.
For educational purposes only and a chuckle. Maybe some awe at the market. It was a very interesting week.
Charts follow.
TX
tx_ches
Rep: -10
Posts: 514
ES 15 minute for each day of week.
ES 5-2-11
ES 5-3-11
ES 5-4-11
ES 5-5 - see 5 minute for detail
ES 5-6
ES 5-2-11
Click image for original size
ES 5-3-11
Click image for original size
ES 5-4-11
Click image for original size
ES 5-5 - see 5 minute for detail
ES 5-6
Click image for original size
TX
tx_ches
Rep: -10
Posts: 514
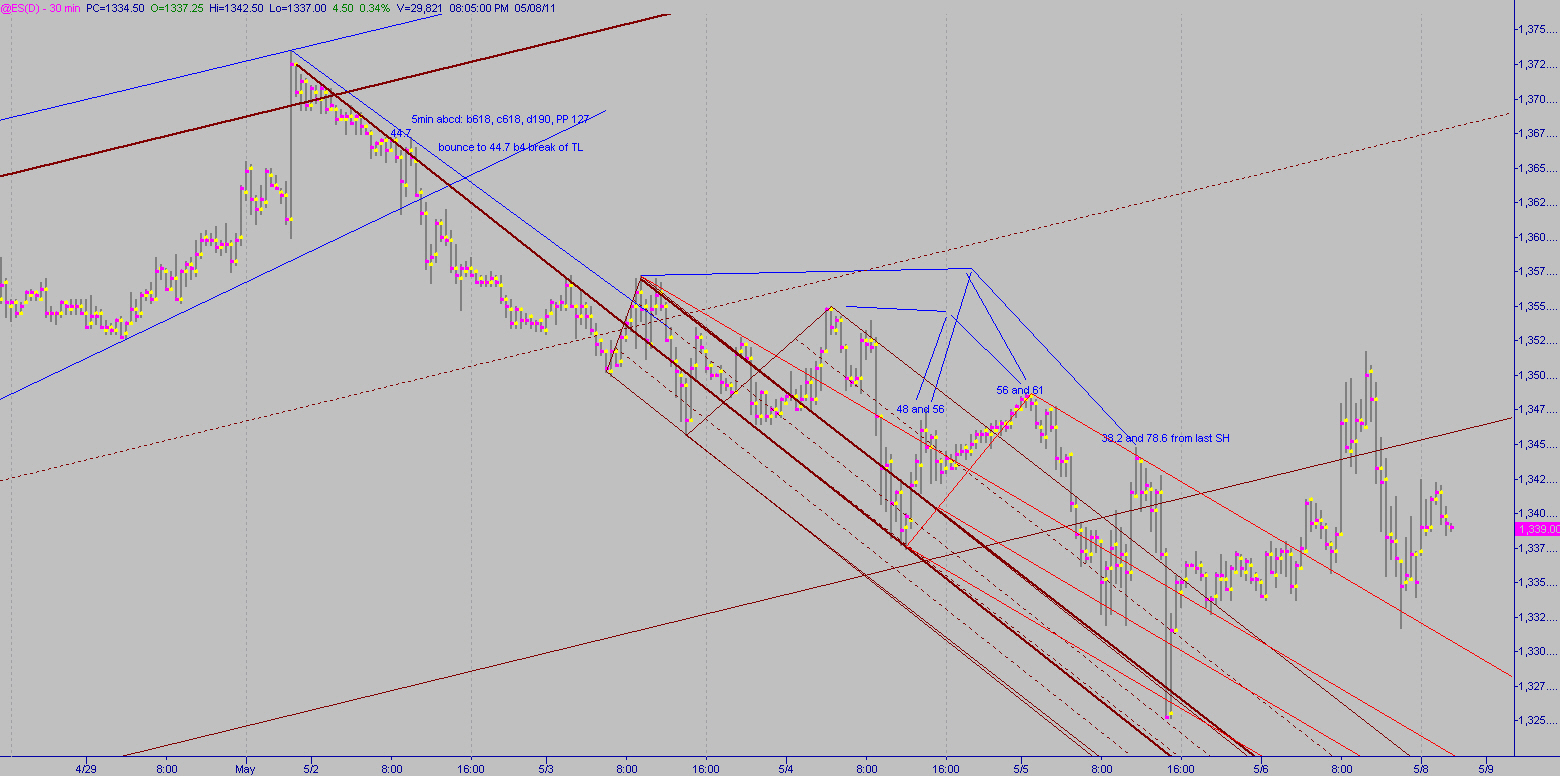
Some sets on the 30 minute did pretty well.
ES 30 minute
ES 30 minute
Click image for original size