ES S/R Monkey Map for 5-11-11
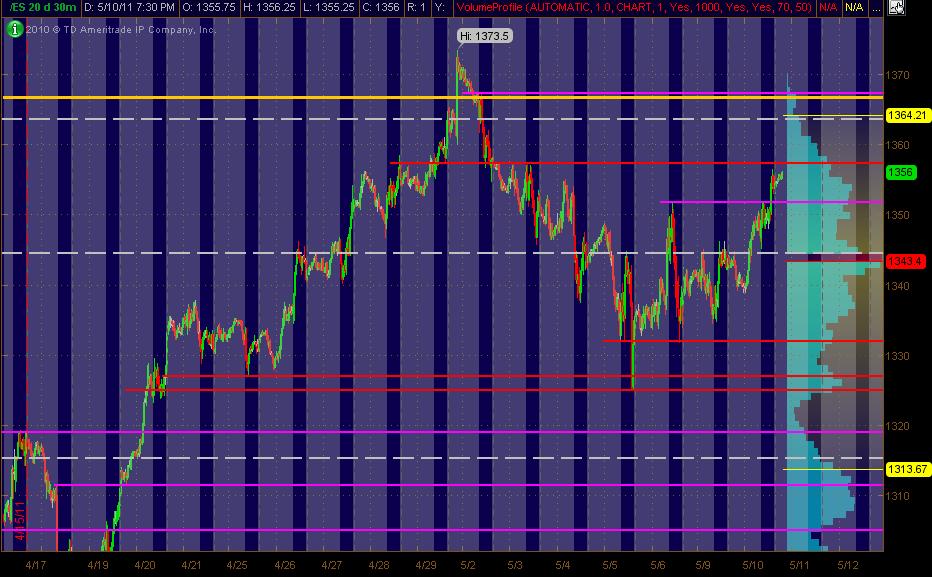
Here's my 30min MAP of 20 trading days that I've got with the Red lines as potential significant PASR levels with Magenta as semi-significant. The White dashed lines are Weekly Pivots. Got a Fib cluster above the current market in Yellow. The Gray background is "overnight trading" and the Light Blue bars on the right vertical axis represent Volume at Price. Hope this is helpful to some folks!
Click image for original size
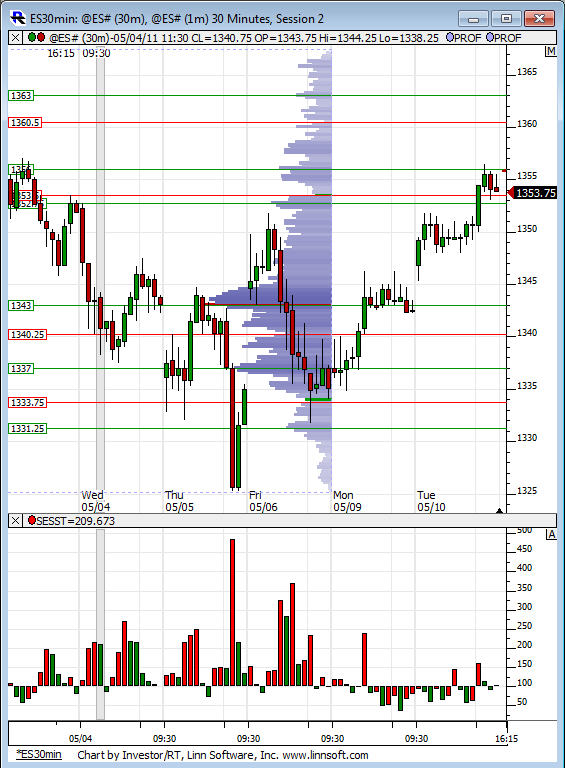
Very interesting to see price set against last weeks volume profile. Has used the high and low volume nodes as significant areas quite nicely. And of course the low volume nature of this rally off the lows is easily seen in the relative volume bars on the bottom.
Click image for original size
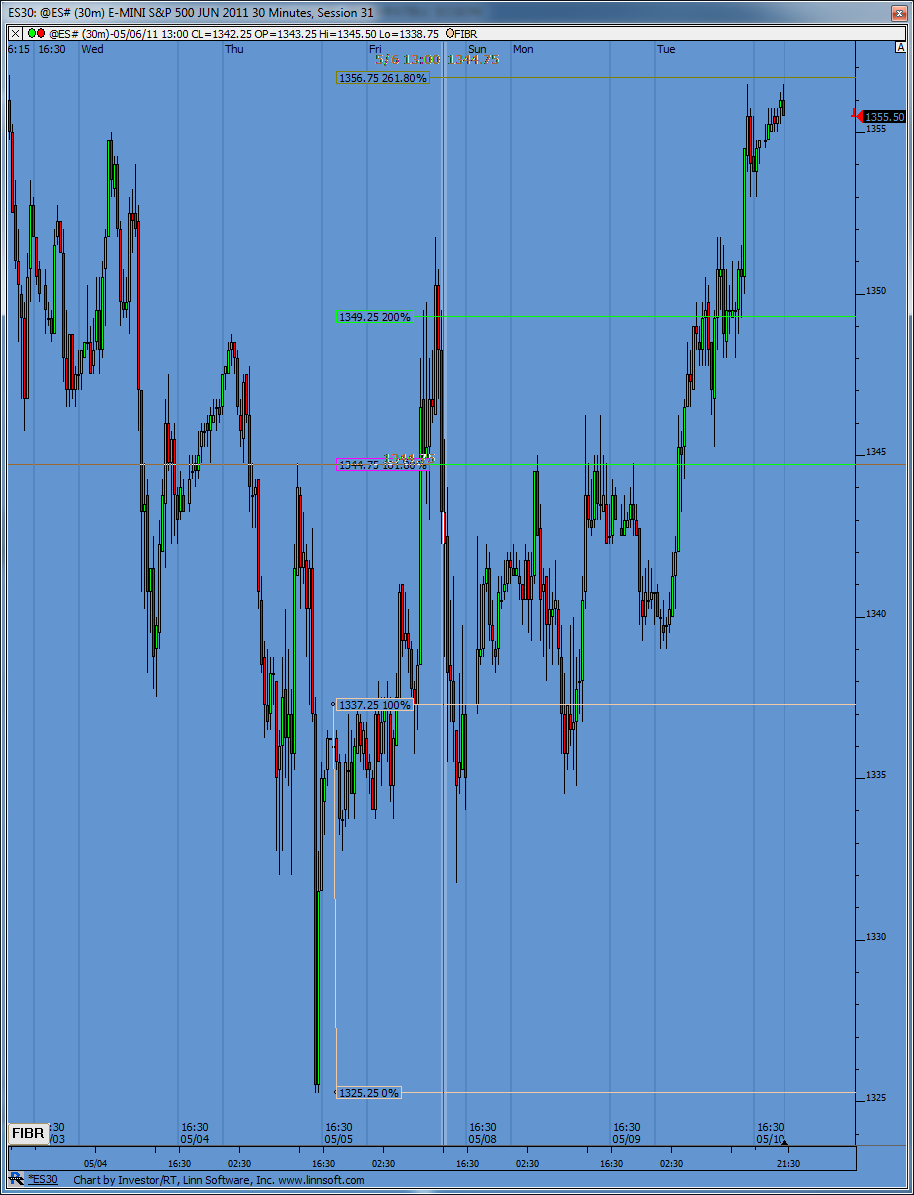
Here is that fib projection posted earlier today....
Click image for original size
I'm looking for the high to print first today and am a seller now above Yesterdays RTH highs in O/N session. So above 56 up through 58( Pauls 57.75) is the sell area.....we have an air pocket down into YD breakout point that everyone will be watching so 51.75 is critical for Bulls to try and hold .. then 50 is peak volume so I have the following:
56 - 58 *****
50 - 51.75 ********
46 - 47.50 ***** Tuesdays secondary support
Above the O/N highs there is 62 - 63.50 as that was support becoming resistance on May 2nd....
This will be the third day of a rally and I like sells especially above the previous days highs...Dumb money buys on these days..smart money distributes...we'll see who is dumb today
May the force be with you.....and also the trend !!
Many vendors will have you think that there are "secrets" to trading. I don't buy into that. I know many come here looking for "good" numbers to trade from and ideas...that's a cool thing.
There is a constant give and take between the Overnight trade and the day session trade and they work off each other. I mention this only for those looking to improve there own abilities and learn to find their own numbers.
Look at the highs of the day session from May 3rd and then look at todays current Overnight highs.....see how they match up and have both so far been met with selling. So it goes on our radar as a key area. Look at the current O/N lows ( as I type) and the breakout point from yesterday...they line up. They become key areas.
The point of my rambling is we need to respect both sessions and find common denominators to arrive at strong numbers to provide us with the confidence we need to take the trades. No real secrets to finding good numbers. The real secret is having the ability to just take the trades when your numbers show up on your screen! The secret is getting yourself to take action !
So ends todays motivational speech.
BruceM
Remember the old Mennen's Skin Bracer commercial?
Well "Thanks, I needed that"
Remember the old Mennen's Skin Bracer commercial?
Well "Thanks, I needed that"
Oh yeah, that loud SLAPPING sound.......too funny and gives me a great visual in my brain...thank YOU for that...
Agree totally with Bruce's observations.
I would like to see incyte (from a couple of days ago) post because he/she offered straight, easy reads of price points and action.
right now it looks like open could be below yesterday's H (RTH H 1356.50) and Near Midpoint of the O/N. Key levels to watch to see if they act like S or R or are just meaningless.
my thoughts
if no gap today, have to watch PA at O/N midpt,
if test of the H (have to give it a little wiggle room, maybe to 57.75, I don't know what will happen)) and H proves to be resist, come down test yest close or O/N L (1352.00 right now)
I haven't done quantitative studies, but after 3 days of HL I can tell you this (no guarantee on this, this is memory of an old man)that once I read gapguy and I think he said that after 3 days of HL, 85% chance that a gap up fade is profitable by end of day (if "gap up open" is sold, I think this just means 85% OF THE TIME, price by the close should be lower than the open (if a gap higher) or gap will have filled (gap fill = target).
But it doesn't even look like there will be a gap up today. Too bad.
I don't post all the time because I did it for years on a site and quite frankly I am sick of posting. -sorry.
It's a keeper. THANKS!
BTW... Curious if you don't mind if I ask. You were holding for 53 yesterday and it touched at least a half dozen times. Did they give it to you at 53? Hope I'm not prying, but I was rooting and cursing over here.
BTW... Curious if you don't mind if I ask. You were holding for 53 yesterday and it touched at least a half dozen times. Did they give it to you at 53? Hope I'm not prying, but I was rooting and cursing over here.
Paul9 said; "Key levels to watch to see if they act like S or R or are just meaningless."
??????
??????
Went long at 50 but didn't like the heat so went flat with .25 on the rebound.
I forgot to get back to this Yesterday...I did have shorts on Tuesday afternoon and on Wednesday morning in the same general area...the 1356 area...hence the confusion...So the previous answer I gave was specifically referring to the shorts from Tuesday..
Originally posted by TradeQueen
Originally posted by BruceM
I go market when I see the print on my screen.. so sometimes that works in my favor and sometimes it doesn't.....I like to use limit orders more on runners so I don't need to babysit the trades
I have a bad habit of speaking out of context. sorry. I was referring to yesterday when you were having fun with Lorn.
Originally posted by BruceMI'm short my 56 number...c'mon Lorn lets see what ya got ? LOL !!
Trying for 53 !!
No worries.
Emini Day Trading /
Daily Notes /
Forecast /
Economic Events /
Search /
Terms and Conditions /
Disclaimer /
Books /
Online Books /
Site Map /
Contact /
Privacy Policy /
Links /
About /
Day Trading Forum /
Investment Calculators /
Pivot Point Calculator /
Market Profile Generator /
Fibonacci Calculator /
Mailing List /
Advertise Here /
Articles /
Financial Terms /
Brokers /
Software /
Holidays /
Stock Split Calendar /
Mortgage Calculator /
Donate
Copyright © 2004-2023, MyPivots. All rights reserved.
Copyright © 2004-2023, MyPivots. All rights reserved.