MyPivots
Sign In
JA
jarek
Rep: 94
Posts: 3,474
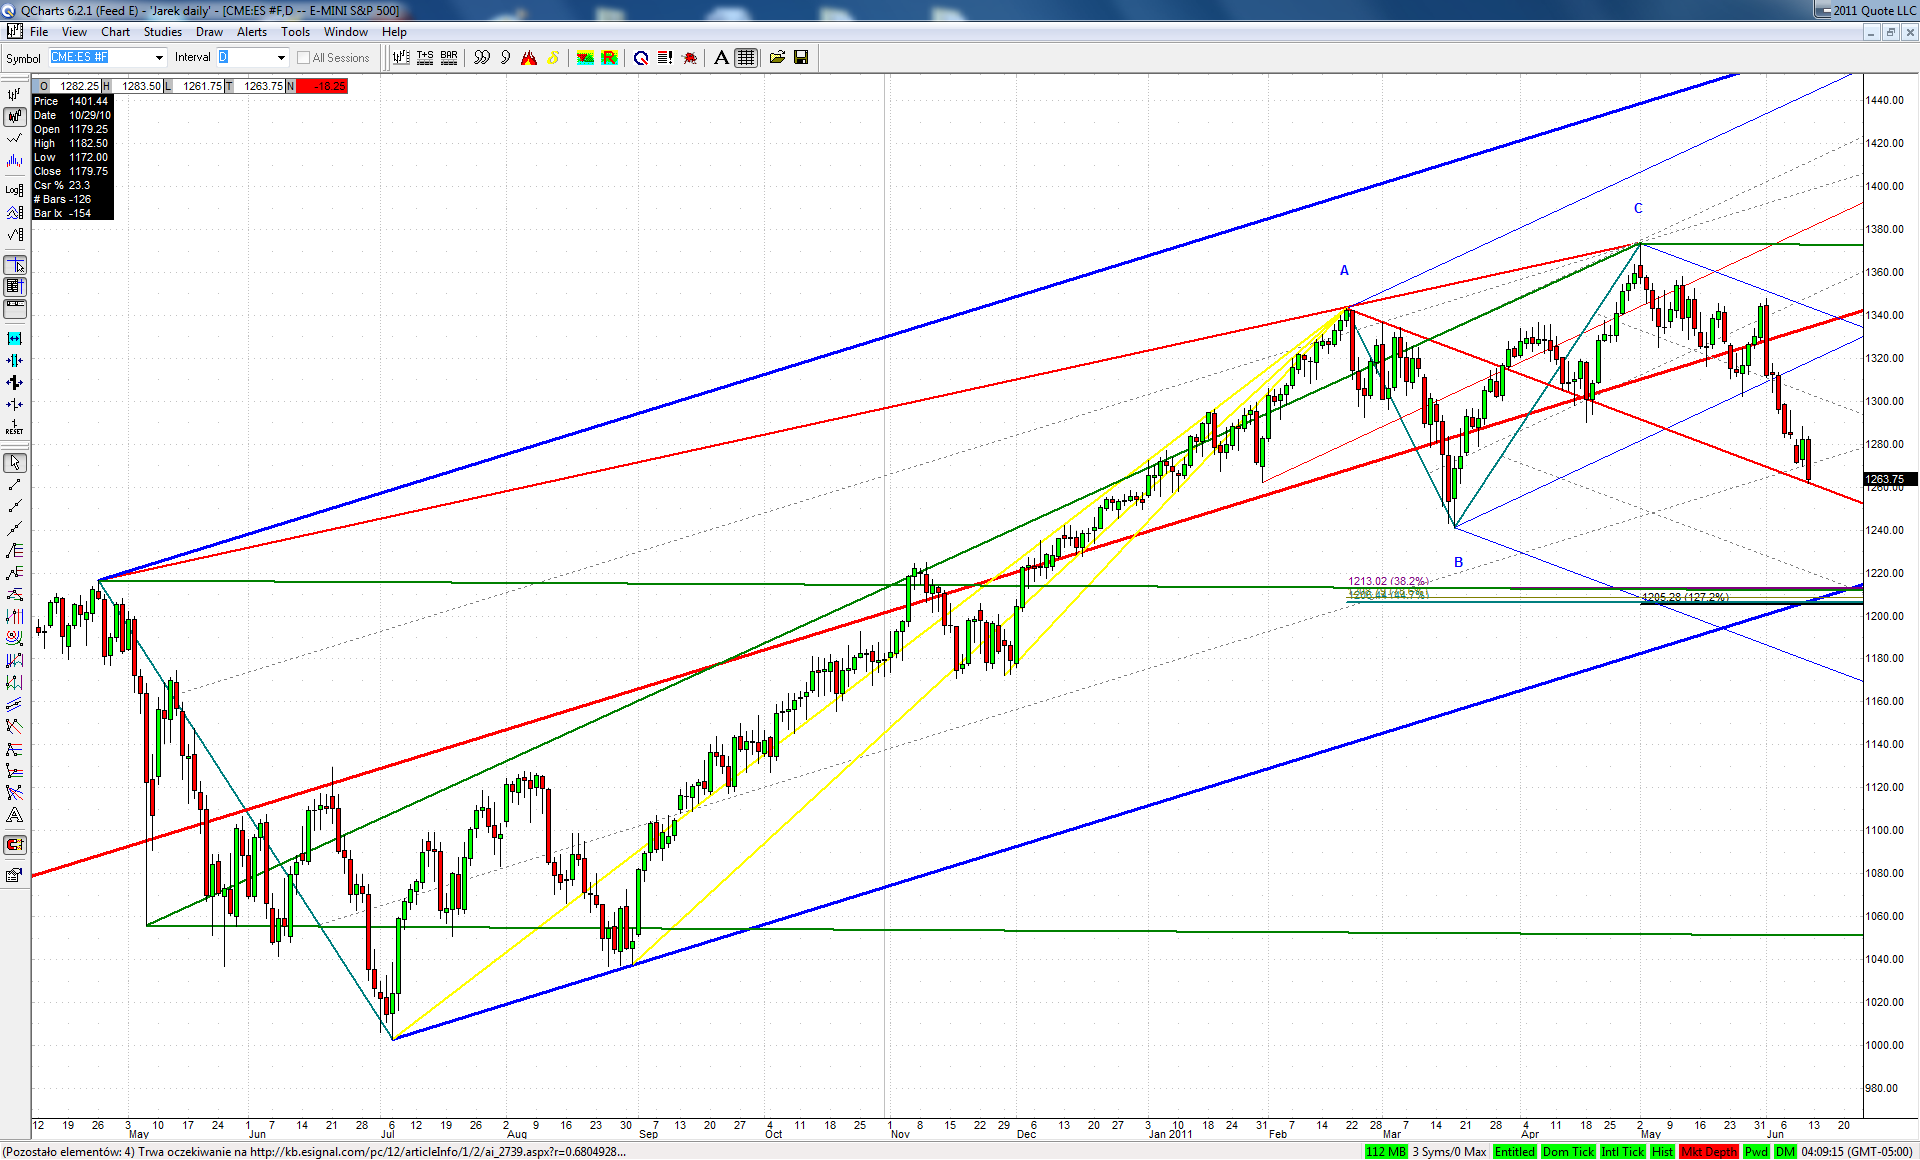
ES approached major downsloping ML on a daily chart:

Click image for original size

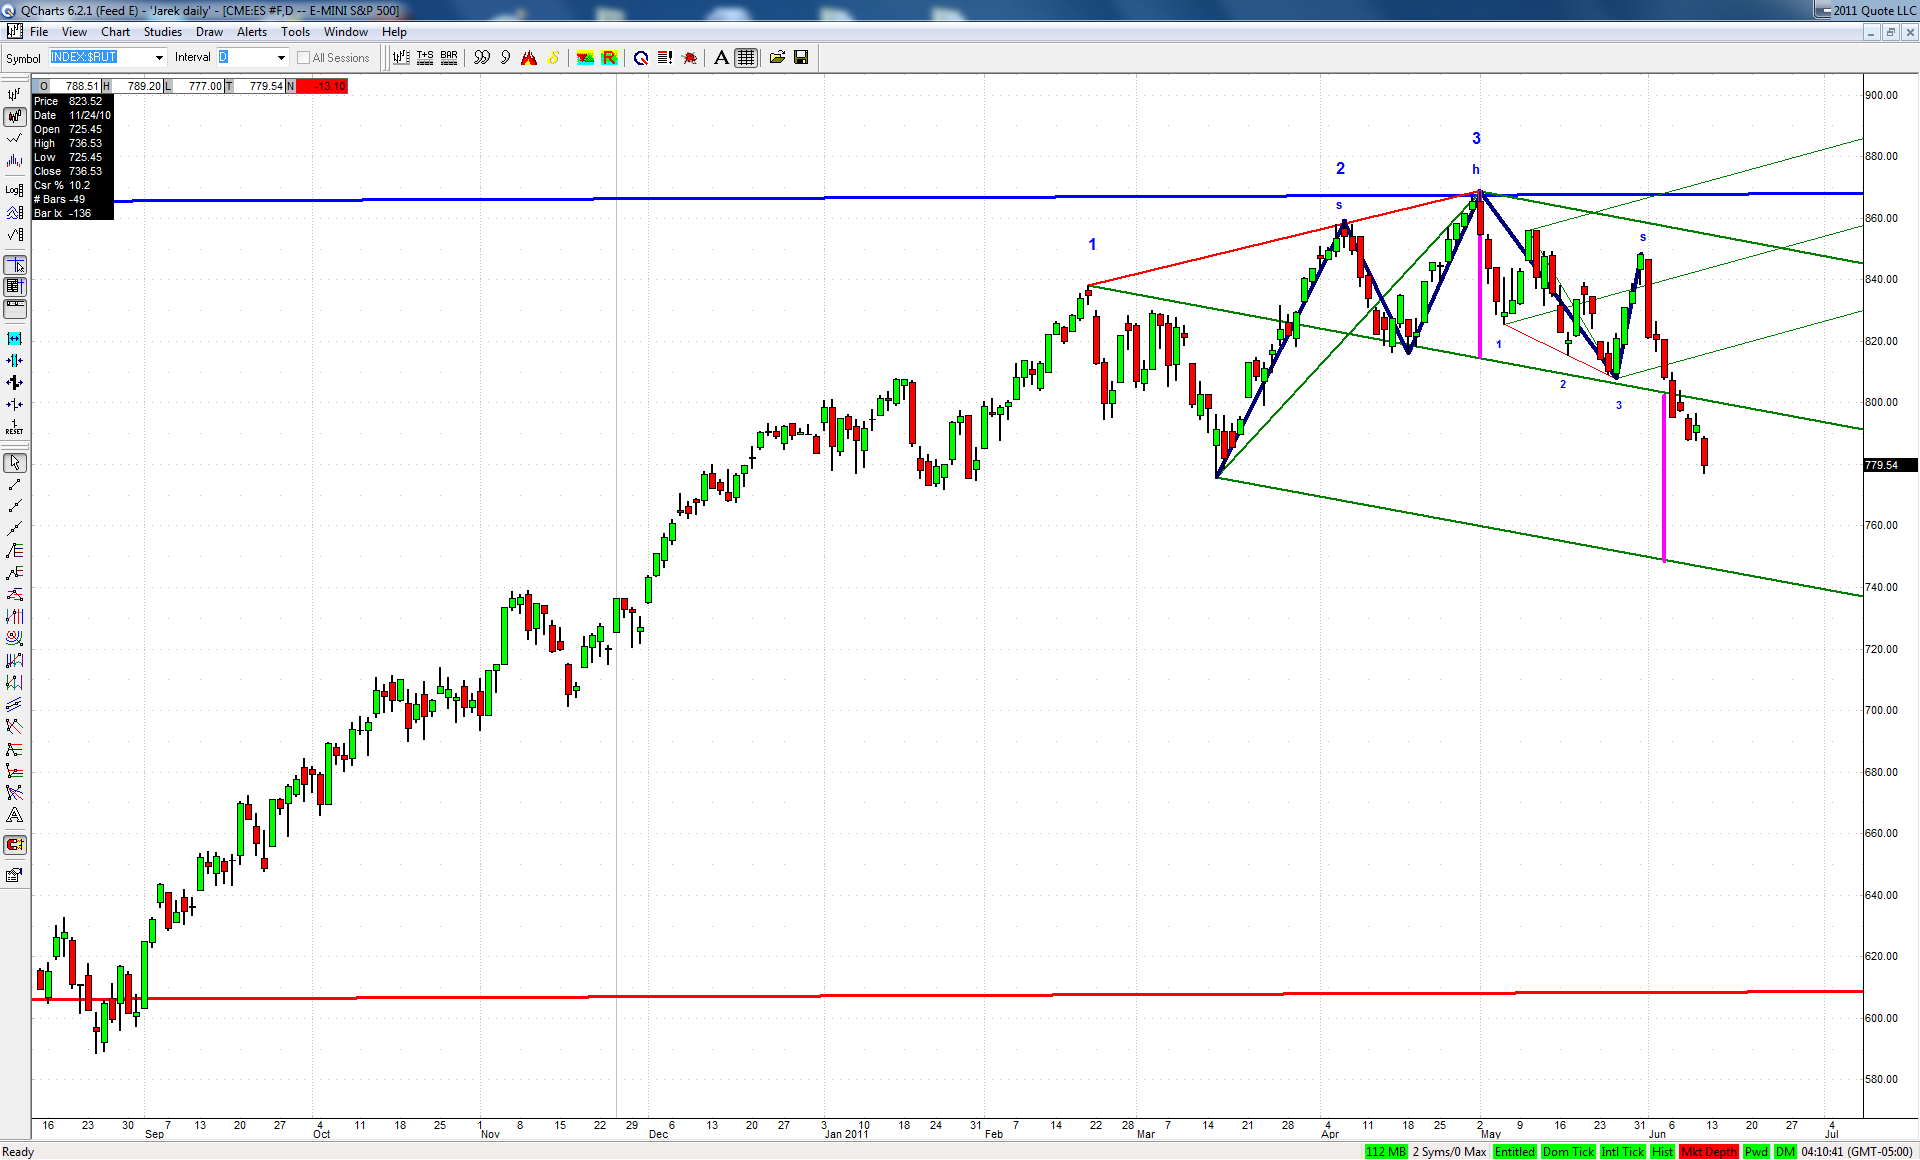
Acceleration, bounce or coil now? In case of the first, our target area is just 4-5% away. Exactly the same as in case of $RUT for the move off its head and shoulders pattern confluent with the green set lower ML:

Click image for original size
TX
tx_ches
Rep: -10
Posts: 514
Originally posted by jimkane

I also mentioned this area being a key area from much higher timeframes. Yet I haven't seen a single chart from anyone showing the at least four key upsloping lines for this area.

Rat gave you 1 and Jarek gave you 1.
Are these one of the remaining?
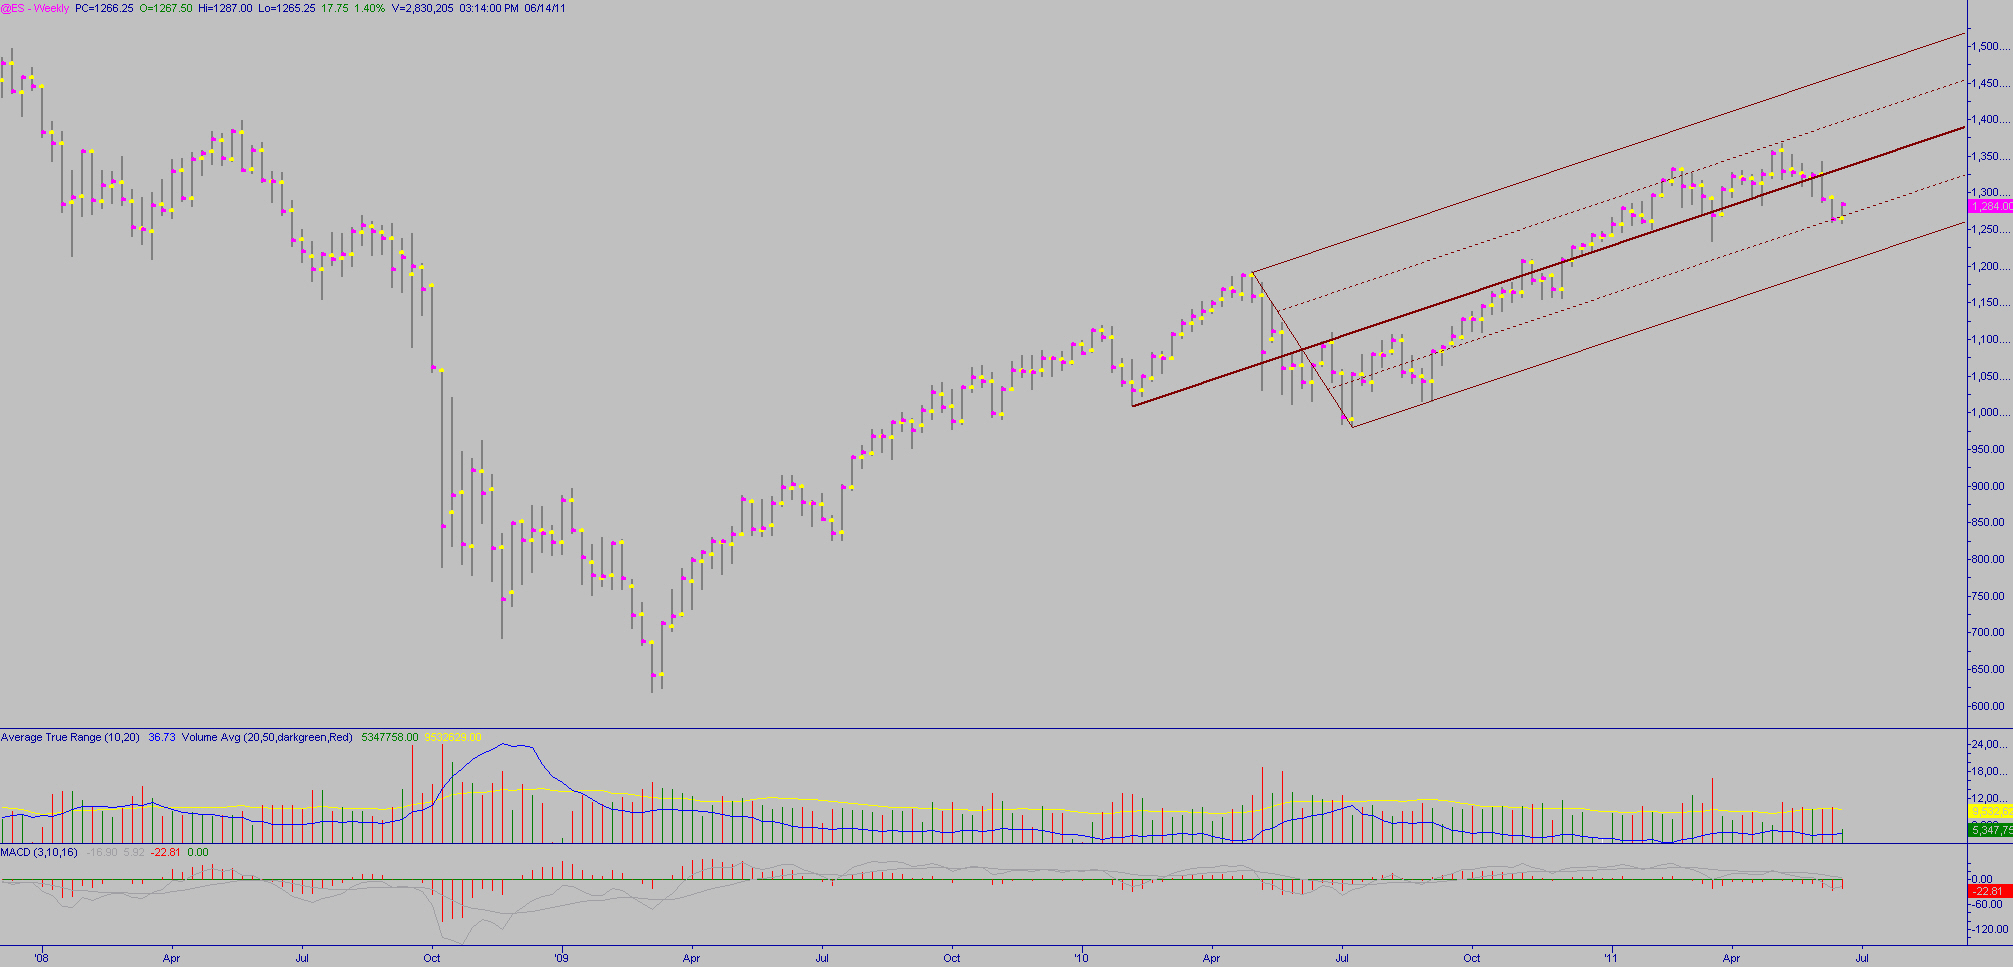
ES weekly quartile line.
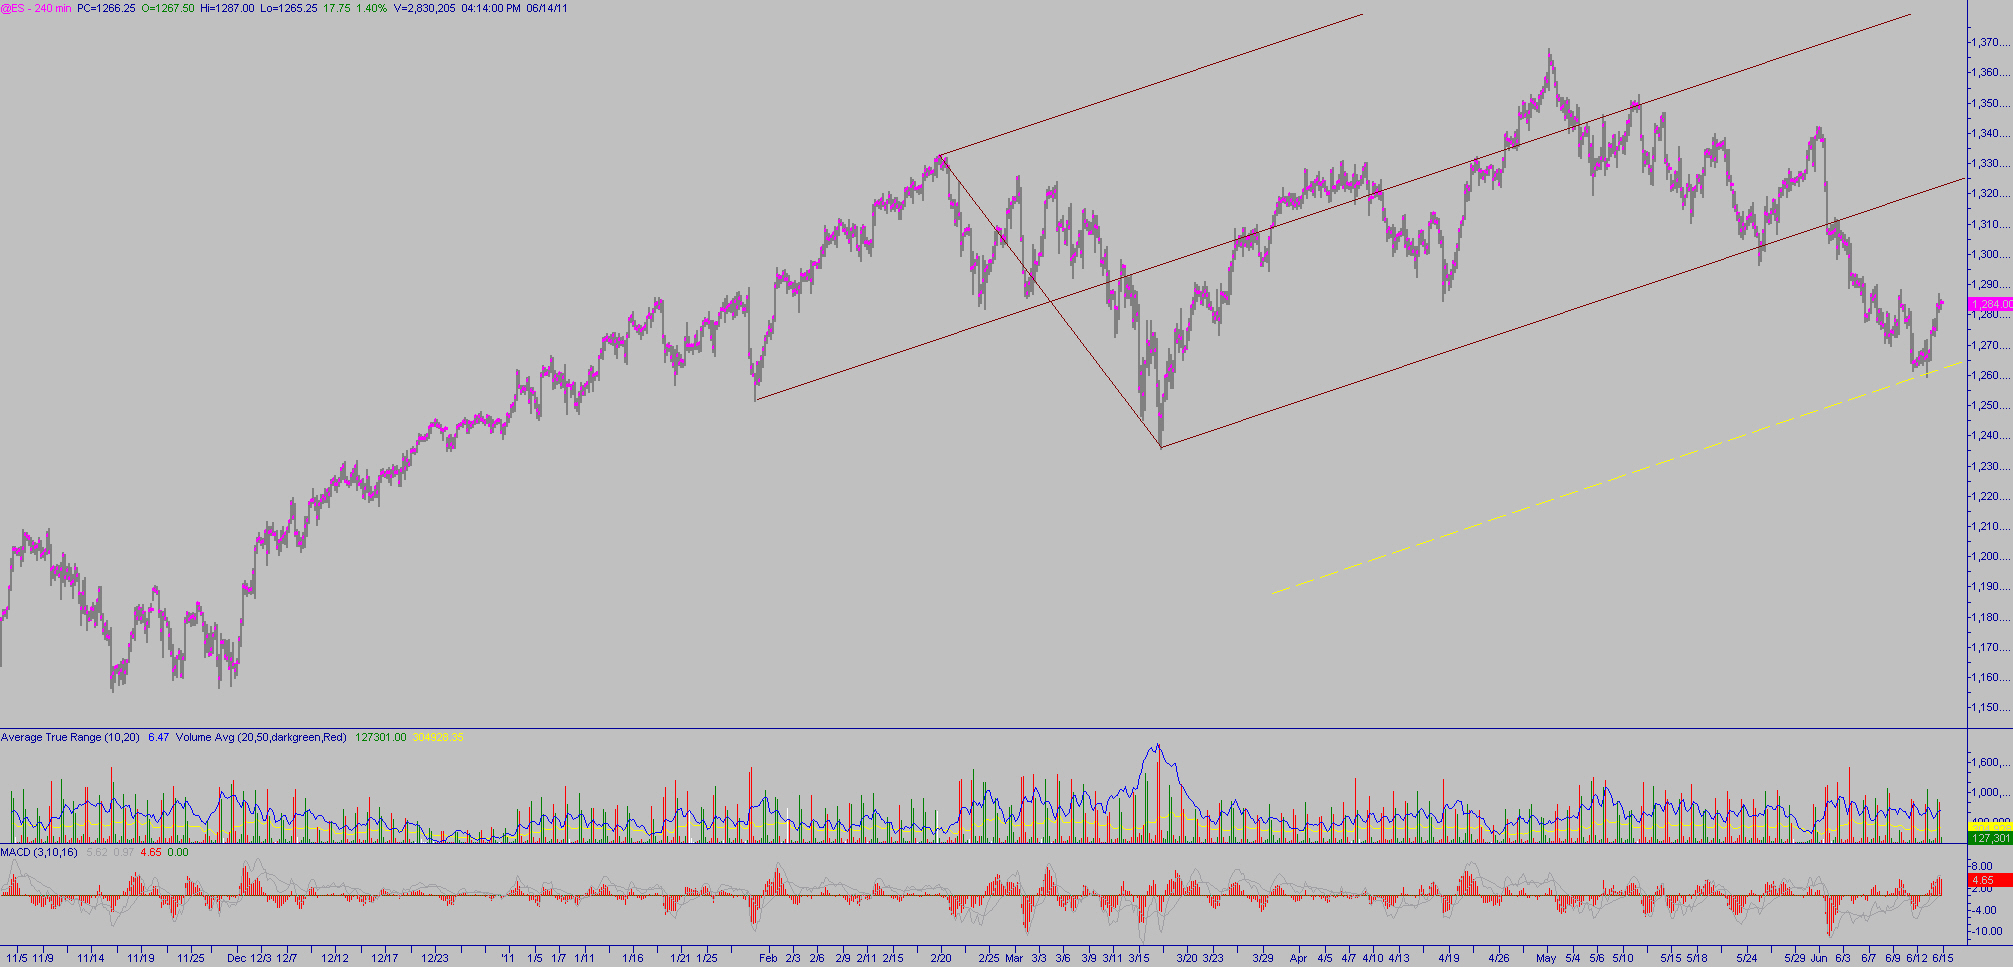
ES 240 minute warning line.

Click image for original size


Click image for original size
JI
jimkane
Rep: 3,058
Posts: 33,089
Just my two cents but I think what would help people is posting where their stop is on the chart, explaining why it is placed there, posting where the trade was closed on the chart (with a horizontal mark, for example), and why, and so on.

One issue will be that my methodology doesn't use targets, and uses a lot of active management. If one is using a style like roofer's, for example, with a clear target strategy, then if one is trying to learn my methodology, posting a target and then exiting there well may be useful for those using that strategy, but not so much for those trying to learn my style.

It's not that I don't have areas of concern, it's just that those areas trigger me to perhaps tighten up my trailing stops method, not have me take any position off because it got there. Hence, the most benefit for those trying to learn my methodology may be to show areas of concern, and what trailing stops methods were being used, and how they got tighter at certain areas, and so on. These are the things we aren't seeing in the endless sea of great posts on areas. How are things handled when they don't play out fully, don't play out at all, play out partially, and so on.

I also know I'm probably opening a can of worms I don't have the time to deal with, in that now we'll get a bunch of posts of the above from various people, and I'll see how they are not as fully in line with my techniques as they could be. Then I'll be inclined to do long posts with detailed explanations of how to do it more in accord with the methodology...


Originally posted by tx_ches

"how to time things, how to decide if the 'idea' (the trade premise) is likely a good one" is my weakness. Frequently, I'll pass on trades that I should have taken.

In the interest of "keeping it real", anyone, please let me know if I should be posting differently to help others out. I admit to posting "setup ideas" and maybe that is not helpful from a newbie.

During the day, I sometimes post (possibly overpost) to keep myself engaged in the action and to keep from over-trading.

I like everyone's posts. I don't always understand why Rat posted a chart if he doesn't make a comment about the chart. I know that is because he takes different setups than I do so he is seeing something that I don't see. I'm glad I can always ask him a question.

Fantastic forum. I only read a few other blogs and they are all from traders who keep it real and do no self-promotion. So I don't see on a daily basis what Jim sees out there. But I know what he means because I did see that at the place where I originally found Joed and roofer.
JI
jimkane
Rep: 3,058
Posts: 33,089
Both of those are great lines, and show just how many times this frequency has been seen. Neither are the ones I was referring to, though. Your first set is a 'variation' on the one rat showed.


Originally posted by tx_ches

Originally posted by jimkane

I also mentioned this area being a key area from much higher timeframes. Yet I haven't seen a single chart from anyone showing the at least four key upsloping lines for this area.

Rat gave you 1 and Jarek gave you 1.
Are these one of the remaining?
ES weekly quartile line.
ES 240 minute warning line.

Click image for original size


Click image for original size

RA
rat89
Rep: 0
Posts: 7,015
looking at wrong thing? the upsloping set was bothering me all day yesterday because of the way the low was not established by three swing lows hitting the line, with fibs. it was kinda, sorta, the 1.27 was there, but if I straightened the line it cut through the candle body of the middle swing, not just the wick. the harmonic made sense, then there is a sliding parallel of the harmonic, and then before you know it the chart is getting more tortured by the minute.


Click image for original size


meanwhile the good old schiff set that I wasn't looking at was making sense of some sort. not that I have many samples of this, but it's an interesting thing to look for - move to the median line, creep, then gap to the upper line and move to the next harmonic. is this something to watch for after extreme moves in either direction?


Click image for original size
TX
tx_ches
Rep: -10
Posts: 514
Jarek isn't here today.
So I'll start.
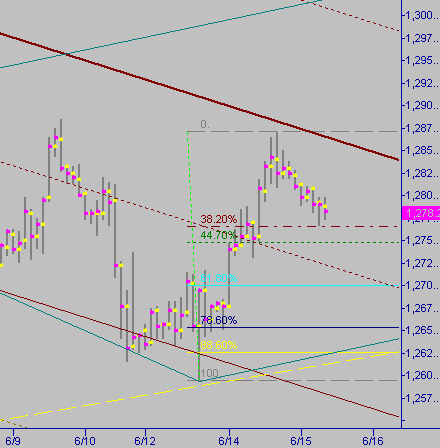
On the ES 120, we got a pullback to the 38 line from the low of 1259.50.

Click image for original size
TX
tx_ches
Rep: -10
Posts: 514
I don't stay in a trade long enough to worry about active mgm. But when I advance to that stage, I'll post it.

Jarek is right about over-running of the 44.7. I put my stop just beyond yesterday and got stopped out.
Something that I'll avoid as I gain more experience.

Originally posted by jimkane

what would help people is posting where their stop is on the chart, explaining why it is placed there, posting where the trade was closed on the chart (with a horizontal mark, for example), and why, and so on.

One issue will be that my methodology doesn't use targets, and uses a lot of active management.
TX
tx_ches
Rep: -10
Posts: 514
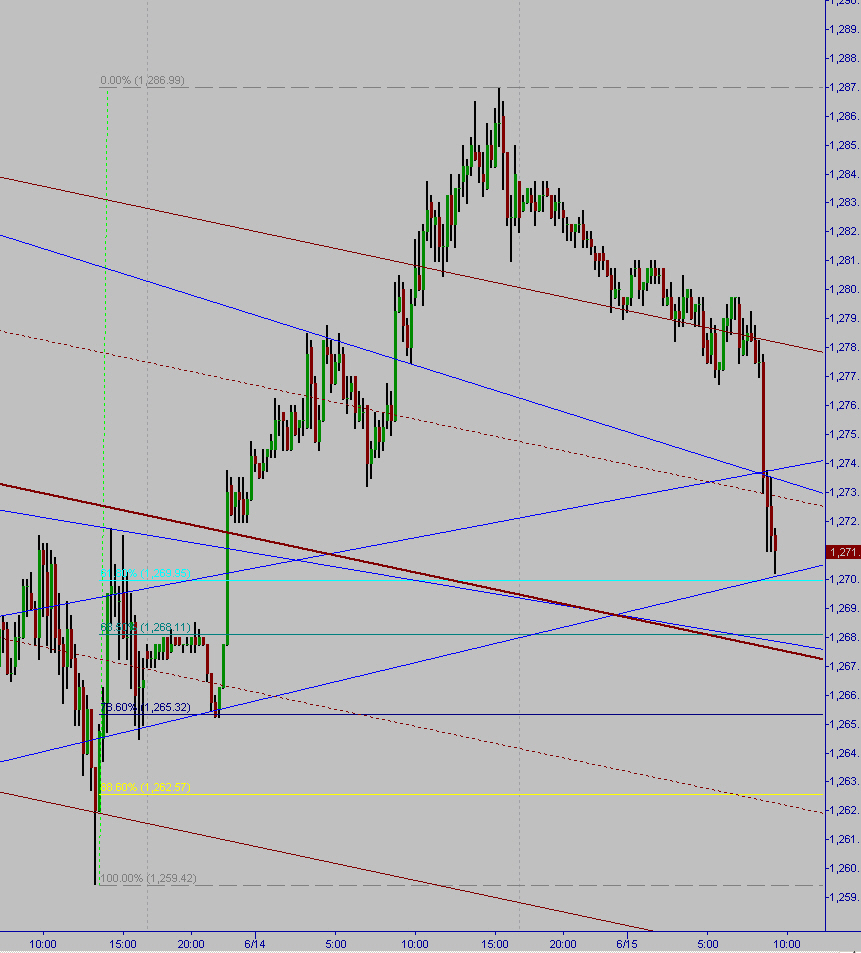
ES 15 minute.
Mkt didn't like the econ news on NY mfr and CPI.
Now retraced to 61%.
Click image for original size
TX
tx_ches
Rep: -10
Posts: 514
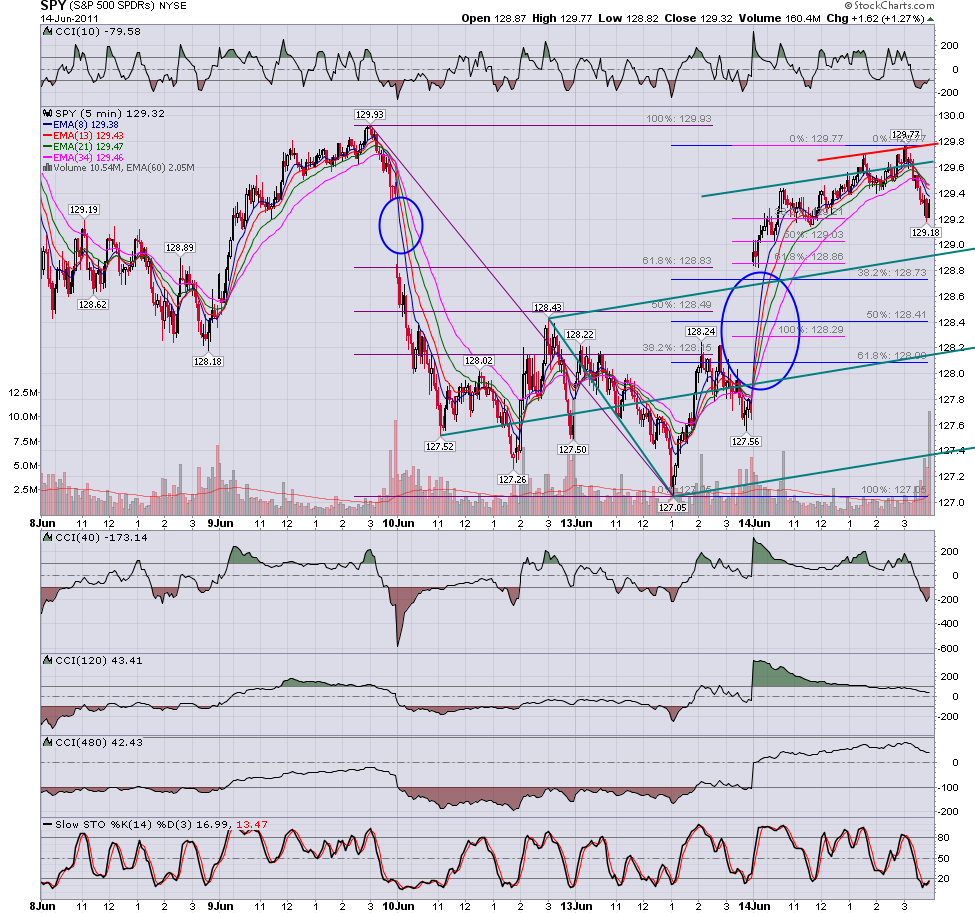
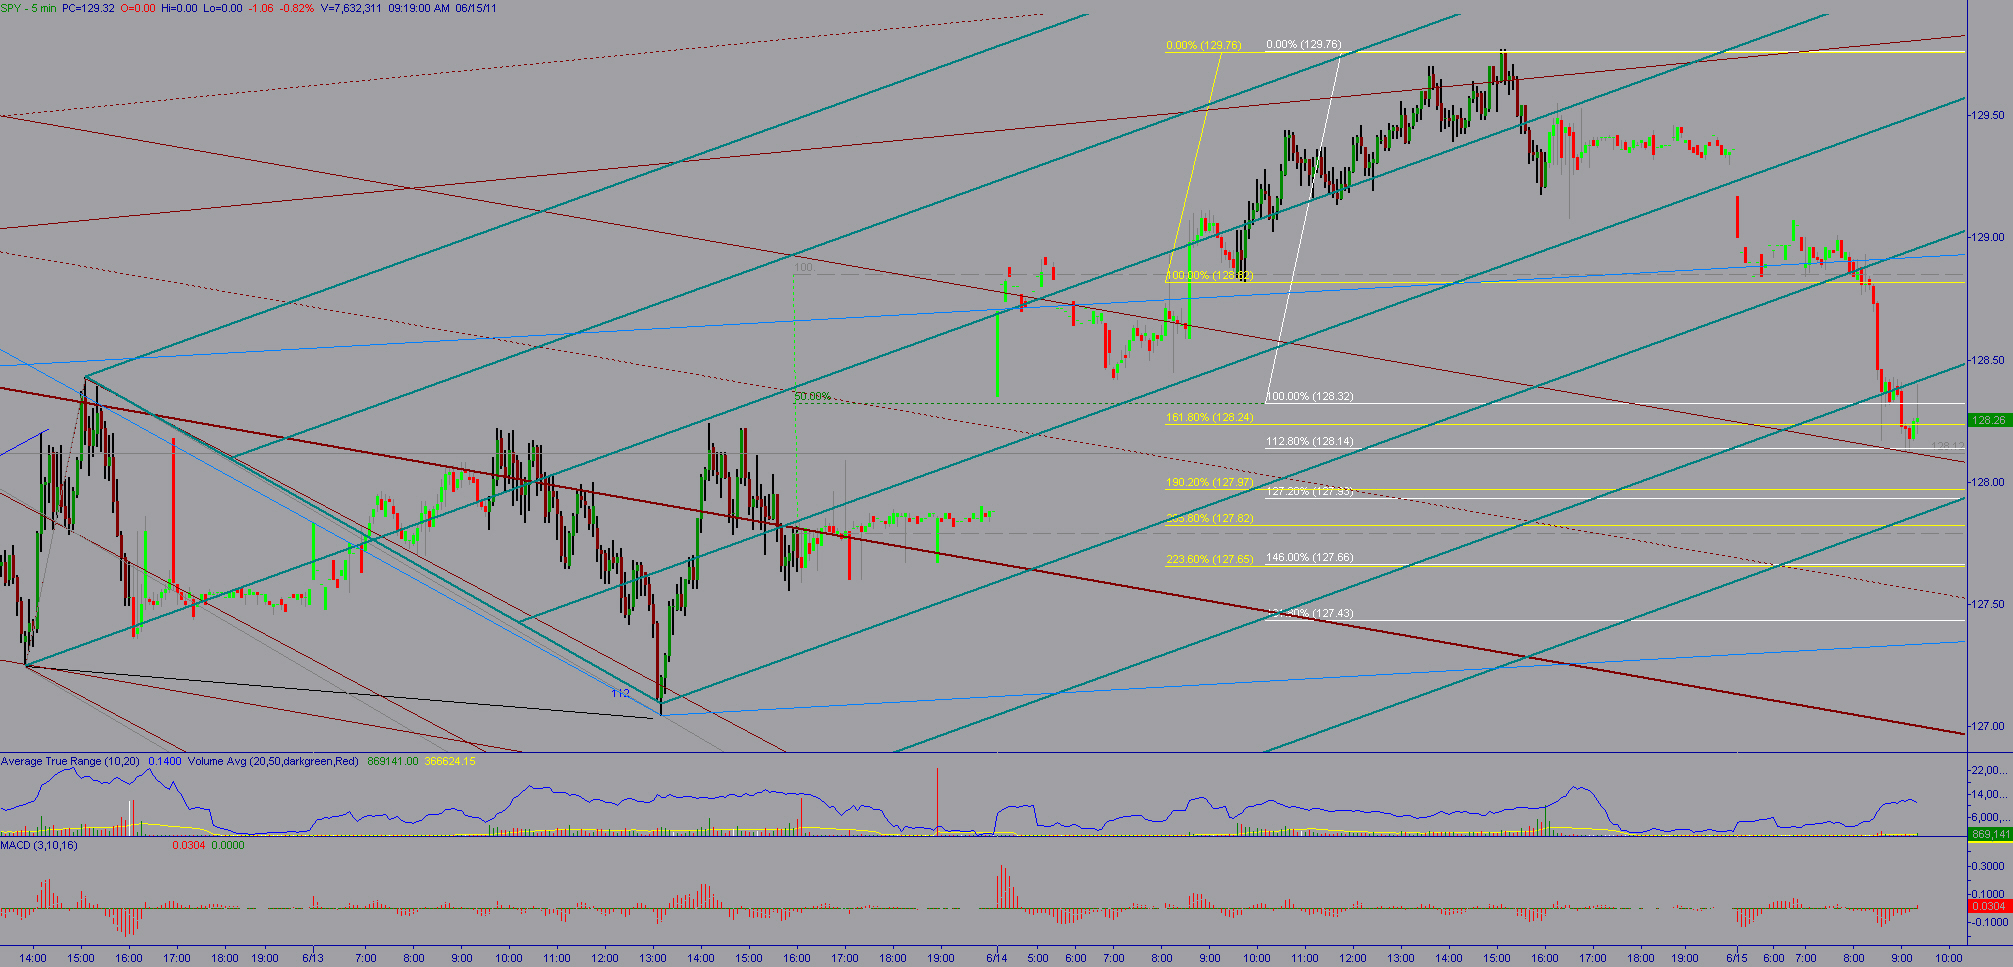
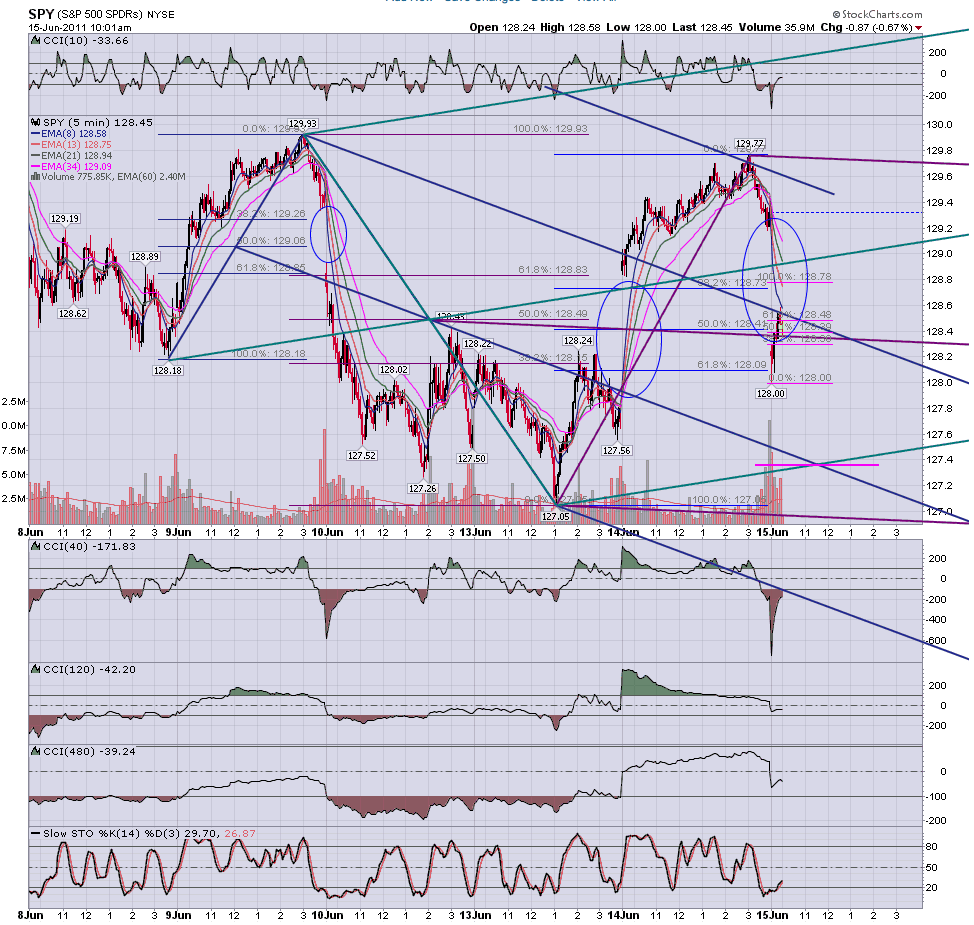
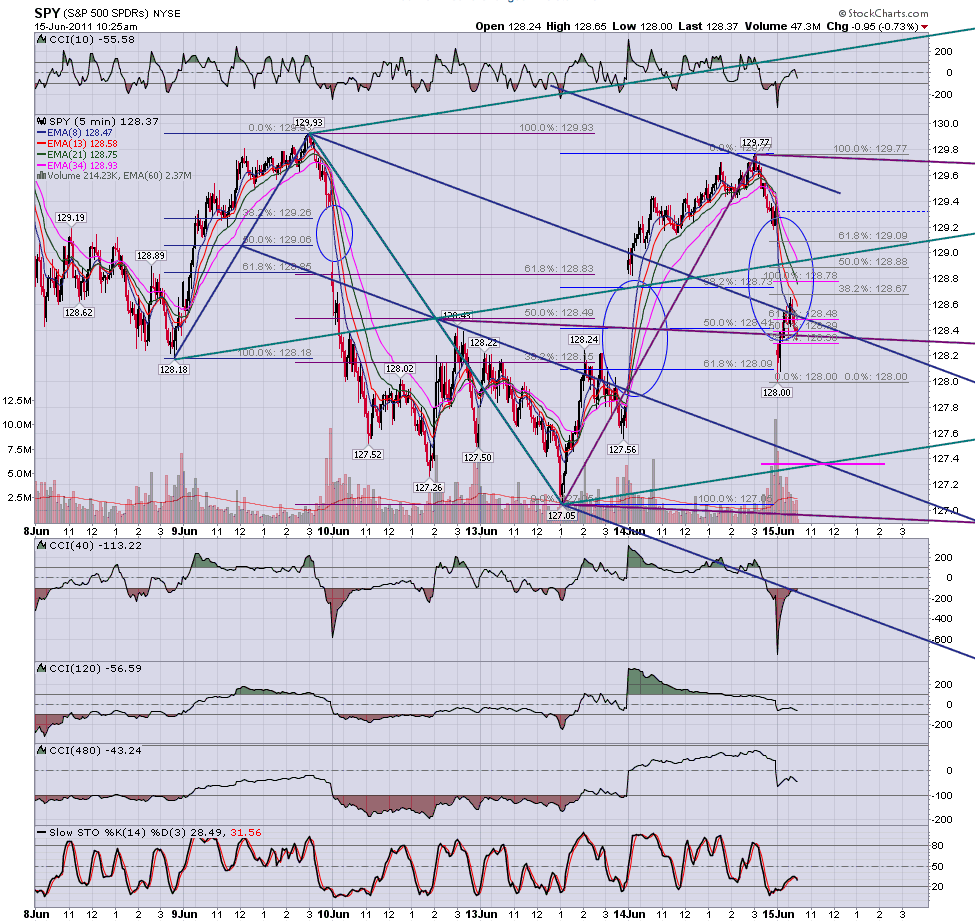
SPY 5 minute 24 hour.
Looks like we'll get another gap opening - gap down.
SPY pre-mkt retraced to 112 level of the 50% level of gap (white set fibs) and overshot 161 level of Y open low (yellow set fibs).

Click image for original size
RA
rat89
Rep: 0
Posts: 7,015
4th gap in a row.....magenta line is 886.....yesterday price went to .942....
Click image for original size
RA
rat89
Rep: 0
Posts: 7,015
and jumped the line to the .382


Click image for original size
JI
jimkane
Rep: 3,058
Posts: 33,089
Okay, that's it for me. I probably won't post again until the Sunday night session.