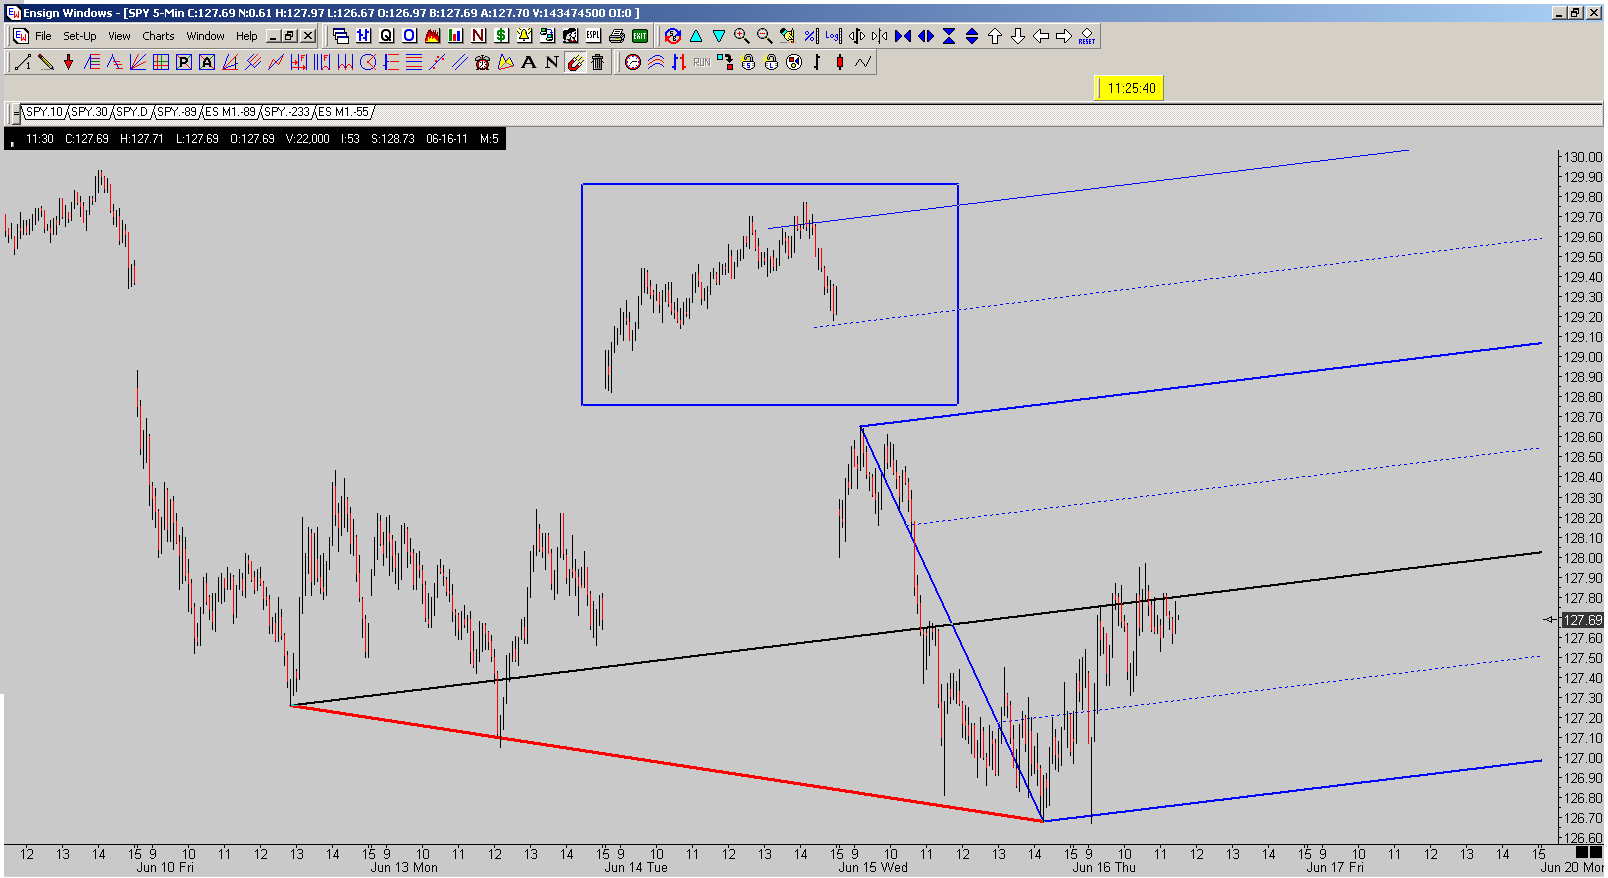
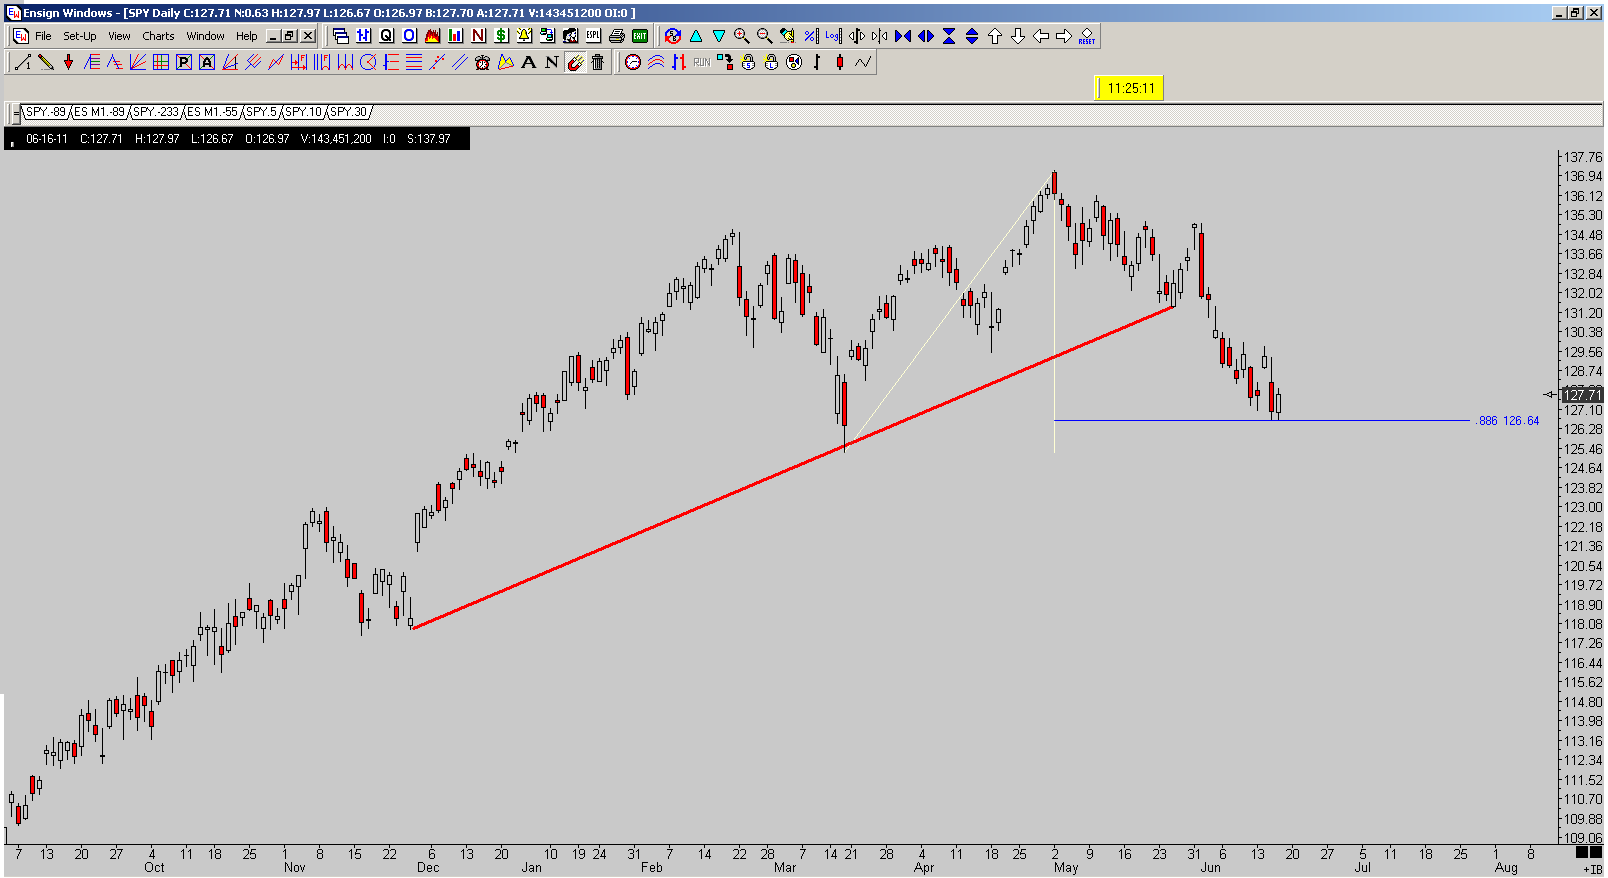
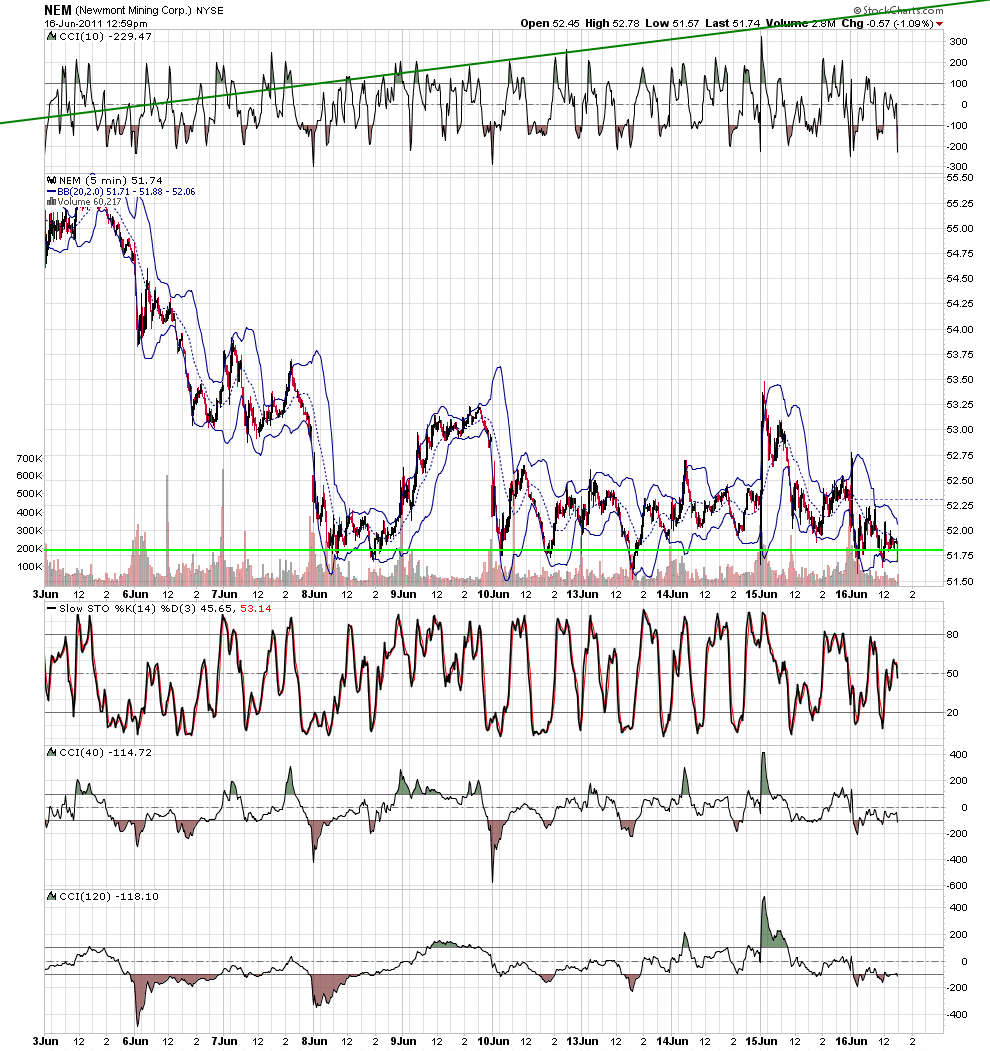
ES approached major downsloping ML on a daily chart:
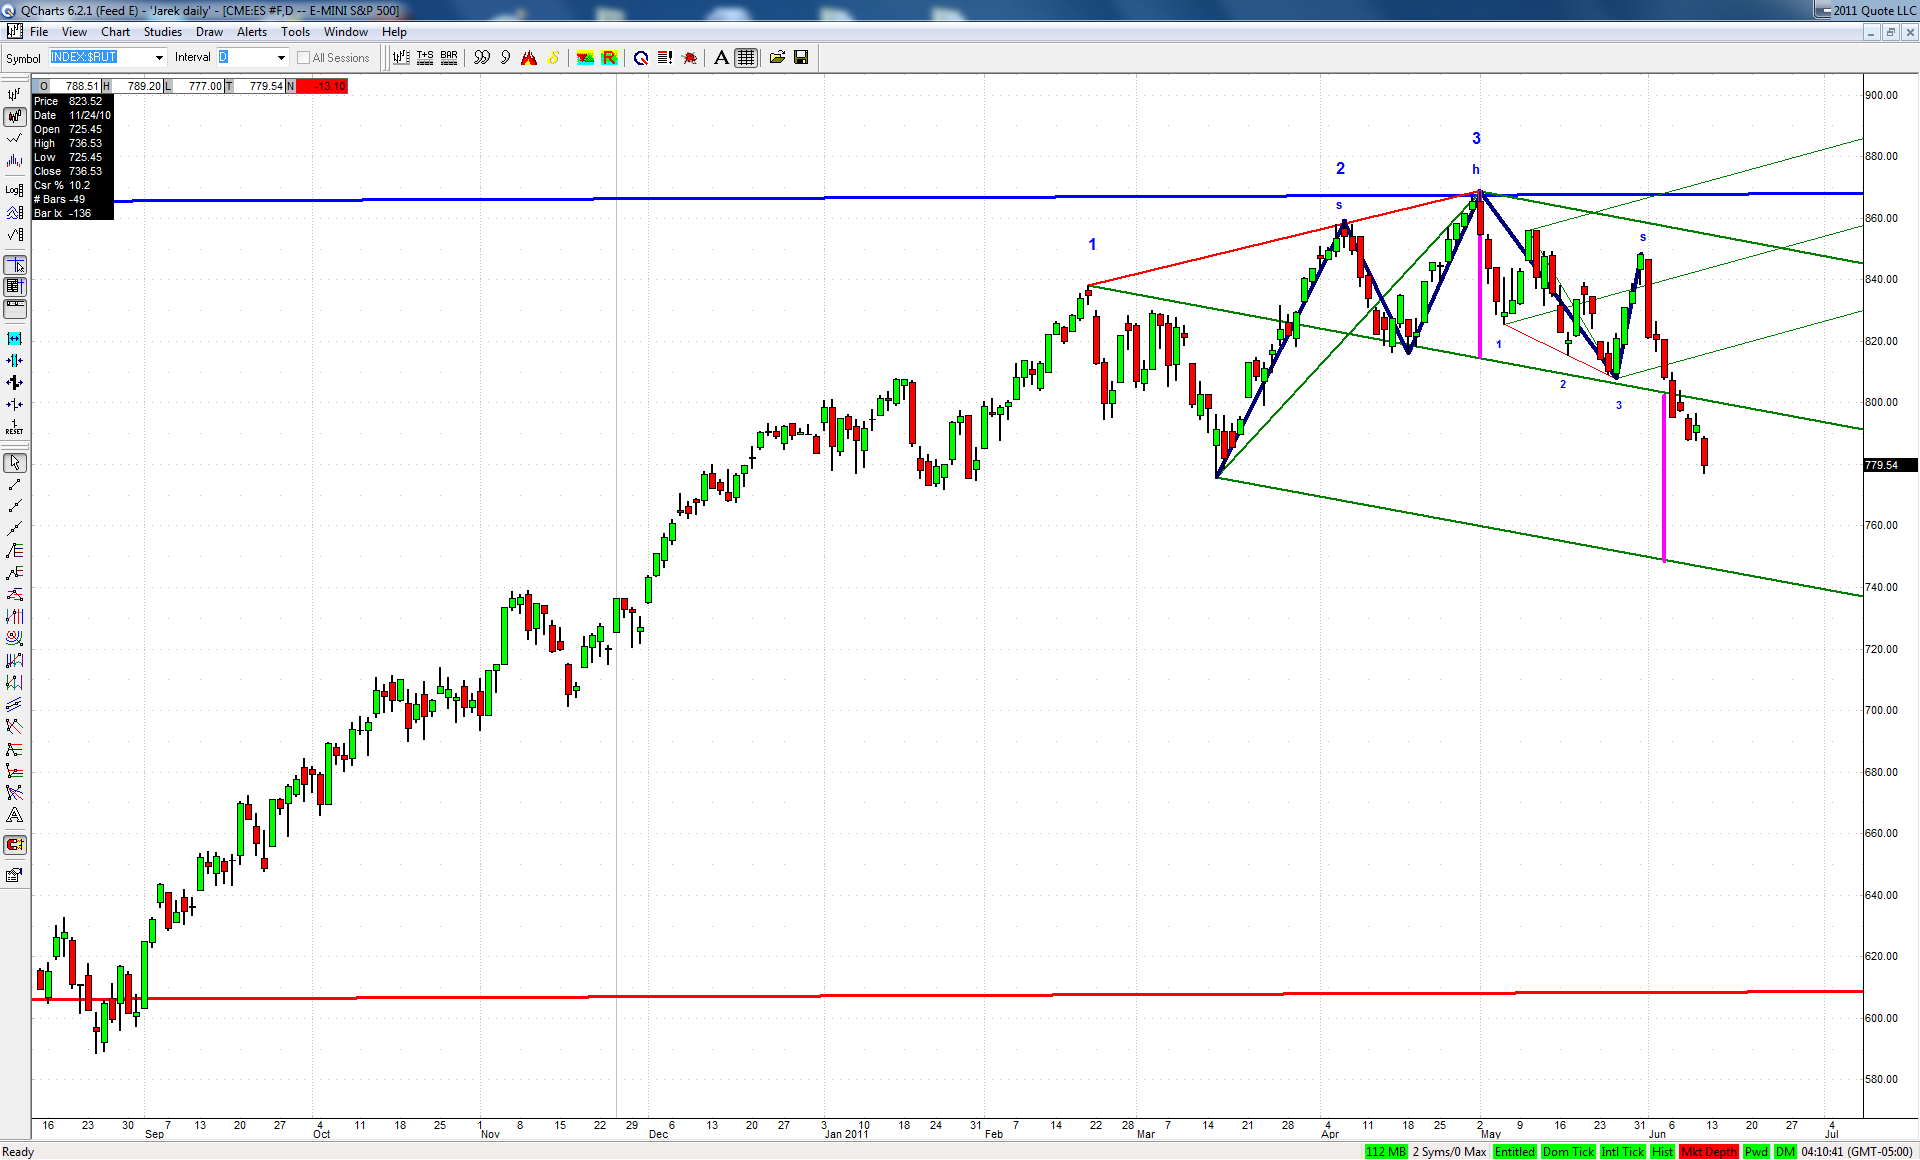
Acceleration, bounce or coil now? In case of the first, our target area is just 4-5% away. Exactly the same as in case of $RUT for the move off its head and shoulders pattern confluent with the green set lower ML:
AL
albert
Rep: 99
Posts: 3,094
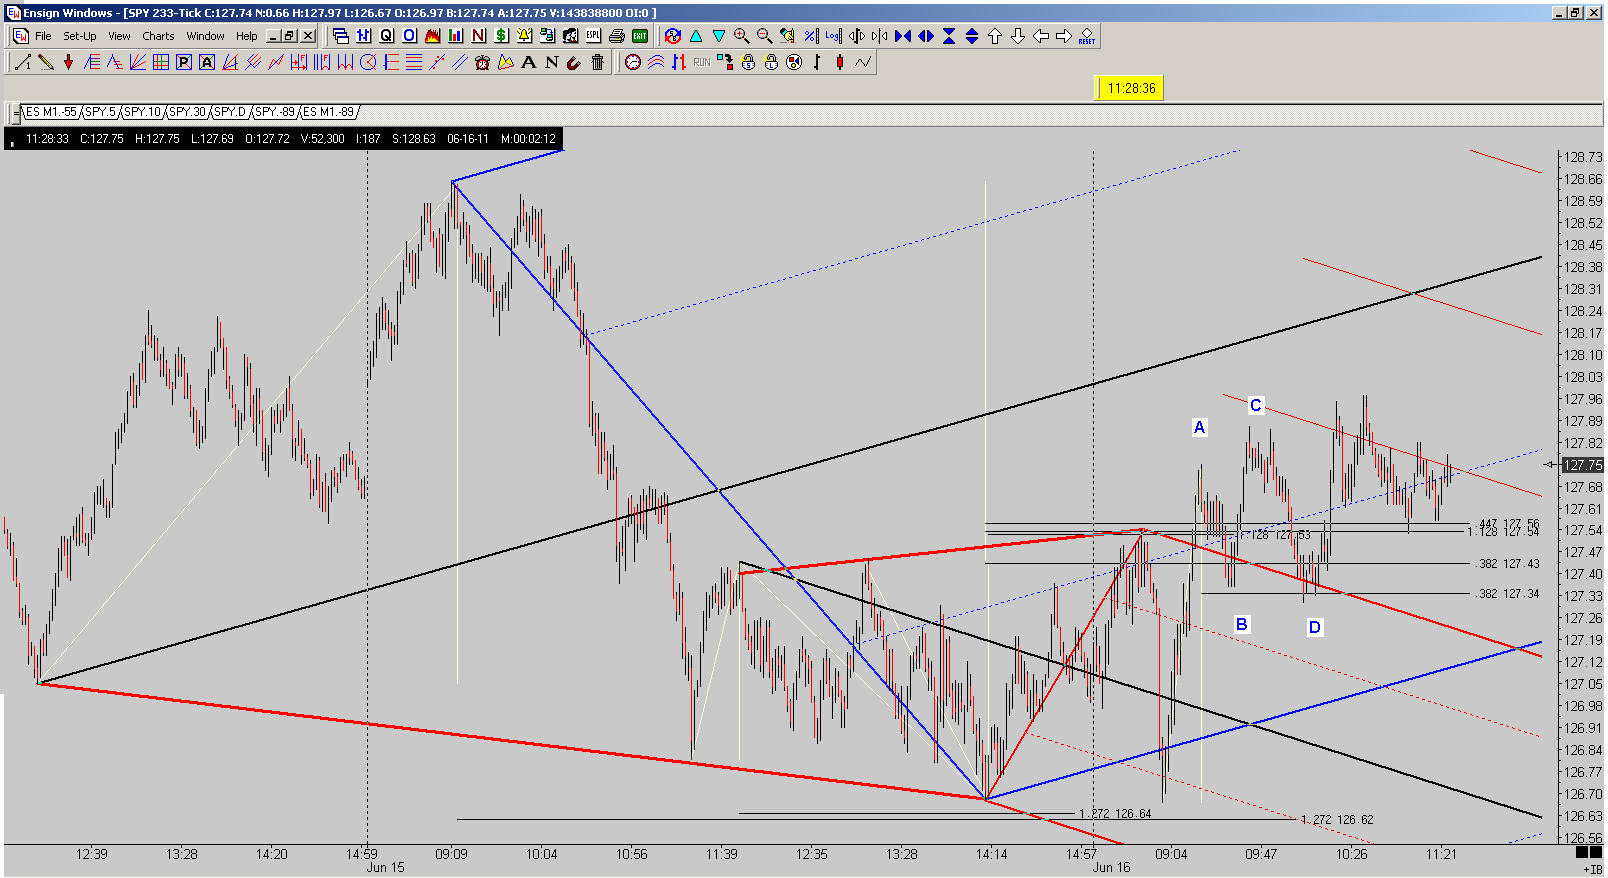
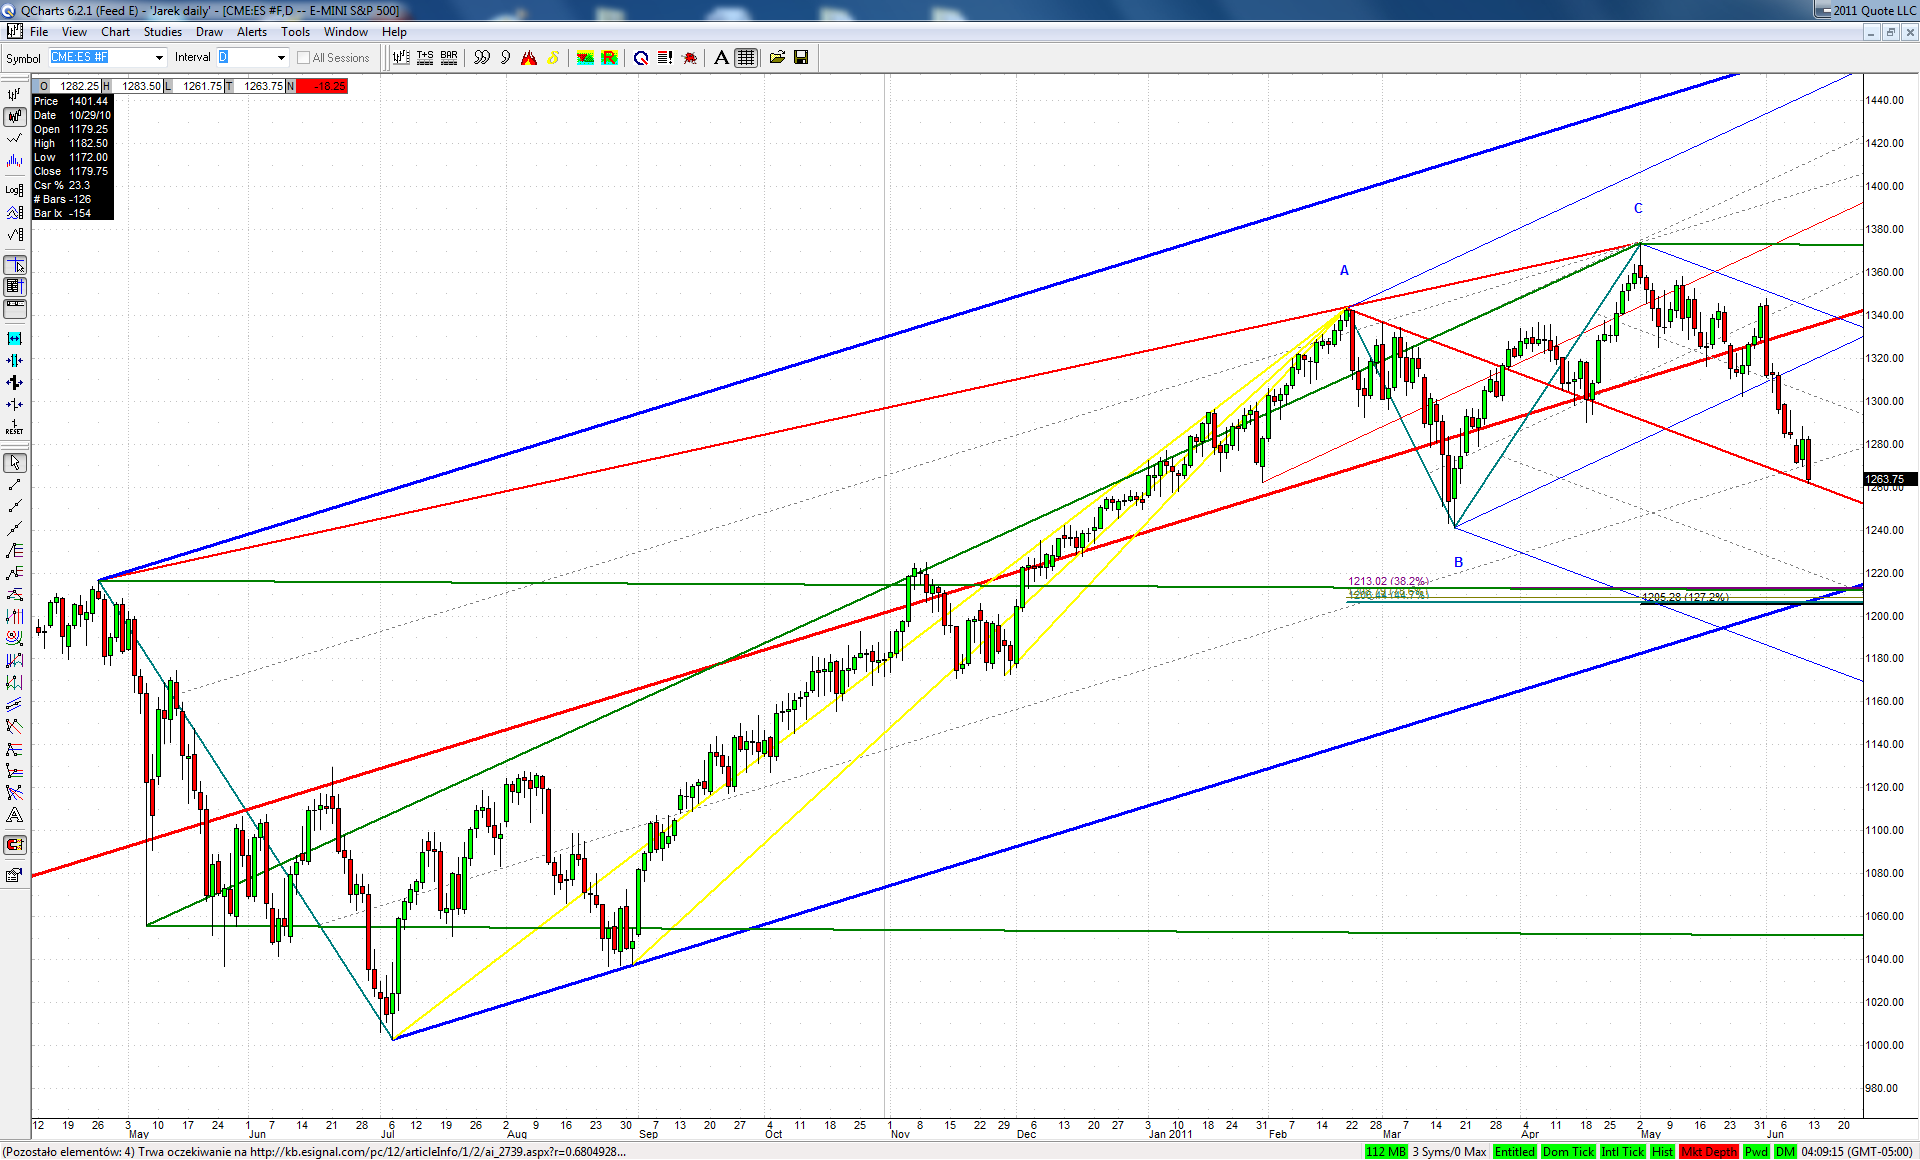
Island Top, bullish DBS completing at 0.886 fibo, a bearish 1.128 DBS completing in KZ at 0.447 fibo, and a Kane EXP ABCD completing at 0.382 fibo. These tools are awesome. Kane Trading rocks!
Good Trading,
Al Kamego
Good Trading,
Al Kamego
JI
jimkane
Rep: 3,058
Posts: 33,089
All I 'knew' was there was almost no likelihood this would rise directly off that area, it had to trade below that. A base created from 13 failed tries at an area? It just couldn't be. And, it wasn't. They double/triple whipsawed the suckers by rising it, getting longs in, dropping it below the 13 failed tries area and taking longs out and getting new shorts in, then rising it back up, killing the shorts and getting new longs in. Same thing they do on the 1-min chart all the time. I just 'knew' it had to get below that area.
Originally posted by jimkane
ES moving up nicely. 13 failed tries and the area holds? This one will be another new first in all my experience...
JI
jimkane
Rep: 3,058
Posts: 33,089
This thing is in danger of rolling over here at this .447. And it's acting like they see that, and plan to keep trying to stab it up...
JI
jimkane
Rep: 3,058
Posts: 33,089
Wow, does this look ready to roll. Almost too much, it looks that way...
JI
jimkane
Rep: 3,058
Posts: 33,089
If they don't bounce it here at this ABCD, my next levels to watch are 60-60.50 and 57.25-.75.