ES TURBO Analysis for 6-22-11
Just wanted to share my simple and basic analysis for ES trading coming off the heels of the first day of Summer (vice versa for Australia etc.) The following charts consist of two 30m with a purist, common sense approach which leaves no question as to where the market will trade throughout the trading session for Wednesday.
Here's the initial "look"
The chart speaks for itself ... 1306 is DEFINITELY the upside target ... with the downside offering plenty of opportunity!
Here's the initial "look"
Click image for original size
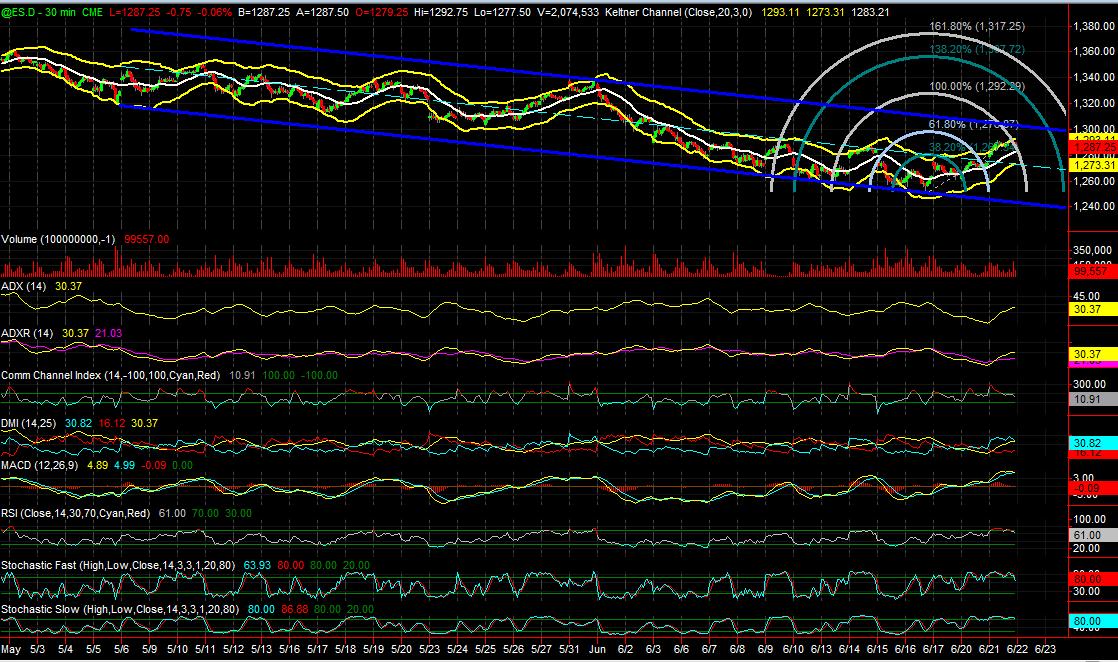
The chart speaks for itself ... 1306 is DEFINITELY the upside target ... with the downside offering plenty of opportunity!
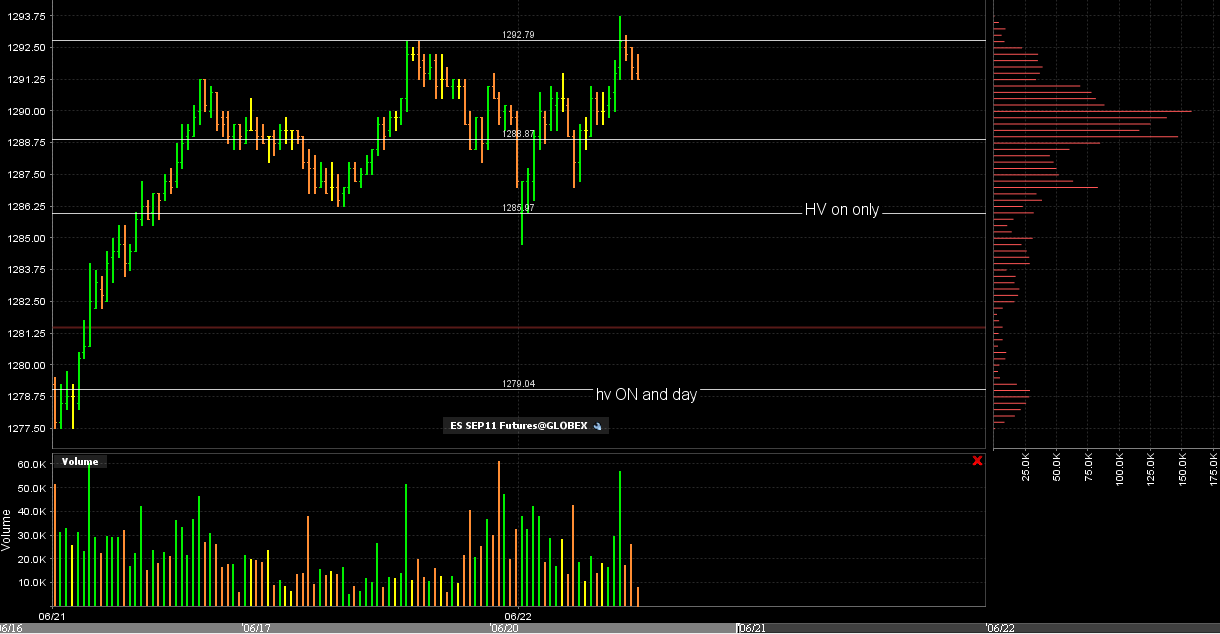
here is how that volume looks.....with the key areas at 86 , 89 and 92 marked off
Click image for original size
Bruce, when you set-up your IB chart, do you limit the amount of data in the lookback.
How do you control the amount of data used to produce the volume histogram on the side?
in chart parameters do you just select "1 day" 5 min bars?
How do you control the amount of data used to produce the volume histogram on the side?
in chart parameters do you just select "1 day" 5 min bars?
Bruce, was that a 5-min chart? volume chart?
with Ib I go back two days but that is usually only to show a visual presentation to the forum. I was babbling about the bell shape yesterday afternoon in that thread. Nothing changed that view yet and you can see how todays session has unfolded. I'm not a huge fan of combining multiple days into one profile anymore.
Since this is volume it doesn't matter what time frame u use...I showed the 5 minute as that is my preferred bar chart. You will get the same visual with 15 or 30 minute bars...let me know if that is clear
Since this is volume it doesn't matter what time frame u use...I showed the 5 minute as that is my preferred bar chart. You will get the same visual with 15 or 30 minute bars...let me know if that is clear
that is a 5 minute bar chart Lisa with the price histogram selected in IB under "chart parameters".....it is suppose to be the same as a volume histogram......
I just found an unfilled Air Pocket(81.75 - 82.00) from yesterday morning 6/21 @10am est. Would this still have any relevance? Very little relevance? Stupid question? Just curious.
Bruce, are you using IB charts?
that air pocket is very, very relevant...Trade queen...look at where the Overnight low stopped...
yes..that is what I trade from....everything else is secondary to those...but I generate my levels with my IRT data and now data from DTN IQ at the days close and premarket...I don't get realtime data for dtn iq
Originally posted by Lisa P
Bruce, are you using IB charts?
Seen that and figured that upset a lot of people. Do we have a reason why things like this don't happen when they so often do?
My guess would be the masses jumped on the band wagon and in turn prevented it?
My guess would be the masses jumped on the band wagon and in turn prevented it?
Originally posted by BruceM
that air pocket is very, very relevant...Trade queen...look at where the Overnight low stopped...
Wow... Bangerrang!
Emini Day Trading /
Daily Notes /
Forecast /
Economic Events /
Search /
Terms and Conditions /
Disclaimer /
Books /
Online Books /
Site Map /
Contact /
Privacy Policy /
Links /
About /
Day Trading Forum /
Investment Calculators /
Pivot Point Calculator /
Market Profile Generator /
Fibonacci Calculator /
Mailing List /
Advertise Here /
Articles /
Financial Terms /
Brokers /
Software /
Holidays /
Stock Split Calendar /
Mortgage Calculator /
Donate
Copyright © 2004-2023, MyPivots. All rights reserved.
Copyright © 2004-2023, MyPivots. All rights reserved.