Weekly ES Prep Work
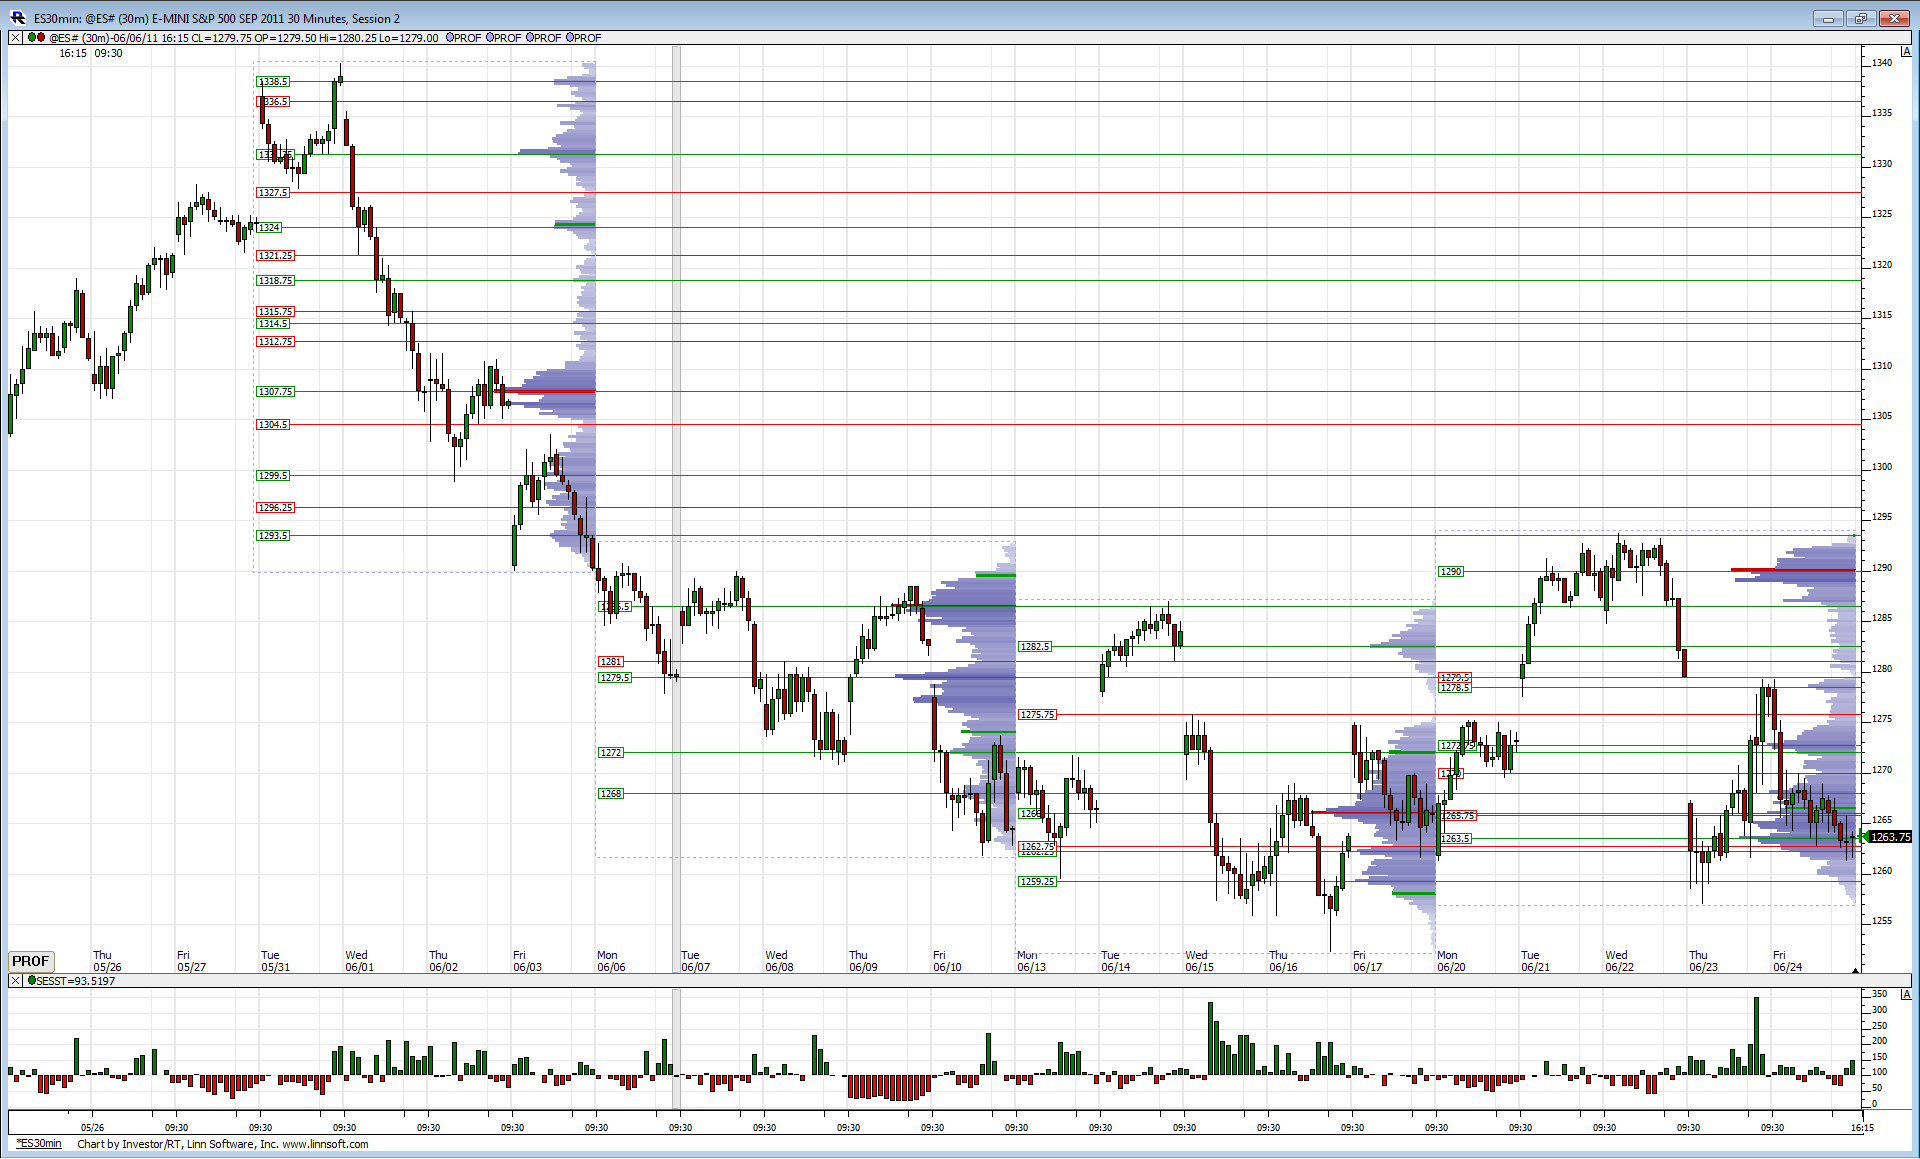
Attached is a chart with volume profiles drawn across the last four weeks. The chart is big, I know, hope everyone can see it. Something useful to gleam is the difference between the first week and the last three. Notice the first week is basically straight down in terms of price and the profile shows no real volume bulges except around 1307 area. Classic trending profile pattern, meaning price will move in a given direction until volume is willing to come in.
Now the next three weeks are quite different, they show volume bulges on both the highs and the lows. Essentially its been a big 40 pt trading range over the last three weeks.
So, we had real selling (or at least long covering) from the first week of June, then prices have gone sideways. The 1293.75 high from last week and the 1252.25 low of the week prior are extremely important resistance and support in my view and we need to be highly conscious of them when revisited to tell us if that selling from the first week of June is still the major controller or if a rotation has occurred back into bullish hands.
Just one way to look at things.
Click image for original size
Something else to keep in mind. This is weekly RTH only ES continuous Chart. Trend line drawn from the March 2009 low. Some serious trend line support close by and it coincides with the March 18, 2011 weekly low.
I realize we are all day time frame traders on this forum but its extremely important to be aware of the BIG zones where long term money is watching.
I realize we are all day time frame traders on this forum but its extremely important to be aware of the BIG zones where long term money is watching.
Click image for original size

Gosh Lorn, thanks for taking the time to post these charts for us.
Re: your last chart... Lisa posted a similar chart Friday (her timing was perfect, BTW).
I understood the significance Friday, but was unclear (at first!) how the it fit with the first two charts. If I'm correct the first five (four really) are buying tails, but the last two would be selling tails?? A momentary laps of confusion.
After re-reading and comparing to your first two charts, it has become much more clear! Especially the part "it coincides with the March 18, 2011 weekly low."
With this, I believe I'm on the right track. Thanks again!
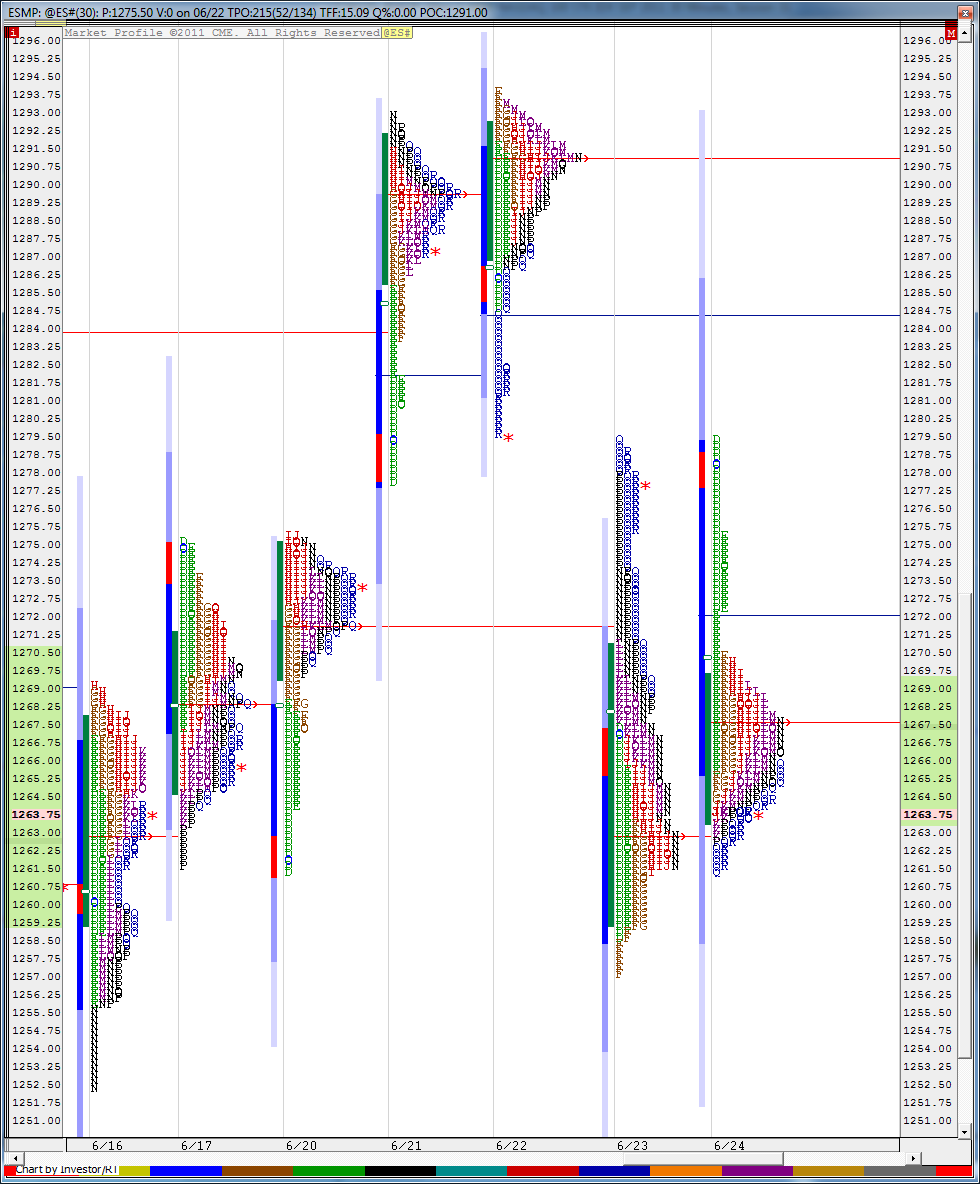
Friday's profile shows a selling tail but not the day before. A tail is when a single print TPO is present at a price extreme. Technically all it needs is two TPO's to define a tail but Thursday's look is a bit suspect in my book as it had a buying tail much earlier in the day and Friday trade was within Thursday's range.
You are on the right track. Keep it up.
You are on the right track. Keep it up.
Originally posted by TradeQueen
Gosh Lorn, thanks for taking the time to post these charts for us.
Re: your last chart... Lisa posted a similar chart Friday (her timing was perfect, BTW).
I understood the significance Friday, but was unclear (at first!) how the it fit with the first two charts. If I'm correct the first five (four really) are buying tails, but the last two would be selling tails?? A momentary laps of confusion.
After re-reading and comparing to your first two charts, it has become much more clear! Especially the part "it coincides with the March 18, 2011 weekly low."
With this, I believe I'm on the right track. Thanks again!
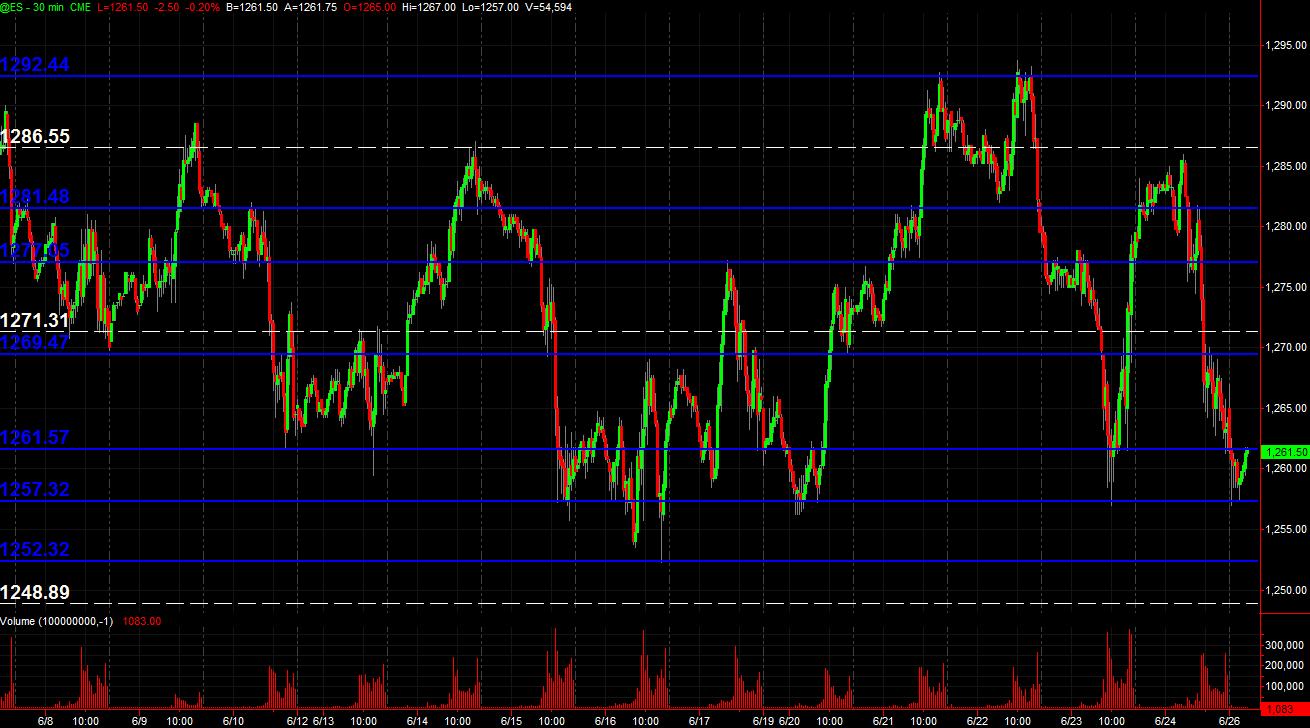
Here's my "map" of the ES (All Trading Hours) showing PASR using TS ... Blue lines are potential significant Support and/or Resistance zones ... the dashed white lines are the Weekly Pivots.
Click image for original size
Some ES Volume Profile charts using Thinkorswim:
(gray background is non-RTH ‘overnight’ trading)
Top Left: 5min chart of 2 days data ATH
Top Right: 5min chart of 2 days data RTH
Bottom Left: 5min chart of 1 days data ATH
Bottom Right: 5min chart of current session beginning with ATH
Hope some find this helpful!
(gray background is non-RTH ‘overnight’ trading)
Top Left: 5min chart of 2 days data ATH
Top Right: 5min chart of 2 days data RTH
Bottom Left: 5min chart of 1 days data ATH
Bottom Right: 5min chart of current session beginning with ATH
Click image for original size

Hope some find this helpful!
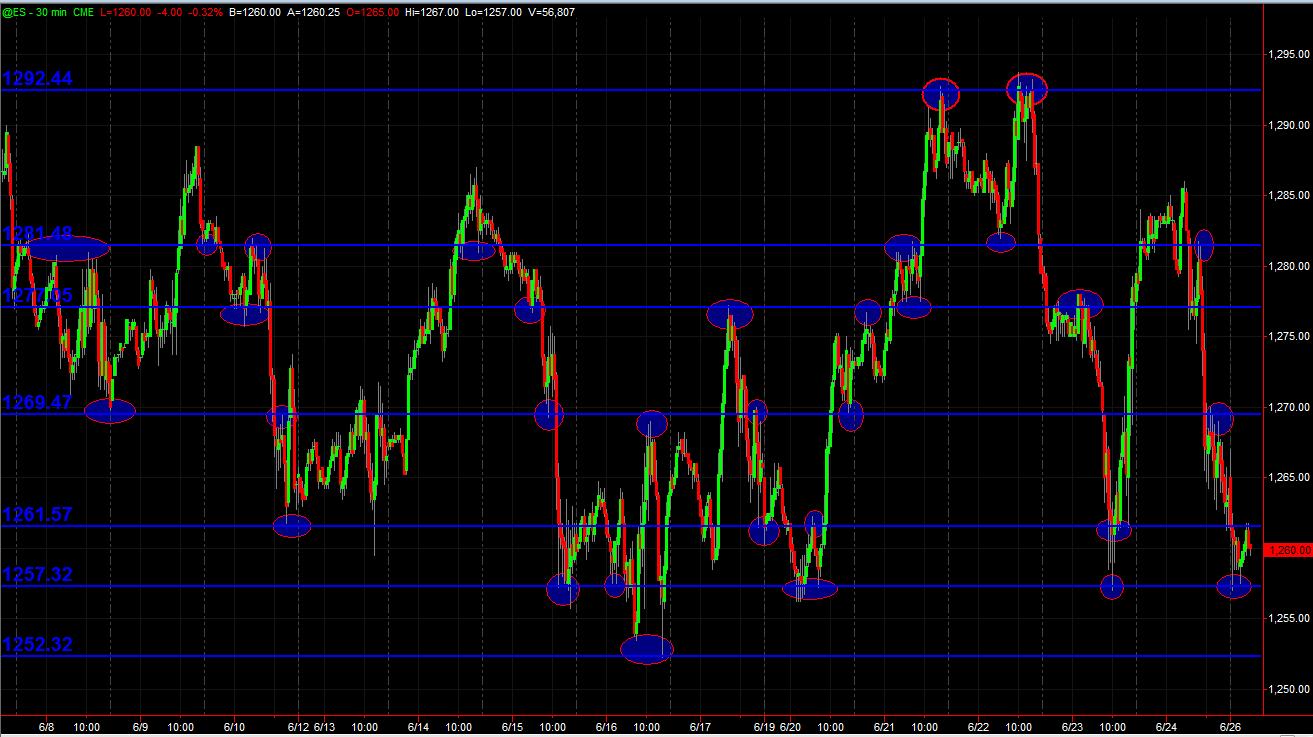
Support Resistance levels derived from ES price action ain't rocket science, as I've related before ... pretty basic stuff. But thought I'd share what "I see" when drawing in my lines/zones. I've put circles/ellipses around the prices where it makes sense to me as PASR levels. This isn't too dissimilar from Low Volume Node VP "mapping" ... but isn't exactly the same thing. Just thought I'd include this chart (same as a couple of posts above), but with what/where/why I drew in the lines or "zones" where I did for a map coming into Monday's trading session. Everyone sees things differently, but I hope this may be helpful for what has been useful for me over the years from an S/R standpoint of the index.
Just a Monkey's View.
Click image for original size
Just a Monkey's View.
thanks Lorn and MM for the postings. great stuff.
Hi Monkey Meat,
Thanks for posting /es charts on 06/26/211. I also use TOS and was thinking of subscribing to Market Delta for Volume Profile. I am new to Volume Profile.
I have heard lot of traders talking about Market Delta software providing the best market Profile charts etc.. I backed off from subscribing to market delta for the time being.
If you or anyone else are familiar with market Delta charts, can you share advantages of using market delta vs TOS or TS?
Thanks.
Market Delta is a fine piece of software, however, if you do not need the footprint charts which MD has a trademark on, then get Investor RT software which is the exact same piece of software minus the footprint charts as MD, and a lot cheaper.
Originally posted by BruceM
as usual you are a piece of work Lorn...
I try to keep all the pieces from coming apart but doesn't work most of the time...
Emini Day Trading /
Daily Notes /
Forecast /
Economic Events /
Search /
Terms and Conditions /
Disclaimer /
Books /
Online Books /
Site Map /
Contact /
Privacy Policy /
Links /
About /
Day Trading Forum /
Investment Calculators /
Pivot Point Calculator /
Market Profile Generator /
Fibonacci Calculator /
Mailing List /
Advertise Here /
Articles /
Financial Terms /
Brokers /
Software /
Holidays /
Stock Split Calendar /
Mortgage Calculator /
Donate
Copyright © 2004-2023, MyPivots. All rights reserved.
Copyright © 2004-2023, MyPivots. All rights reserved.