ES TUES 7-12-11
The overnight Low was 1295.25
50% of last month's RTH range = 1294.00
50% of last month's 24hr range = 1297.25
IMHO, Low for the 24hour is probably already in
This is OpEx week. specialists have already sucked the premium out of the calls. Maybe it's time for them to sell the premium inflated Puts before they come in with fists-o-cash to push prices higher for a premium wipeout of the puts.
50% of the current week is 1317.25, Pivot (RTH) for today is 1319, this zone should be tagged.
...AND, when I look at whatever it is that TS produces for it's activity bars (sort of like volume profile) has something very similar to single prints 1312 to 1315, so if/when I'll say when price prints 3 ticks above the overnight H of 1312.50, mini squeeze higher.
Thanks for analysis, Paul
If we keep below 1220, I have 1298 and 1293 as support levels. So pretty close to yours
You're welcome, Lisa.
minimum expectation reached as ES has printed 1317.25.
considering the size of the overnight range, don't know now.
off to do research.
minimum expectation reached as ES has printed 1317.25.
considering the size of the overnight range, don't know now.
off to do research.
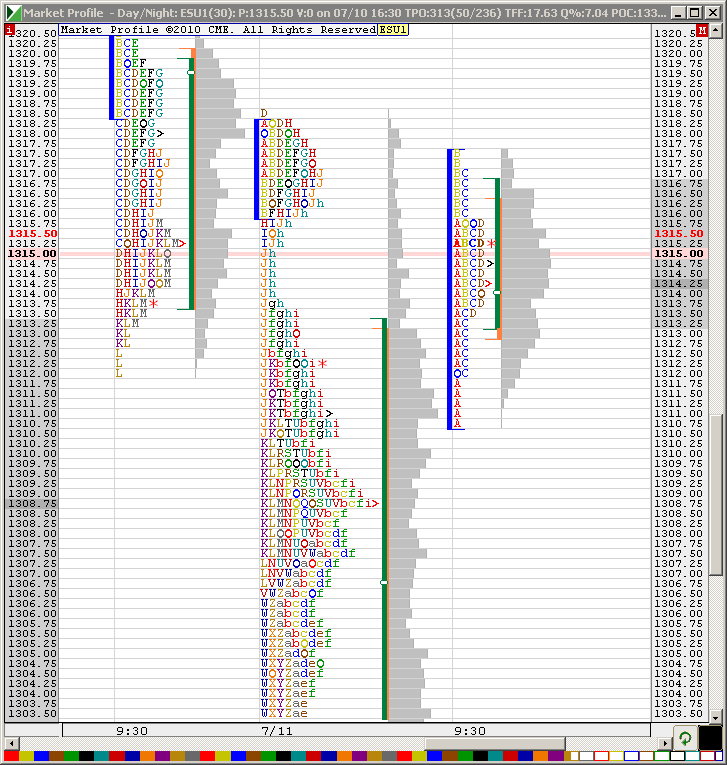
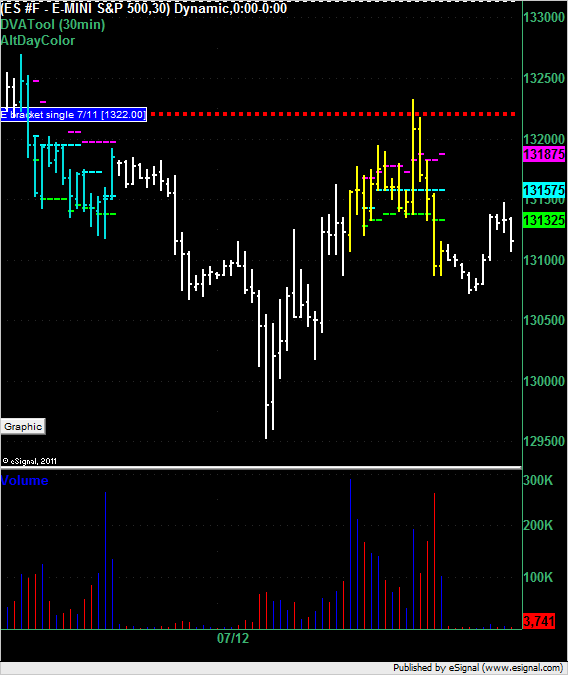
From a Market Profile point of view, above us, there's the VAH at 1319.75 and a single print at 1322 even.
(was)Currently using 1313.75 and 1317.25 as s/r
1315 the PP
1313.25 current wave 50% level
1312 area 61.8% area
I think 11.75 yesterdays low
1313.50 50% level between 1320 and 1307
also thinking 1319 or 1324, trade what I get though as either diagonal up or correction
1315 the PP
1313.25 current wave 50% level
1312 area 61.8% area
I think 11.75 yesterdays low
1313.50 50% level between 1320 and 1307
also thinking 1319 or 1324, trade what I get though as either diagonal up or correction
Market Profile so far:
[1317.75] E
[1317.50] E
[1317.25] E
[1317.00] EF
[1316.75] EF [DVAH]
[1316.50] EF
[1316.25] EF
[1316.00] EFG
[1315.75] DEFG
[1315.50] DEFG
[1315.25] DEFG
[1315.00] DEFG
[1314.75] DEFG
[1314.50] DEFG
[1314.25] DEFG [DPOC]
[1314.00] DEFG
[1313.75] DEFG
[1313.50] DFG
[1313.25] DF [DVAL]
[1313.00] DF
[1312.75] DF
[1312.50] DF
[1312.25] DF
[1312.00] DF
[1311.75] D
[1311.50] D
[1311.25] D
[1311.00] D
[1310.75] D
DavidS, see the PP and other numbers on MyPivots page, refreshed daily
http://www.mypivots.com/dailynotes/symbol/445/-1/e-mini-sp500-september-2011
http://www.mypivots.com/dailynotes/symbol/445/-1/e-mini-sp500-september-2011
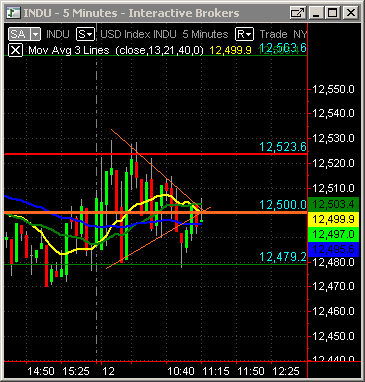
ES tested and held O/N value area high. I went long, first target INDU 12500 (pivot point), second O/N high
Click image for original size
INDU 5 min chart
Click image for original size
Just a single print recap from today. The single print left on the chart at 1322 even yesterday would have suffered a 1.25 point draw down if used as a short entry location.
Click image for original size
Emini Day Trading /
Daily Notes /
Forecast /
Economic Events /
Search /
Terms and Conditions /
Disclaimer /
Books /
Online Books /
Site Map /
Contact /
Privacy Policy /
Links /
About /
Day Trading Forum /
Investment Calculators /
Pivot Point Calculator /
Market Profile Generator /
Fibonacci Calculator /
Mailing List /
Advertise Here /
Articles /
Financial Terms /
Brokers /
Software /
Holidays /
Stock Split Calendar /
Mortgage Calculator /
Donate
Copyright © 2004-2023, MyPivots. All rights reserved.
Copyright © 2004-2023, MyPivots. All rights reserved.